


![How to Build an AI Assistant with Keith Moehring [MAICON 2025 Speaker Series]](https://www.marketingaiinstitute.com/hubfs/MAICON-Speaker_Series%20%281%29.png)


![[The AI Show Episode 156]: AI Answers - Data Privacy, AI Roadmaps, Regulated Industries, Selling AI to the C-Suite & Change Management](https://www.marketingaiinstitute.com/hubfs/ep%20156%20cover.png)
![[The AI Show Episode 155]: The New Jobs AI Will Create, Amazon CEO: AI Will Cut Jobs, Your Brain on ChatGPT, Possible OpenAI-Microsoft Breakup & Veo 3 IP Issues](https://www.marketingaiinstitute.com/hubfs/ep%20155%20cover.png)


_incamerastock_Alamy.jpg?width=1280&auto=webp&quality=80&disable=upscale#)
_Brain_light_Alamy.jpg?width=1280&auto=webp&quality=80&disable=upscale#)


![Nothing Phone (3) has a 50MP ‘periscope’ telephoto lens – here are the first samples [Gallery]](https://i0.wp.com/9to5google.com/wp-content/uploads/sites/4/2025/06/nothing-phone-3-telephoto.jpg?resize=1200%2C628&quality=82&strip=all&ssl=1)


AWS EventBridge Explorer: Visualizing Event-Driven Architectures for Easier Debugging
This is a submission for the Amazon Q Developer "Quack The Code" Challenge: Exploring the Possibilities What I Built I built AWS EventBridge Explorer, a tool designed to provide a clear and interactive visualization of AWS EventBridge event buses and their associated rules and targets. This tool addresses a significant challenge in modern, event-driven architectures: the complexity of understanding and managing event flows. Debugging microservices architectures that communicate through EventBridge's event bus and rules can be notoriously difficult and time-consuming. Tracing events across multiple services and understanding how they are transformed and routed by rules often feels like navigating a maze. AWS EventBridge Explorer simplifies this process, acting as a powerful tool for: Troubleshooting: Quickly pinpointing the source of issues by visualizing the event flow and examining rule configurations. Monitoring: Gaining a real-time overview of event activity and identifying potential bottlenecks or errors. Understanding: Providing a clear mental model of the event-driven architecture, making it easier to onboard new team members or explain complex systems. In fact, I recently used this tool to introduce a complex feature heavily reliant on event-driven communication to a coworker who was unfamiliar with EventBridge. The visualization provided a clear and intuitive way to understand the entire process, giving me a structured approach to explain the system's behavior. Instead of struggling with abstract concepts and configurations, the interactive graph provided a tangible representation that made the learning process much smoother. It's worth noting that my primary background is in JavaScript development. Building this tool in Python was a deliberate choice to explore the Python ecosystem and its tooling for backend development and automation. This project provided valuable insights into how Python can be effectively used to solve complex infrastructure and observability challenges, broadening my perspective as a developer. This project represents an unexpected and novel use of technology to enhance the developer experience with AWS. Instead of relying on lists and tables, it leverages an interactive graph to provide an intuitive understanding of event flow, rule configurations, and target mappings. This visual approach opens up new possibilities for debugging, monitoring, and even designing EventBridge architectures. Demo To fully demonstrate the functionality and interactive nature of AWS EventBridge Explorer, I've prepared a short video walkthrough: https://youtu.be/PWmRfSw4yPU The video showcases the following key features using example EventBridge configurations: Selecting an event bus from the dropdown. The interactive graph visualization of rules and targets. Exploring rule details by clicking on nodes. Filtering rules using the rule selection modal. Viewing target logs and their associated streams. (Optional) Sending a test event and observing its effect. To allow viewers to easily reproduce the scenarios shown in the video and explore the tool with concrete examples, I've created a repository with Pulumi configurations: https://github.com/sergiohromano/pulumi-event-bus-example.git This repository provides the necessary Pulumi programs to deploy the example event buses, rules, and targets used in the video. It allows users to quickly set up the infrastructure and experiment with AWS EventBridge Explorer. For those who prefer a quick visual overview or want to examine specific UI elements in detail, here are some key screenshots: Image 1: The main interface showing the event bus selection and the interactive graph. Image 2: Detailed information displayed upon selecting a rule, including its event pattern. Image 3: The rule selection modal, allowing users to filter and choose which rules to visualize. Image 4: Viewing logs for a selected target, including the log stream selection. This combination of a video, example configurations, and screenshots provides a comprehensive demonstration of AWS EventBridge Explorer's capabilities. Code Repository You can find the complete source code for AWS EventBridge Explorer on GitHub: https://github.com/sergiohromano/aws-eventbridge-explorer For easy installation, you can also find the project on PyPI: https://pypi.org/project/aws-eventbridge-explorer/ This allows others to quickly install and test the tool using pip install aws-eventbridge-explorer. How I Used Amazon Q Developer Amazon Q Developer was instrumental throughout the iterative development process of AWS EventBridge Explorer. It acted as a valuable partner, helping me refine the tool's functionality and user experience through numerous development cycles. Here are some specific examples: Accelerating Initial Development: In the early stages, I used Amazon Q Developer to quickly generate boilerplate code for tasks li
This is a submission for the Amazon Q Developer "Quack The Code" Challenge: Exploring the Possibilities
What I Built
I built AWS EventBridge Explorer, a tool designed to provide a clear and interactive visualization of AWS EventBridge event buses and their associated rules and targets. This tool addresses a significant challenge in modern, event-driven architectures: the complexity of understanding and managing event flows.
Debugging microservices architectures that communicate through EventBridge's event bus and rules can be notoriously difficult and time-consuming. Tracing events across multiple services and understanding how they are transformed and routed by rules often feels like navigating a maze. AWS EventBridge Explorer simplifies this process, acting as a powerful tool for:
- Troubleshooting: Quickly pinpointing the source of issues by visualizing the event flow and examining rule configurations.
- Monitoring: Gaining a real-time overview of event activity and identifying potential bottlenecks or errors.
- Understanding: Providing a clear mental model of the event-driven architecture, making it easier to onboard new team members or explain complex systems.
In fact, I recently used this tool to introduce a complex feature heavily reliant on event-driven communication to a coworker who was unfamiliar with EventBridge. The visualization provided a clear and intuitive way to understand the entire process, giving me a structured approach to explain the system's behavior. Instead of struggling with abstract concepts and configurations, the interactive graph provided a tangible representation that made the learning process much smoother.
It's worth noting that my primary background is in JavaScript development. Building this tool in Python was a deliberate choice to explore the Python ecosystem and its tooling for backend development and automation. This project provided valuable insights into how Python can be effectively used to solve complex infrastructure and observability challenges, broadening my perspective as a developer.
This project represents an unexpected and novel use of technology to enhance the developer experience with AWS. Instead of relying on lists and tables, it leverages an interactive graph to provide an intuitive understanding of event flow, rule configurations, and target mappings. This visual approach opens up new possibilities for debugging, monitoring, and even designing EventBridge architectures.
Demo
To fully demonstrate the functionality and interactive nature of AWS EventBridge Explorer, I've prepared a short video walkthrough:
The video showcases the following key features using example EventBridge configurations:
- Selecting an event bus from the dropdown.
- The interactive graph visualization of rules and targets.
- Exploring rule details by clicking on nodes.
- Filtering rules using the rule selection modal.
- Viewing target logs and their associated streams.
- (Optional) Sending a test event and observing its effect.
To allow viewers to easily reproduce the scenarios shown in the video and explore the tool with concrete examples, I've created a repository with Pulumi configurations:
https://github.com/sergiohromano/pulumi-event-bus-example.git
This repository provides the necessary Pulumi programs to deploy the example event buses, rules, and targets used in the video. It allows users to quickly set up the infrastructure and experiment with AWS EventBridge Explorer.
For those who prefer a quick visual overview or want to examine specific UI elements in detail, here are some key screenshots:
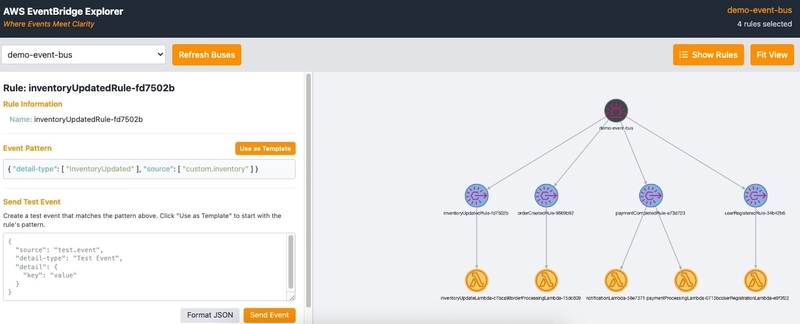
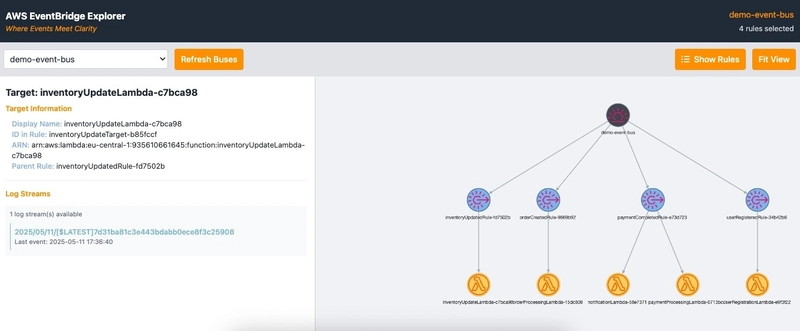
Image 1: The main interface showing the event bus selection and the interactive graph.
Image 2: Detailed information displayed upon selecting a rule, including its event pattern.
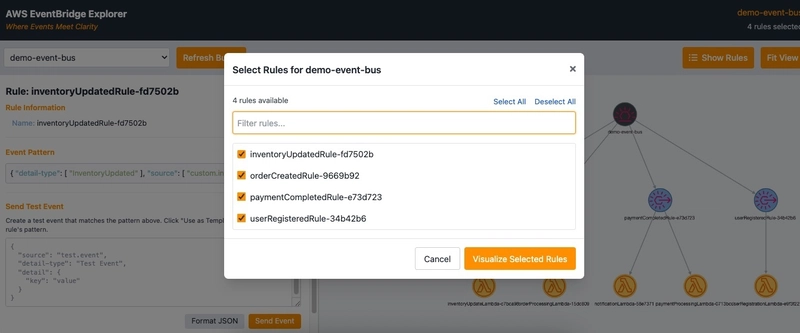
Image 3: The rule selection modal, allowing users to filter and choose which rules to visualize.
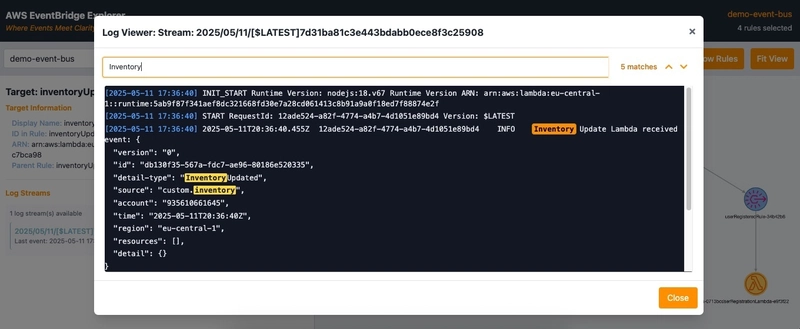
Image 4: Viewing logs for a selected target, including the log stream selection.
This combination of a video, example configurations, and screenshots provides a comprehensive demonstration of AWS EventBridge Explorer's capabilities.
Code Repository
You can find the complete source code for AWS EventBridge Explorer on GitHub:
https://github.com/sergiohromano/aws-eventbridge-explorer
For easy installation, you can also find the project on PyPI:
https://pypi.org/project/aws-eventbridge-explorer/
This allows others to quickly install and test the tool using pip install aws-eventbridge-explorer.
How I Used Amazon Q Developer
Amazon Q Developer was instrumental throughout the iterative development process of AWS EventBridge Explorer. It acted as a valuable partner, helping me refine the tool's functionality and user experience through numerous development cycles. Here are some specific examples:
Accelerating Initial Development: In the early stages, I used Amazon Q Developer to quickly generate boilerplate code for tasks like interacting with the AWS Boto3 library and setting up the basic structure of the Flask web server. This allowed me to focus on the core logic of the application rather than spending time on repetitive setup tasks. For instance, Q Developer helped me with the initial code to list event buses and fetch rules, saving me time on looking up the specific Boto3 calls.
-
Iterative UI/UX Enhancement: As the project evolved, I heavily relied on Amazon Q Developer to improve the user interface and user experience. My prompt history demonstrates this clearly:
- I used prompts like "better let's make an interactive ui because I can't see anything and also I want to select to see the details" to guide Q Developer in suggesting ways to enhance the initial CLI tool with a GUI.
- When I needed to add rule filtering ("i would like to pick which rules are going to be displayed because I have a lot and I'm not checking all of them"), Q Developer provided code snippets and strategies for implementing this feature in the UI.
- For more complex UI changes, like implementing a side drawer for details and logs ("the ui looks better, but is not loading the event buses, also I want to add a message that is loading them... also I want to show the details and streams and logs in a side drawer instead of a modal"), Amazon Q Developer helped me structure the code and integrate the new components seamlessly.
Debugging and Problem Solving: Amazon Q Developer was also invaluable in debugging and resolving issues. For example, when I encountered a bug where the application was consistently selecting the last event bus ("there is bug that always pick me the last event-bus"), Q Developer helped me identify the source of the error in my code and suggest a fix.
Exploring Alternative Solutions: Throughout the development, I often used Amazon Q Developer to explore different implementation approaches. For instance, when I wanted to improve the graph visualization, I experimented with different libraries. Amazon Q Developer provided code examples and comparisons of libraries like Plotly and Cytoscape.js, ultimately helping me choose the best solution for my needs ("replace the graph with plotly" which evolved into using Cytoscape.js).
Code Refactoring and Optimization: As the project grew, I used Amazon Q Developer to help me refactor and optimize the code. This included suggestions for improving code readability, modularizing the project structure ("i want to improve the project, having differents file so this can be run with a gui or without like a cli app"), and enhancing performance.
In essence, Amazon Q Developer acted as a collaborative partner, accelerating my development process, providing valuable insights, and helping me create a more robust and user-friendly tool. The attached "prompts.md" file, located in the docs/ [https://github.com/sergiohromano/aws-eventbridge-explorer/blob/main/docs/prompts.md] folder of the GitHub repository, provides a detailed log of my interactions with Amazon Q Developer throughout this project.