


![[The AI Show Episode 151]: Anthropic CEO: AI Will Destroy 50% of Entry-Level Jobs, Veo 3’s Scary Lifelike Videos, Meta Aims to Fully Automate Ads & Perplexity’s Burning Cash](https://www.marketingaiinstitute.com/hubfs/ep%20151%20cover.png)


![Apple Shares Official Trailer for 'The Wild Ones' [Video]](https://www.iclarified.com/images/news/97515/97515/97515-640.jpg)


This interactive map shows you what your NYC block looked like 400 years ago
At the New York Botanical Garden (NYBG), a team of scientists just published an interactive map that explores what all five boroughs of New York City looked like 400 years ago—and you can search for your own block. The map, called the Welikia Project, was made by the NYBG’s Urban Conservation team. It takes the city block by block, uncovering the history of flora, fauna, and Indigenous people that once lived in each area before it became an urban environment. The name “welikia” is borrowed from the Lenape people, who lived in what’s now New York City for 8,000 to 10,000 years before European settlers; it means “my good home.” Viewers can use the tool to look at almost any area in the five boroughs—including Grand Central, Yankee Stadium, and individual streets—to see what kinds of trees might have grown there, whether the area was host to any particular species of animals, and how Indigenous people may have used the land’s resources. The project was spearheaded by Eric Sanderson, a historical ecologist and vice president of urban conservation strategy at NYBG who has studied New York’s ecology for over two decades. Sanderson says the map has a range of uses, from helping New Yorkers feel more connected to their city to offering new insights to city planners and urban flood prevention experts. [Screenshot: welikia.org] A decades-long project Sanderson has been studying the historical ecology of NYC since the early aughts, after moving to the city in 1998 to work at the Wildlife Conservation Society. His years-long deep dive began while browsing through used books at The Strand: He came across a book full of historical maps of New York City. One particular map—the British headquarters during the American Revolution—showed Manhattan when it was a fledgling city at the very southern tip of the island. “The rest of the map was hills, streams, wetlands, and beaches—not what we normally think of when we think of New York City,” Sanderson says. “So I georeferenced that map, and I started to think about how the streams and the wetlands and the beaches related to the modern geography of the city today.” That initial spark of curiosity ultimately became the 2009 bestselling book Mannahatta: A Natural History of New York City, which reconstructed the flora and fauna that once made up Manhattan. The book went on to become an exhibition at the Museum of the City of New York, a National Geographic cover, and a TED Talk. “After that, I was kind of looking to go back to my conservation work,” Sanderson says. “And yet, people kept asking me: ‘Aren’t you going to do Brooklyn?’ or, ‘Don’t you live in the Bronx?’ or, ‘Have you ever been to Staten Island?’ So I started pulling together pieces of information, doing more reading, and looking at historical maps. Eventually that led to [the Welikia Project].” [Screenshot: welikia.org] The Welikia Project Currently, Sanderson is working on another book called The Welikia Atlas and Gazetteer: A Guide to New York City’s Indigenous Landscape, slated for release in 2026, that maps the historical ecology of all five New York City boroughs. In the meantime, he and his team at NYBG have spent the past year and a half assembling the Welikia Project website, which compiles all of Sanderson’s new research into an easy-to-parse interactive map. Sourcing the historical map data to build a recreation of early New York presented a host of challenges. Whereas Sanderson had the British headquarters map as a touchstone for his Mannahatta work, he says this larger project was much more piecemeal. “When we moved to the scope of the whole city, there was no one map that was very early and showed me all [the things I was looking for],” Sanderson says. “We spent a large part of the project just going to map archives, like the Library of Congress, the New York Public Library, and the British Library in England, as well as many others.” In all, Sanderson’s team georeferenced more than 600 maps from the late 18th century to the late 19th century, analyzing hundreds of puzzle pieces to assemble an overarching view of the city pre-urbanization. Using this influx of data, they then built a digital map by layers, creating one layer illustrating all of the streams, another for the topography, another for the marshes, and so on until the bigger picture began to take shape. Another branch of the project entailed sifting through biological data, as well as plant and animal surveys, to understand the flora and fauna that would have inhabited the region 400 years ago. Then, Sanderson’s team used a kind of prediction tool called a Muir web to take both the topographical data and the biological data and produce an estimate of what the habitat most likely looked like on every NYC block. According to the map, Grand Central Station was once home to white wood aster plants and green frogs; Staten Island Mall hosted red-backed salamanders; and Yankee Stadium was a l
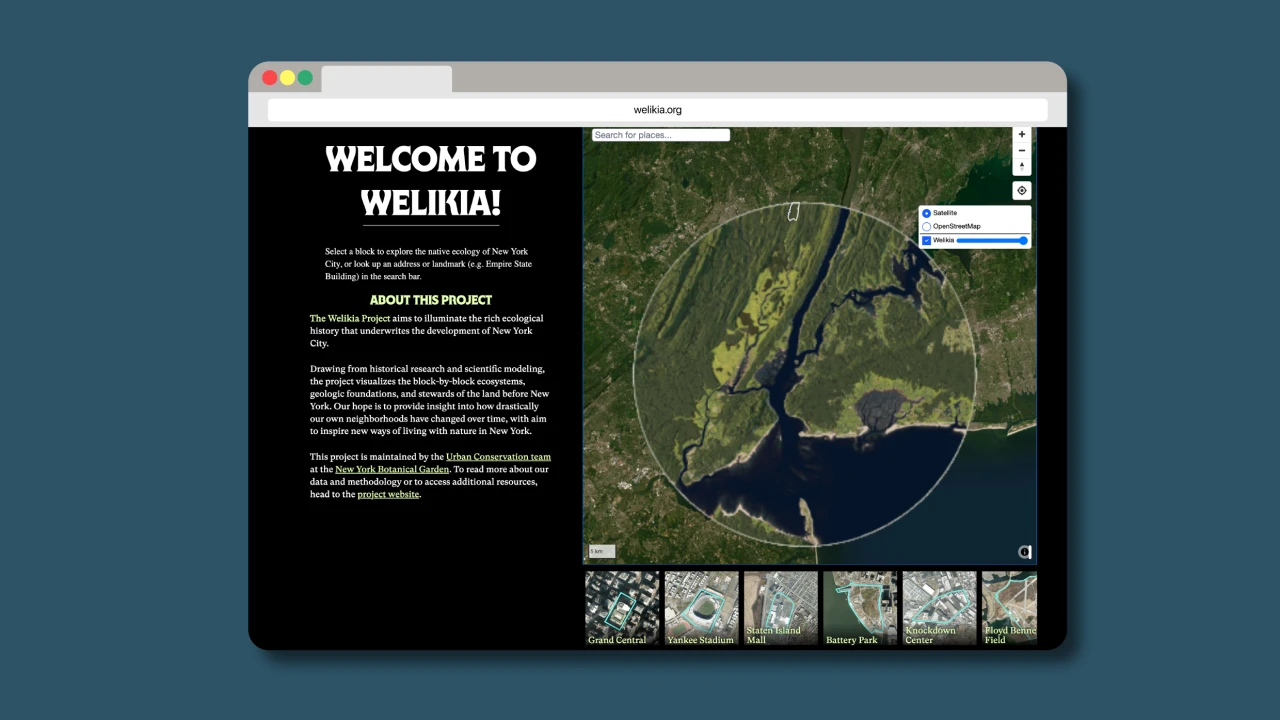
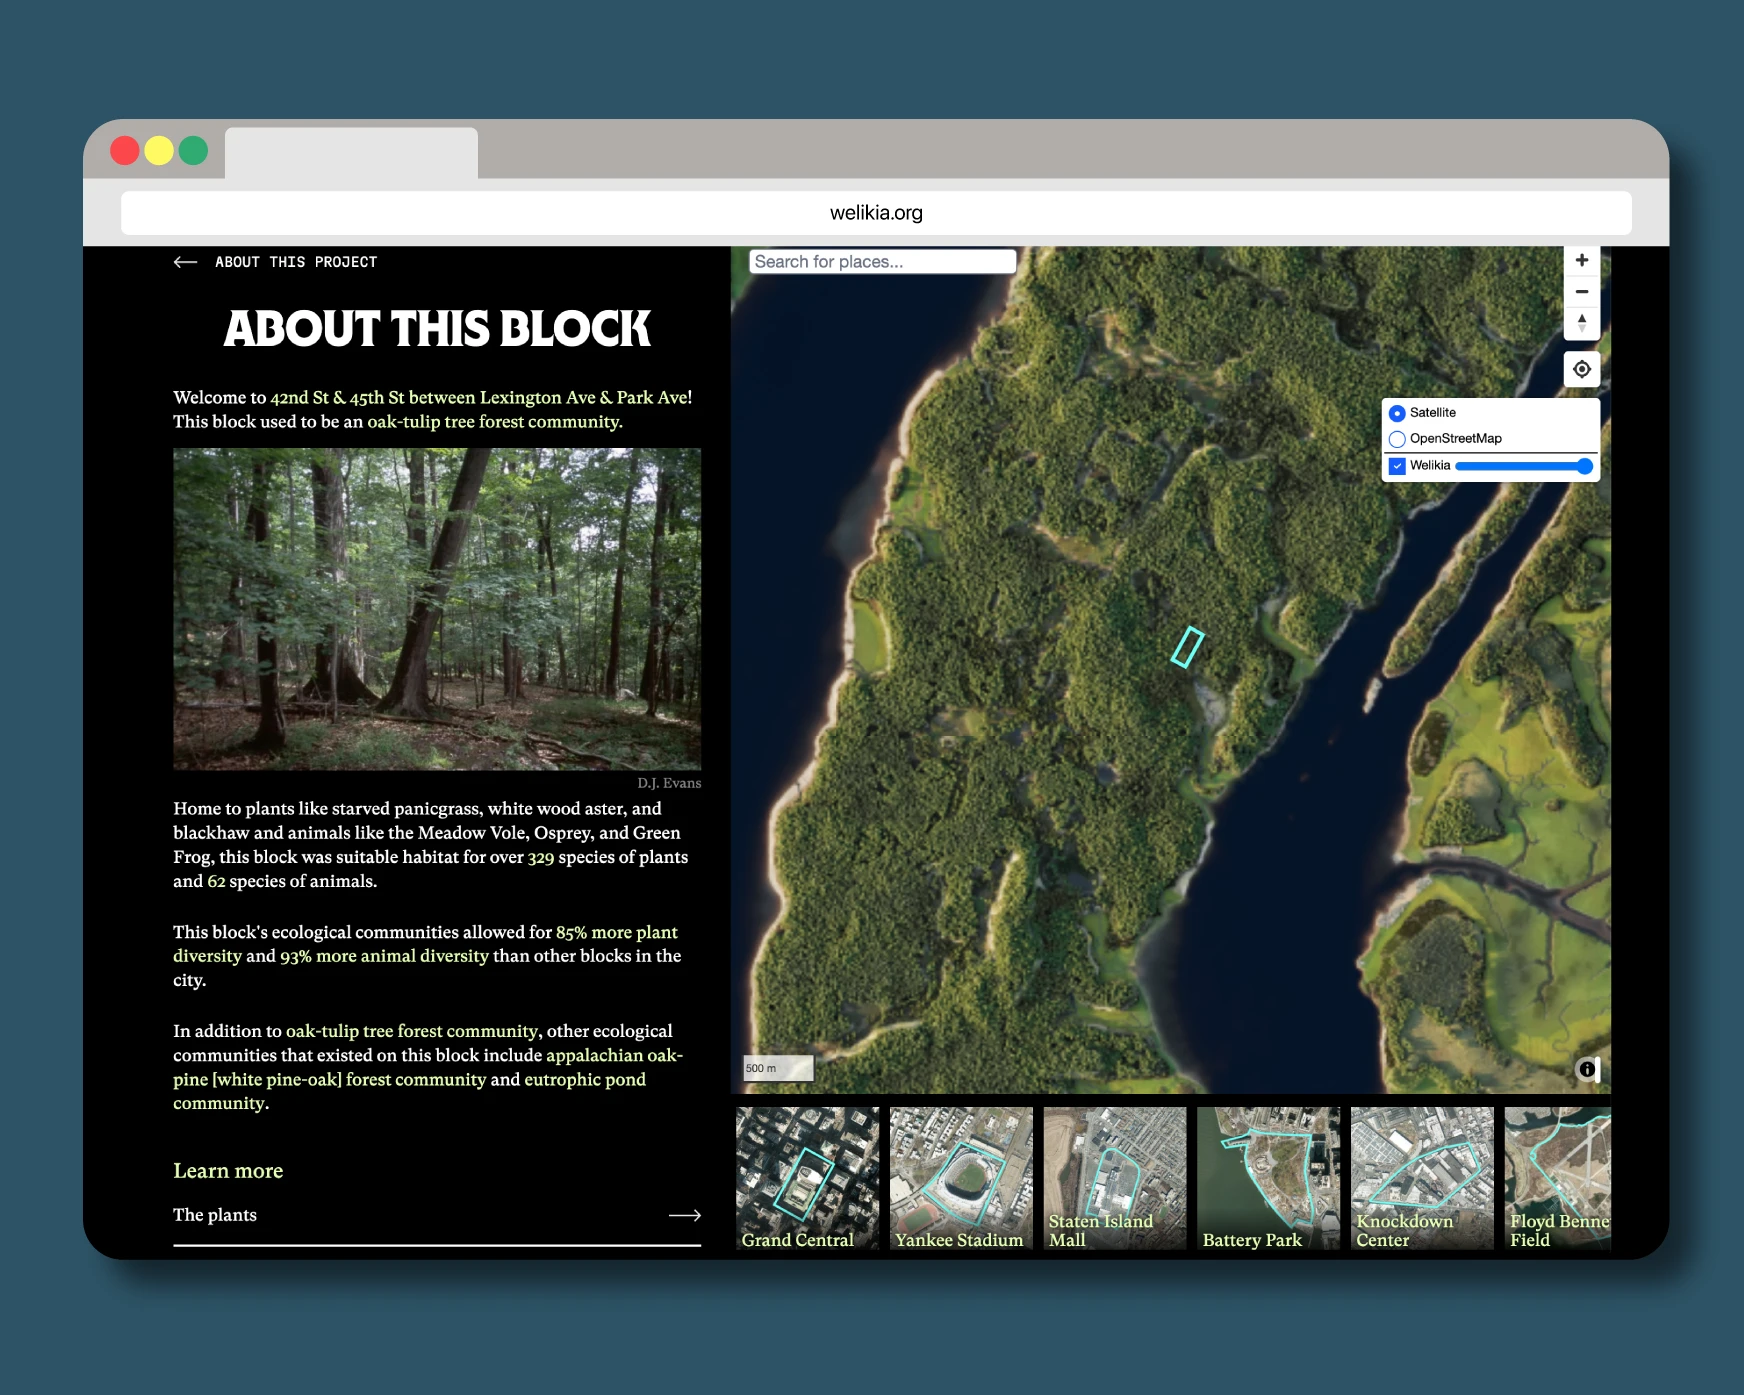
At the New York Botanical Garden (NYBG), a team of scientists just published an interactive map that explores what all five boroughs of New York City looked like 400 years ago—and you can search for your own block.
The map, called the Welikia Project, was made by the NYBG’s Urban Conservation team. It takes the city block by block, uncovering the history of flora, fauna, and Indigenous people that once lived in each area before it became an urban environment. The name “welikia” is borrowed from the Lenape people, who lived in what’s now New York City for 8,000 to 10,000 years before European settlers; it means “my good home.”
Viewers can use the tool to look at almost any area in the five boroughs—including Grand Central, Yankee Stadium, and individual streets—to see what kinds of trees might have grown there, whether the area was host to any particular species of animals, and how Indigenous people may have used the land’s resources.
The project was spearheaded by Eric Sanderson, a historical ecologist and vice president of urban conservation strategy at NYBG who has studied New York’s ecology for over two decades. Sanderson says the map has a range of uses, from helping New Yorkers feel more connected to their city to offering new insights to city planners and urban flood prevention experts.
A decades-long project
Sanderson has been studying the historical ecology of NYC since the early aughts, after moving to the city in 1998 to work at the Wildlife Conservation Society. His years-long deep dive began while browsing through used books at The Strand: He came across a book full of historical maps of New York City. One particular map—the British headquarters during the American Revolution—showed Manhattan when it was a fledgling city at the very southern tip of the island.
“The rest of the map was hills, streams, wetlands, and beaches—not what we normally think of when we think of New York City,” Sanderson says. “So I georeferenced that map, and I started to think about how the streams and the wetlands and the beaches related to the modern geography of the city today.”
That initial spark of curiosity ultimately became the 2009 bestselling book Mannahatta: A Natural History of New York City, which reconstructed the flora and fauna that once made up Manhattan. The book went on to become an exhibition at the Museum of the City of New York, a National Geographic cover, and a TED Talk.
“After that, I was kind of looking to go back to my conservation work,” Sanderson says. “And yet, people kept asking me: ‘Aren’t you going to do Brooklyn?’ or, ‘Don’t you live in the Bronx?’ or, ‘Have you ever been to Staten Island?’ So I started pulling together pieces of information, doing more reading, and looking at historical maps. Eventually that led to [the Welikia Project].”
The Welikia Project
Currently, Sanderson is working on another book called The Welikia Atlas and Gazetteer: A Guide to New York City’s Indigenous Landscape, slated for release in 2026, that maps the historical ecology of all five New York City boroughs. In the meantime, he and his team at NYBG have spent the past year and a half assembling the Welikia Project website, which compiles all of Sanderson’s new research into an easy-to-parse interactive map.
Sourcing the historical map data to build a recreation of early New York presented a host of challenges. Whereas Sanderson had the British headquarters map as a touchstone for his Mannahatta work, he says this larger project was much more piecemeal.
“When we moved to the scope of the whole city, there was no one map that was very early and showed me all [the things I was looking for],” Sanderson says. “We spent a large part of the project just going to map archives, like the Library of Congress, the New York Public Library, and the British Library in England, as well as many others.”
In all, Sanderson’s team georeferenced more than 600 maps from the late 18th century to the late 19th century, analyzing hundreds of puzzle pieces to assemble an overarching view of the city pre-urbanization. Using this influx of data, they then built a digital map by layers, creating one layer illustrating all of the streams, another for the topography, another for the marshes, and so on until the bigger picture began to take shape.
Another branch of the project entailed sifting through biological data, as well as plant and animal surveys, to understand the flora and fauna that would have inhabited the region 400 years ago. Then, Sanderson’s team used a kind of prediction tool called a Muir web to take both the topographical data and the biological data and produce an estimate of what the habitat most likely looked like on every NYC block.
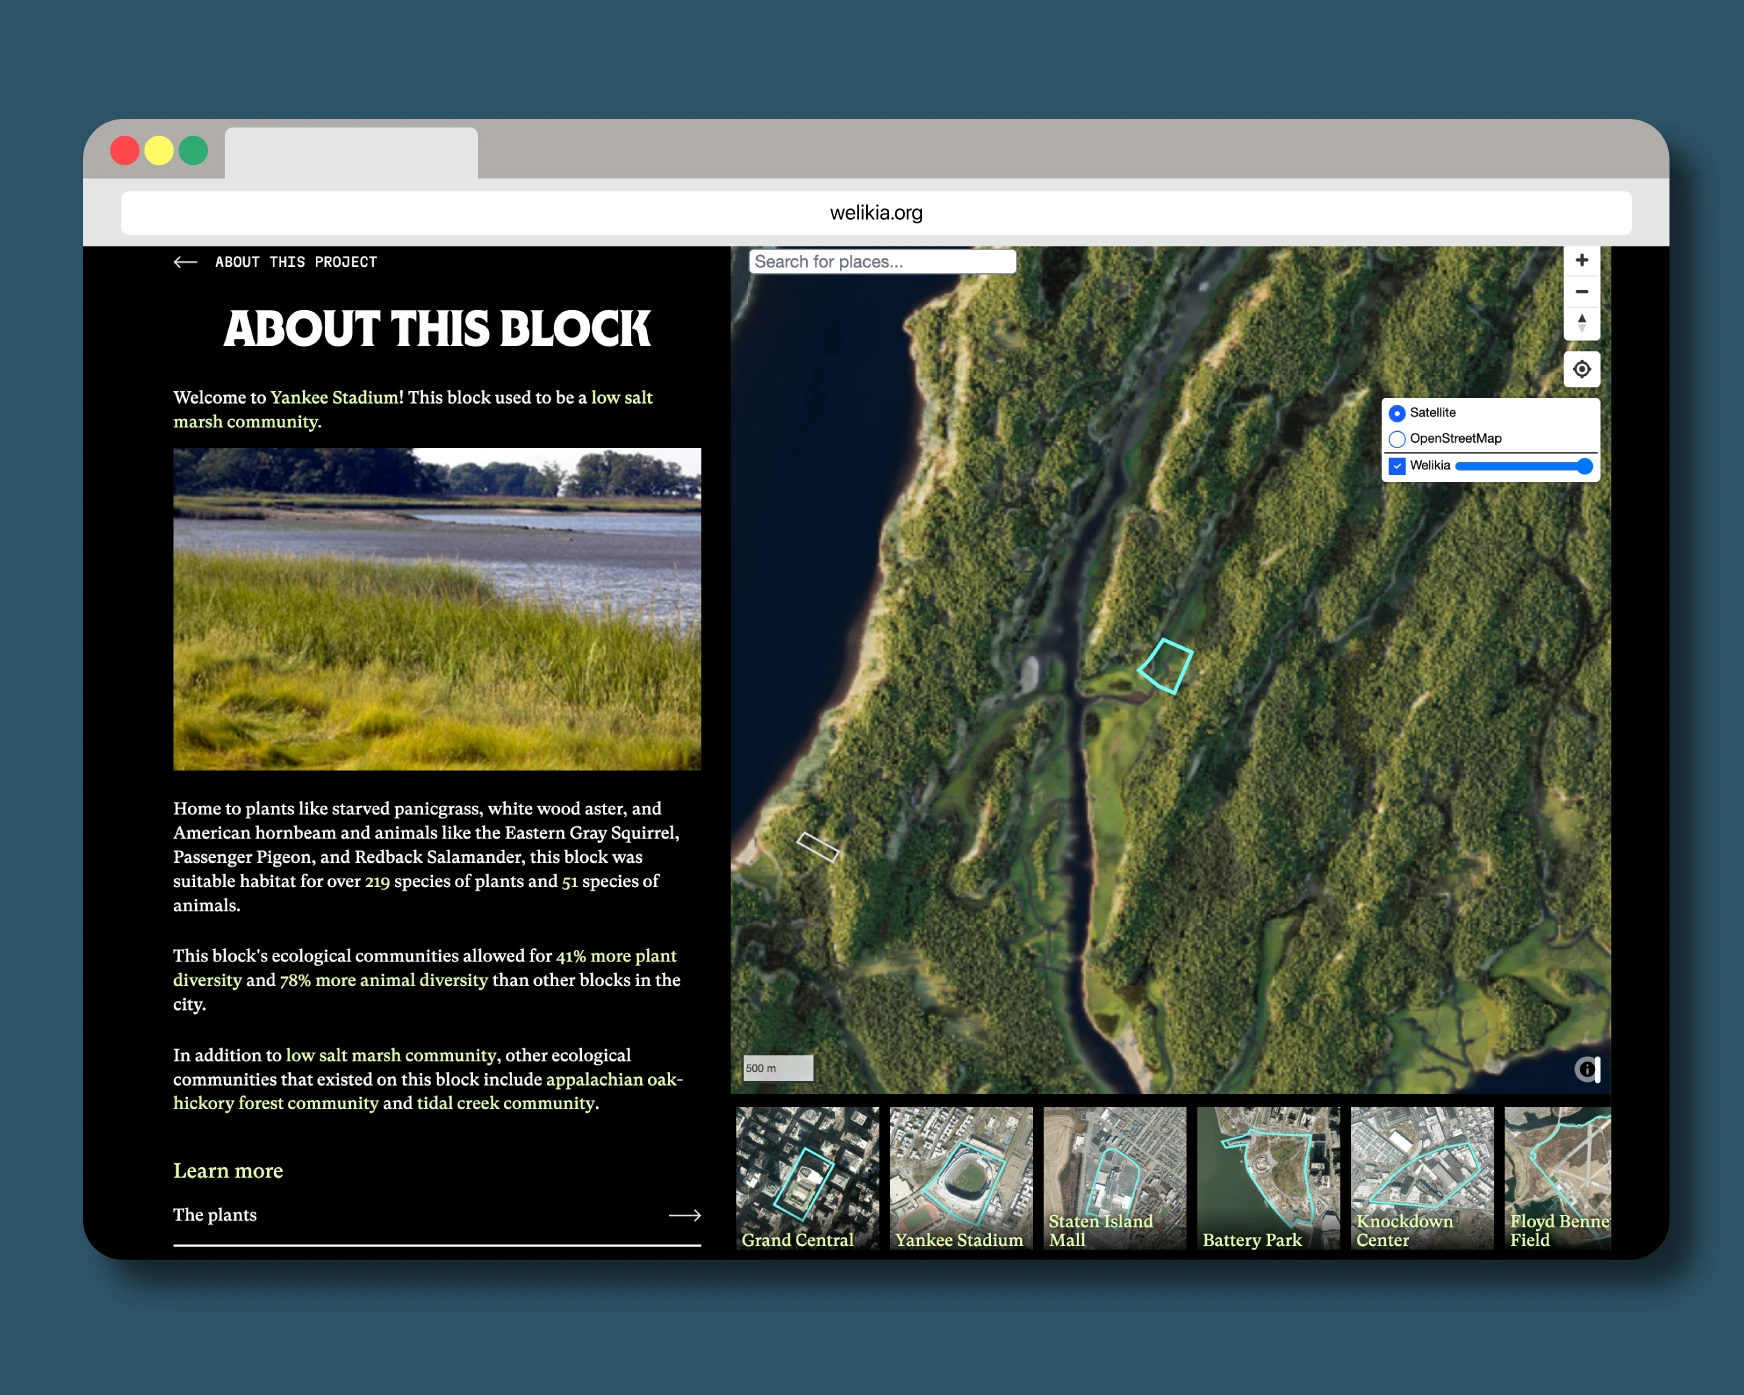
According to the map, Grand Central Station was once home to white wood aster plants and green frogs; Staten Island Mall hosted red-backed salamanders; and Yankee Stadium was a low salt marsh community inhabited by eastern gray squirrels and passenger pigeons.
Future applications
Sanderson says the Welikia Project could be used for a number of practical applications, from helping landscape architects understand the native environment to giving urban planners a better sense of the city’s makeup. Currently, he’s working on a follow-up study to assist in urban flood planning.
According to a recent study from the Regional Plan Association, as many as 82,000 housing units in and around New York City could be lost due to flooding by 2040, and that could double to 160,000 by 2070. Sanderson plans to map all of the places that were historically aquatic ecosystems—like streams, wetlands, and beaches—in order to produce more accurate predictions of future flood patterns.
For the everyday New Yorker, Sanderson hopes that the Welikia Project provides a chance to better understand the landscape that serves as their home.
“What I really want people to do is to zoom into their block where they live, and to see that it was a forest or a wetland, and to think about what that means for them,” Sanderson says. “For some people, I think that’s a testimony to how much the world has changed over the last 400 years. One of my colleagues said, ‘somewhere between Mannahatta and Manhattan is the story of every place on Earth.’ In some ways, that is the case.”