


![How to Use AI as a Productivity Tool with Mike Kaput [MAICON 2025 Speaker Series]](https://www.marketingaiinstitute.com/hubfs/v2MAICON-Speaker_Series.png)
![[The AI Show Episode 152]: ChatGPT Connectors, AI-Human Relationships, New AI Job Data, OpenAI Court-Ordered to Keep ChatGPT Logs & WPP’s Large Marketing Model](https://www.marketingaiinstitute.com/hubfs/ep%20152%20cover.png)


![Designing a Robust Modular Hardware-Oriented Application in C++ [closed]](https://i.sstatic.net/f2sQd76t.webp)


_Alexander-Yakimov_Alamy.jpg?width=1280&auto=webp&quality=80&disable=upscale#)
_Zoonar_GmbH_Alamy.jpg?width=1280&auto=webp&quality=80&disable=upscale#)


![AirPods Pro 3 Not Launching Until 2026 [Pu]](https://www.iclarified.com/images/news/97620/97620/97620-640.jpg)
![Apple Releases First Beta of iOS 18.6 and iPadOS 18.6 to Developers [Download]](https://www.iclarified.com/images/news/97626/97626/97626-640.jpg)
![Apple Seeds watchOS 11.6 Beta to Developers [Download]](https://www.iclarified.com/images/news/97627/97627/97627-640.jpg)
![Apple Seeds tvOS 18.6 Beta to Developers [Download]](https://www.iclarified.com/images/news/97628/97628/97628-640.jpg)


![T-Mobile customers' address, number, and other info allegedly up for sale; company denies claim [UPDATED]](https://m-cdn.phonearena.com/images/article/171306-two/T-Mobile-customers-address-number-and-other-info-allegedly-up-for-sale-company-denies-claim-UPDATED.jpg?#)


Rider 2025.2 EAP 5: Reimagined Monitoring tool window and New OpenTelemetry Plugin
The Rider 2025.2 EAP 5 build has just been released, and this one brings two major productivity enhancements for .NET developers. We’re excited to introduce the reimagined Monitoring tool window, which transforms how you identify and resolve performance issues, plus the new OpenTelemetry plugin, which brings runtime observability directly into your development environment. We can’t […]

The Rider 2025.2 EAP 5 build has just been released, and this one brings two major productivity enhancements for .NET developers.
We’re excited to introduce the reimagined Monitoring tool window, which transforms how you identify and resolve performance issues, plus the new OpenTelemetry plugin, which brings runtime observability directly into your development environment.
We can’t wait for you to download Rider 2025.2 EAP 5 and try it out, but before you do, let us tell you more about what you can expect to find inside.
Reimagined Monitoring tool window
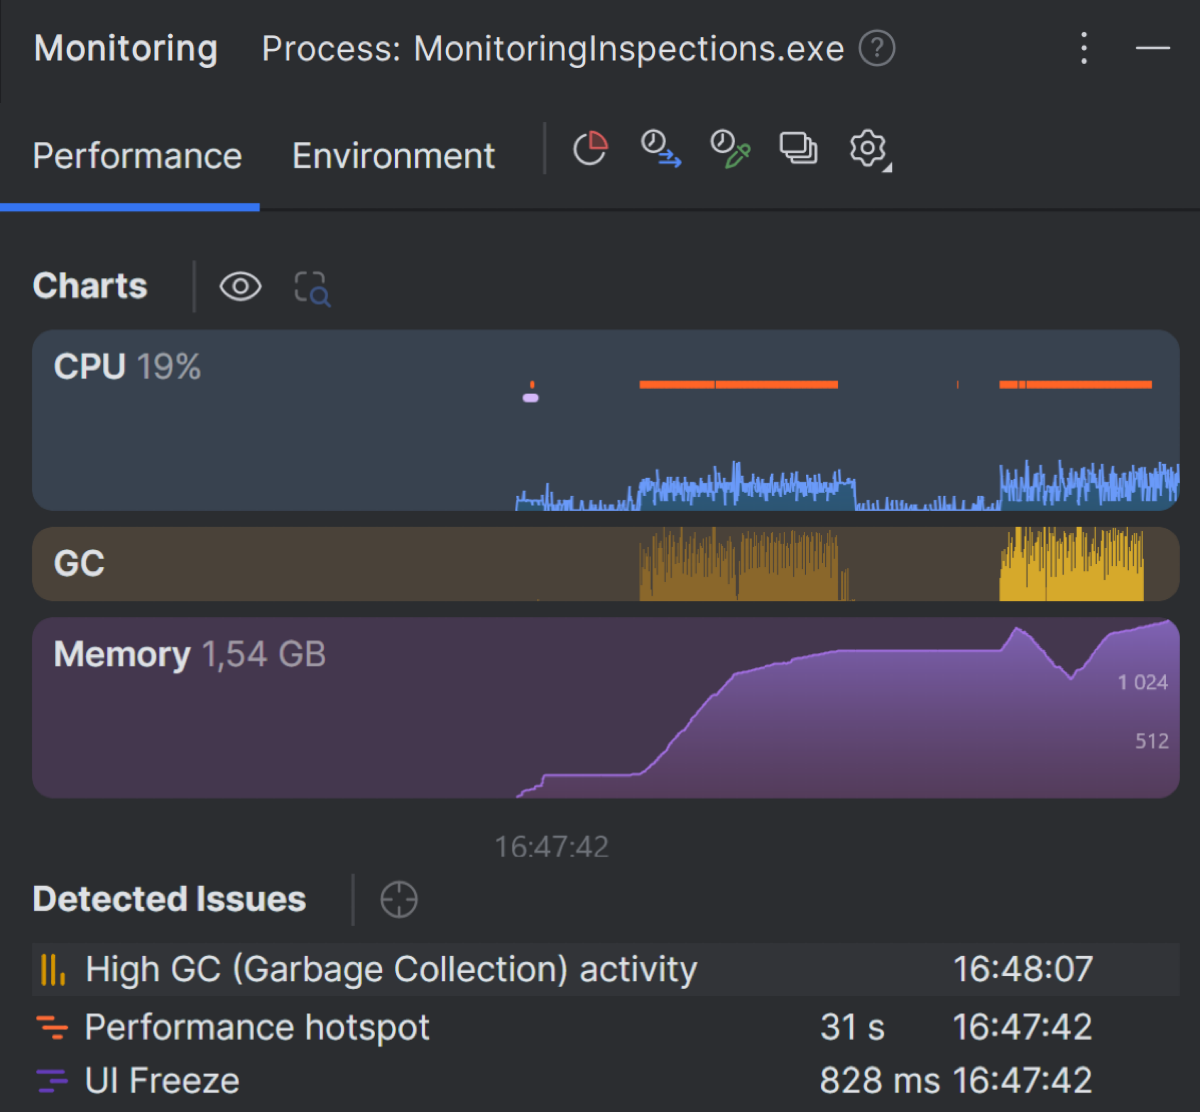
The Monitoring tool window was first introduced with the release of Rider 2024.1 over a year ago. Since then, we’ve been working to enhance its capabilities. Now, it features three interactive charts and deeper integration with our bundled profiling tools dotTrace and dotMemory (both included with the dotUltimate subscription).
Just as before, the tool window launches automatically when you start running or debugging your application. The key difference with this upgrade is that it automatically detects performance issues during runtime and serves as an entry point for further exploration should you want to dive deeper into the issue.

Real-time performance monitoring
The Monitoring tool now offers rich, interactive visualizations for key runtime metrics in the form of three stacked charts:
- CPU usage shows the application’s load and thread activity.
- Garbage collection (GC) helps identify memory pressure points with detailed activity overlays.
- Memory shows total memory usage.
You can scroll, zoom, and select custom intervals in the chart to focus on performance windows of interest, making it easy to correlate performance issues with specific timeframes in your application’s lifecycle.
Automatic inspections
New intelligent detectors now automatically identify and report critical performance issues:
- UI Freeze detection catches UI thread hangs, providing exact timestamps and duration information to help you understand the scope of responsiveness problems.
- Performance Hotspot highlights methods consuming the most execution time using dotTrace’s proven algorithms.
- High GC flags spikes in garbage collection frequency and severity that could impact application performance.
Each inspection entry provides one-click navigation directly to the offending code, streamlining your debugging workflow and reducing the time between detection and resolution.
Deep profiling without restart
Thanks to tighter integration with dotTrace and dotMemory, you can now open profiler views for any issue or chart interval without rerunning your application under the profiler. This integration makes diagnosing runtime issues significantly faster and more efficient, eliminating the traditional cycle of stopping your application, configuring profiling, and restarting to gather the data you need.
Limitations
At this stage, the availability of various inspections varies by platform:
Windows environments enjoy full support with UI Freeze, Performance Hotspots, and High GC inspections available for .NET, .NET Framework, and MAUI applications. Please note that MAUI inspection support is exclusive to Windows x64.
macOS and Linux platforms currently offer partial support, with GC pressure inspections available for .NET applications. The Analyze issue feature is not supported on these platforms: you can’t open detailed information in dotTrace for a selected inspection or a specific time range on the chart.
Windows ARM64 is partially supported. On native (non-virtualized) ARM64 machines, all inspections and detailed information in dotTrace are available for ARM64 processes only. x64 and x86 applications running on ARM64 are not supported. When running Windows ARM64 via Parallels on macOS:
- The Performance Hotspot inspection is not available.
- Opening detailed information in dotTrace is not supported.
OpenTelemetry plugin for observability inside the IDE
Rider 2025.2 EAP 5 also introduces the OpenTelemetry plugin for Rider, bringing runtime observability directly into your development environment. This plugin is designed for observability during local development and testing, allowing you to correlate runtime behavior (logs, metrics, and traces) with code inside Rider.

The plugin features comprehensive log management with direct code navigation, runtime metrics visualization, automatic architecture diagrams generated from execution traces, and zero-setup auto-instrumentation.
Check out this dedicated blog post to get all the details.
Feedback
These EAP features represent significant steps forward in making performance analysis and runtime observability more accessible for .NET developers. At this stage, it’s extremely important for us to hear your feedback, including success stories, situations where the tools didn’t perform as expected, and suggestions for additional scenarios where these capabilities could assist you.
Please send us your ideas and suggestions through our usual feedback channels: here in the comments section, over on our issue tracker, or on our social media – X (formerly Twitter) and Bluesky.


