


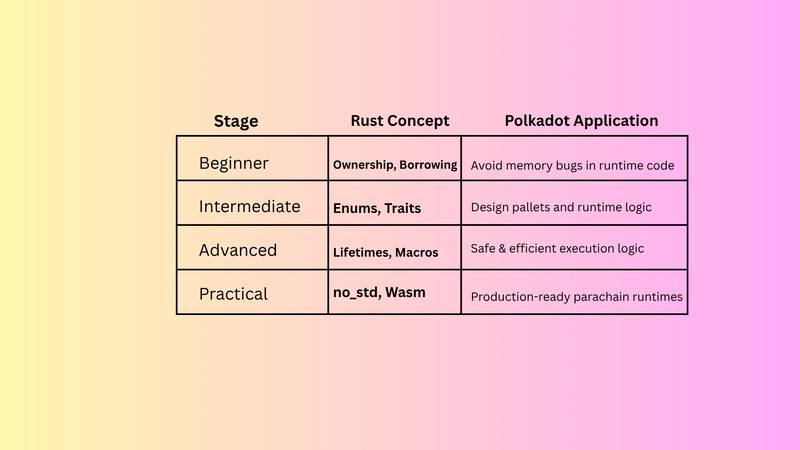
![How to Use AI as a Productivity Tool with Mike Kaput [MAICON 2025 Speaker Series]](https://www.marketingaiinstitute.com/hubfs/v2MAICON-Speaker_Series.png)
![[The AI Show Episode 152]: ChatGPT Connectors, AI-Human Relationships, New AI Job Data, OpenAI Court-Ordered to Keep ChatGPT Logs & WPP’s Large Marketing Model](https://www.marketingaiinstitute.com/hubfs/ep%20152%20cover.png)


![Designing a Robust Modular Hardware-Oriented Application in C++ [closed]](https://i.sstatic.net/f2sQd76t.webp)


_Alexander-Yakimov_Alamy.jpg?width=1280&auto=webp&quality=80&disable=upscale#)
_Zoonar_GmbH_Alamy.jpg?width=1280&auto=webp&quality=80&disable=upscale#)


![AirPods Pro 3 Not Launching Until 2026 [Pu]](https://www.iclarified.com/images/news/97620/97620/97620-640.jpg)
![Apple Releases First Beta of iOS 18.6 and iPadOS 18.6 to Developers [Download]](https://www.iclarified.com/images/news/97626/97626/97626-640.jpg)
![Apple Seeds watchOS 11.6 Beta to Developers [Download]](https://www.iclarified.com/images/news/97627/97627/97627-640.jpg)
![Apple Seeds tvOS 18.6 Beta to Developers [Download]](https://www.iclarified.com/images/news/97628/97628/97628-640.jpg)


Building a JavaScript Code Analyzer for Static Analysis
Building a JavaScript Code Analyzer for Static Analysis Introduction Static analysis of code has become an essential practice in software development, especially in JavaScript applications, where dynamics and mutation are high. A Code Analyzer serves as a foundational tool that allows developers to assess the general quality, security, and maintainability of their JavaScript code without executing it. This article delves deeply into building a JavaScript code analyzer by outlining principles, historical context, technical specifics, code examples, and optimization techniques. Historical Context JavaScript's evolution has been pronounced. From its conception in 1995 by Brendan Eich and its tumultuous journey through the early 2000s to the modern era of ECMAScript (ES6 and beyond), JavaScript has garnered a mixed reputation concerning code quality. As the complexities of web applications expanded, so did the demand for tools to ensure clean, maintainable, and safe code. Tools such as ESLint (released in 2013), JSHint, and SonarQube emerged to meet these needs, but there remain opportunities for innovation within static analysis targeting nuanced metrics. Modern JavaScript and Its Complexity With constructs like Promises, Async/Await, destructuring assignment, dynamic imports, and TypeScript integration, static analysis of JavaScript is no trivial task. A robust analyzer must accurately reflect the logical flow of the application, detect potential bugs, warn about anti-patterns, and support various versions of JavaScript, including JSX for React applications. Building a Code Analyzer: Technical Overview Step 1: Setting the Goals Before starting to code, it's crucial to define what your code analyzer needs to achieve. This could include: Linting: Identify syntactical errors, unused variables, and enforce coding standards. Identifying Vulnerabilities: Detect potential security flaws in the code. Code Metrics: Provide insights on complexity, maintainability, and readability. Step 2: Choosing the Right Tools Abstract Syntax Tree (AST): Utilize tools like Babel or Acorn to parse JavaScript code into an AST for easy manipulation and analysis. Linting Libraries: Use established libraries like ESLint as a foundation. They support plugins, extendability, and a comprehensible API for custom rule creation. Step 3: Parsing JavaScript Code Let's create a simple parser using Babel: const fs = require('fs'); const parser = require('@babel/parser'); function parseCode(filePath) { const code = fs.readFileSync(filePath, 'utf-8'); const ast = parser.parse(code, { sourceType: 'module', plugins: ['jsx', 'classProperties'] }); return ast; } const ast = parseCode('path/to/sample.js'); console.log(JSON.stringify(ast, null, 2)); Step 4: Analyzing the AST Once the AST is generated, the next step is to traverse it. Babel's @babel/traverse can be utilized for walking through the AST to apply various checks. const traverse = require('@babel/traverse').default; function analyzeAst(ast) { traverse(ast, { VariableDeclarator(path) { if (path.node.id.name === 'unusedVar') { console.warn(`Warning: "${path.node.id.name}" is declared but never used.`); } }, // Add more visitor functions for different analysis needs }); } analyzeAst(ast); Code Analyzer Example: Linting Unused Variables Here, we'll extend our analyzer to identify both declared but unused variables as well as constants that might overshadow variables: function analyzeAst(ast) { const variables = new Set(); traverse(ast, { VariableDeclarator(path) { variables.add(path.node.id.name); }, Identifier(path) { if (variables.has(path.node.name) && path.parent.type !== 'VariableDeclarator') { variables.delete(path.node.name); } }, }); variables.forEach(variable => { console.warn(`Warning: "${variable}" is declared but never used.`); }); } Advanced Implementation Techniques Custom Rules: Use ESLint's RuleTester to create and test your custom linting rules to enrich the analyzer's functionality. Performance Considerations: Memoization: Cache results to avoid repetitive analysis of the same code base, especially for larger files. Debouncing: In real-time analysis scenarios (like IDE integration), utilize debouncing to reduce the number of analyses triggered by user input. Parallel Processing: For larger projects, splitting files into chunks and analyzing them in parallel can significantly speed up the process. Edge Cases Consider analyzing a mix of ES5 and ES6 constructs in the same project. Utilize Babel’s plugin management to selectively parse files based on their type to avoid encountering un

Building a JavaScript Code Analyzer for Static Analysis
Introduction
Static analysis of code has become an essential practice in software development, especially in JavaScript applications, where dynamics and mutation are high. A Code Analyzer serves as a foundational tool that allows developers to assess the general quality, security, and maintainability of their JavaScript code without executing it. This article delves deeply into building a JavaScript code analyzer by outlining principles, historical context, technical specifics, code examples, and optimization techniques.
Historical Context
JavaScript's evolution has been pronounced. From its conception in 1995 by Brendan Eich and its tumultuous journey through the early 2000s to the modern era of ECMAScript (ES6 and beyond), JavaScript has garnered a mixed reputation concerning code quality. As the complexities of web applications expanded, so did the demand for tools to ensure clean, maintainable, and safe code. Tools such as ESLint (released in 2013), JSHint, and SonarQube emerged to meet these needs, but there remain opportunities for innovation within static analysis targeting nuanced metrics.
Modern JavaScript and Its Complexity
With constructs like Promises, Async/Await, destructuring assignment, dynamic imports, and TypeScript integration, static analysis of JavaScript is no trivial task. A robust analyzer must accurately reflect the logical flow of the application, detect potential bugs, warn about anti-patterns, and support various versions of JavaScript, including JSX for React applications.
Building a Code Analyzer: Technical Overview
Step 1: Setting the Goals
Before starting to code, it's crucial to define what your code analyzer needs to achieve. This could include:
- Linting: Identify syntactical errors, unused variables, and enforce coding standards.
- Identifying Vulnerabilities: Detect potential security flaws in the code.
- Code Metrics: Provide insights on complexity, maintainability, and readability.
Step 2: Choosing the Right Tools
Abstract Syntax Tree (AST): Utilize tools like Babel or Acorn to parse JavaScript code into an AST for easy manipulation and analysis.
Linting Libraries: Use established libraries like ESLint as a foundation. They support plugins, extendability, and a comprehensible API for custom rule creation.
Step 3: Parsing JavaScript Code
Let's create a simple parser using Babel:
const fs = require('fs');
const parser = require('@babel/parser');

function parseCode(filePath) {
    const code = fs.readFileSync(filePath, 'utf-8');
    const ast = parser.parse(code, {
        sourceType: 'module',
        plugins: ['jsx', 'classProperties']
    });
    return ast;
}

const ast = parseCode('path/to/sample.js');
console.log(JSON.stringify(ast, null, 2));
Step 4: Analyzing the AST
Once the AST is generated, the next step is to traverse it. Babel's @babel/traverse can be utilized for walking through the AST to apply various checks.
const traverse = require('@babel/traverse').default;

function analyzeAst(ast) {
    traverse(ast, {
        VariableDeclarator(path) {
            if (path.node.id.name === 'unusedVar') {
                console.warn(`Warning: "${path.node.id.name}" is declared but never used.`);
            }
        },
        // Add more visitor functions for different analysis needs
    });
}

analyzeAst(ast);
Code Analyzer Example: Linting Unused Variables
Here, we'll extend our analyzer to identify both declared but unused variables as well as constants that might overshadow variables:
function analyzeAst(ast) {
    const variables = new Set();

    traverse(ast, {
        VariableDeclarator(path) {
            variables.add(path.node.id.name);
        },
        Identifier(path) {
            if (variables.has(path.node.name) && path.parent.type !== 'VariableDeclarator') {
                variables.delete(path.node.name);
            }
        },
    });

    variables.forEach(variable => {
        console.warn(`Warning: "${variable}" is declared but never used.`);
    });
}
Advanced Implementation Techniques
Custom Rules: Use ESLint's
RuleTesterto create and test your custom linting rules to enrich the analyzer's functionality.-
Performance Considerations:
- Memoization: Cache results to avoid repetitive analysis of the same code base, especially for larger files.
- Debouncing: In real-time analysis scenarios (like IDE integration), utilize debouncing to reduce the number of analyses triggered by user input.
Parallel Processing: For larger projects, splitting files into chunks and analyzing them in parallel can significantly speed up the process.
Edge Cases
Consider analyzing a mix of ES5 and ES6 constructs in the same project. Utilize Babel’s plugin management to selectively parse files based on their type to avoid encountering unnecessary syntax errors.
Comparing with Alternatives
ESLint: Offers a comprehensive suite for static analysis with a brigade of plugins. Extremely customizable but might be a bit heavy for straightforward custom needs.
JSHint: Lighter than ESLint and straightforward but lacks the richness of plugin architecture and ES module support.
SonarQube: Continuous inspection tool that provides code quality checks. While powerful for enterprise-level requirements, it can be overkill for smaller projects or specific use cases.
Real-World Use Cases
Software Development Firms
Companies like Airbnb rely on ESLint to maintain coding standards across sprawling codebases, ensuring developers adhere to best practices while continuously integrating new features.
Security Analysis
Organizations like Google leverage advanced static analysis tools to identify security vulnerabilities early in the development cycle, saving time and reducing patching expenses post-deployment.
Pitfalls and Debugging Techniques
False Positives: It's common to encounter situations where legitimate code constructs are flagged as errors. Carefully tune your analysis rules, consulting with the development team to establish acceptable conventions.
Integration with Build Systems: Ensure the analyzer correctly integrates with tools like Webpack or Gulp—the pipeline should accommodate analysis without significantly degrading performance.
Advanced Debugging: Utilize
console.logjudiciously while analyzing deeper constructs. Tools like Node.js's--inspectcan help debug analyzer runtime issues effectively.
Conclusion
Building a JavaScript code analyzer for static analysis is a complex yet rewarding endeavor that can vastly improve the quality and maintainability of applications. By leveraging modern tools such as Babel, and understanding the intricacies of AST manipulation, developers can foster a culture of quality while benefiting from advanced performance mechanisms and analytics. This detailed exploration prepares you to not only develop an analyzer but also understand its implementation within a larger context of software development practices.
Additional Resources
- Babel Documentation
- ESLint Documentation
- The AST Explorer for learning about ASTs interactively.
By following the principles laid out here, developers can construct a comprehensive JavaScript code analyzer that meets evolving industry standards and fosters a culture of excellence within their teams. The journey will demand statistical rigor, creativity, and diligence; nevertheless, the payoff will be productivity and code quality enhancement across the board.


