Effective Troubleshooting - A Comprehensive Guide
Troubleshooting Guide for Developers Overview: A Systematic Approach to Problem Solving Troubleshooting is the systematic process of identifying, analyzing, and resolving issues in systems, applications, networks, and infrastructure. Rather than merely addressing symptoms, it involves diagnosing root causes and implementing measures to prevent recurrence. For developers and system operators, troubleshooting is an essential skill. This guide covers fundamental principles, real-world examples, and effective tool usage strategies. Basic Troubleshooting Flow The troubleshooting process typically follows these steps (most issues become simpler once you can reproduce them): 1. Problem Identification Recognize that a problem exists and clearly identify the symptoms. Examples: "The server is down," "API returns 500 errors," "Database performance has degraded" 2. Problem Reproduction Attempt to reproduce the issue in a controlled environment to establish consistent conditions for analysis. 3. Root Cause Analysis Analyze logs, metrics, code, and other relevant data points to identify the underlying cause. 4. Hypothesis Formation & Verification Develop hypotheses about potential causes and test them systematically. 5. Solution Implementation Apply the fix by modifying code, changing configuration, or performing necessary system adjustments. 6. Documentation & Retrospective Document the resolution process and establish preventive measures for similar issues. Essential Troubleshooting Tools Several tools can significantly enhance your troubleshooting efficiency: tail -f - Real-time log monitoring grep - Pattern searching in logs top, htop - System resource monitoring netstat - Network connection status docker logs - Container log inspection APM (Application Performance Monitoring) - App performance insights strace/dtrace - System call tracing jstack - Java thread dump analysis Real-world Troubleshooting Examples Let's examine common troubleshooting scenarios and their solutions from professional environments. Case 1: Web Server Issues (504 Gateway Timeout) Symptom: Client API calls resulting in 504 Gateway Timeout errors Process: Log analysis across the stack (nginx → backend) # Nginx log inspection grep "504" /var/log/nginx/error.log | tail -n 100 # Backend log inspection grep "Timeout" /var/log/application/app.log Database connection delay logs discovered WARN [HikariPool-1] - Connection is not available, request timed out after 30001ms ERROR [TransactionManager] - Transaction could not be completed, database connection error Database connection pool shortage confirmed -- Active connection query SELECT count(*) FROM information_schema.processlist WHERE command != 'Sleep' AND user = 'app_user'; Connection pool settings increased & query optimization implemented # application.yml changes datasource: hikari: maximum-pool-size: 20 # Increased from 10 connection-timeout: 30000 idle-timeout: 600000 // Query optimization for N+1 problem // Before List orders = orderRepository.findAll(); for (Order order : orders) { order.getItems().size(); // Separate query for each order (N+1) } // After List orders = orderRepository.findAllWithItems(); // Using JOIN FETCH Case 2: Post-deployment 500 Errors Symptom: 500 errors occurring on specific APIs after new deployment Process: Code diff analysis between versions git diff HEAD~1 HEAD -- src/main/java/com/example/service/UserService.java NPE (Null Pointer Exception) identified in stack trace java.lang.NullPointerException at com.example.service.UserService.processUserPreferences(UserService.java:125) at com.example.controller.UserController.updatePreferences(UserController.java:57) Missing parameter handling causing NPE // Problematic code void processUserPreferences(UserPreferences preferences) { String theme = preferences.getTheme().toLowerCase(); // NPE when getTheme() is null // ... } Default value handling added and redeployed // Fixed code void processUserPreferences(UserPreferences preferences) { String theme = (preferences.getTheme() != null) ? preferences.getTheme().toLowerCase() : DEFAULT_THEME; // ... } Case 3: Memory Leaks Causing Periodic Server Crashes Symptom: Java application experiencing OOM (Out of Memory) errors every ~5 days Process: Heap dump analysis jmap -dump:format=b,file=heap_dump.bin $(pgrep java) Memory pattern analysis with Eclipse MAT Identified continuously growing cache objects Discovered unbounded cache implementation // Problematic code static final Map dataCache = new HashMap(); void pr

Troubleshooting Guide for Developers
Overview: A Systematic Approach to Problem Solving
Troubleshooting is the systematic process of identifying, analyzing, and resolving issues in systems, applications, networks, and infrastructure. Rather than merely addressing symptoms, it involves diagnosing root causes and implementing measures to prevent recurrence.
For developers and system operators, troubleshooting is an essential skill. This guide covers fundamental principles, real-world examples, and effective tool usage strategies.
Basic Troubleshooting Flow
The troubleshooting process typically follows these steps (most issues become simpler once you can reproduce them):
1. Problem Identification
Recognize that a problem exists and clearly identify the symptoms.
Examples: "The server is down," "API returns 500 errors," "Database performance has degraded"
2. Problem Reproduction
Attempt to reproduce the issue in a controlled environment to establish consistent conditions for analysis.
3. Root Cause Analysis
Analyze logs, metrics, code, and other relevant data points to identify the underlying cause.
4. Hypothesis Formation & Verification
Develop hypotheses about potential causes and test them systematically.
5. Solution Implementation
Apply the fix by modifying code, changing configuration, or performing necessary system adjustments.
6. Documentation & Retrospective
Document the resolution process and establish preventive measures for similar issues.
Essential Troubleshooting Tools
Several tools can significantly enhance your troubleshooting efficiency:
-
tail -f- Real-time log monitoring -
grep- Pattern searching in logs -
top,htop- System resource monitoring -
netstat- Network connection status -
docker logs- Container log inspection - APM (Application Performance Monitoring) - App performance insights
-
strace/dtrace- System call tracing -
jstack- Java thread dump analysis
Real-world Troubleshooting Examples
Let's examine common troubleshooting scenarios and their solutions from professional environments.
Case 1: Web Server Issues (504 Gateway Timeout)
Symptom: Client API calls resulting in 504 Gateway Timeout errors
Process:
- Log analysis across the stack (nginx → backend)
   # Nginx log inspection
   grep "504" /var/log/nginx/error.log | tail -n 100

   # Backend log inspection
   grep "Timeout" /var/log/application/app.log
- Database connection delay logs discovered
   WARN  [HikariPool-1] - Connection is not available, request timed out after 30001ms
   ERROR [TransactionManager] - Transaction could not be completed, database connection error
- Database connection pool shortage confirmed
   -- Active connection query
   SELECT count(*) FROM information_schema.processlist
   WHERE command != 'Sleep' AND user = 'app_user';
- Connection pool settings increased & query optimization implemented
   # application.yml changes
   datasource:
     hikari:
       maximum-pool-size: 20 # Increased from 10
       connection-timeout: 30000
       idle-timeout: 600000
   // Query optimization for N+1 problem
   // Before
   List<Order> orders = orderRepository.findAll();
   for (Order order : orders) {
     order.getItems().size();  // Separate query for each order (N+1)
   }

   // After
   List<Order> orders = orderRepository.findAllWithItems();  // Using JOIN FETCH
Case 2: Post-deployment 500 Errors
Symptom: 500 errors occurring on specific APIs after new deployment
Process:
- Code diff analysis between versions
git diff HEAD~1 HEAD -- src/main/java/com/example/service/UserService.java
- NPE (Null Pointer Exception) identified in stack trace
   java.lang.NullPointerException
     at com.example.service.UserService.processUserPreferences(UserService.java:125)
     at com.example.controller.UserController.updatePreferences(UserController.java:57)
- Missing parameter handling causing NPE
   // Problematic code
   void processUserPreferences(UserPreferences preferences) {
     String theme = preferences.getTheme().toLowerCase();  // NPE when getTheme() is null
     // ...
   }
- Default value handling added and redeployed
   // Fixed code
   void processUserPreferences(UserPreferences preferences) {
     String theme = (preferences.getTheme() != null)
       ? preferences.getTheme().toLowerCase()
       : DEFAULT_THEME;
     // ...
   }
Case 3: Memory Leaks Causing Periodic Server Crashes
Symptom: Java application experiencing OOM (Out of Memory) errors every ~5 days
Process:
- Heap dump analysis
jmap -dump:format=b,file=heap_dump.bin $(pgrep java)
- Memory pattern analysis with Eclipse MAT
- Identified continuously growing cache objects
- Discovered unbounded cache implementation
   // Problematic code
   static final Map<String, DataObject> dataCache = new HashMap<>();

   void processData(String key, DataObject data) {
     dataCache.put(key, data);  // Unlimited cache growth
     // ...
   }
- Solution: LRU cache with expiration policy
   // Improved code
   LoadingCache<String, DataObject> dataCache = CacheBuilder.newBuilder()
       .maximumSize(10000)  // Size limit
       .expireAfterWrite(12, TimeUnit.HOURS)  // Time-based expiration
       .build(new CacheLoader<String, DataObject>() {
           @Override
           public DataObject load(String key) {
               return fetchDataFromDb(key);
           }
       });
Advanced Troubleshooting Techniques for Developers
1. Narrowing Down Problem Scope
Track issues to the point just before failure to pinpoint the exact cause of errors.
2. Understanding Environment Differences
Recognize differences between development, test, and production environments. Remote debugging can be valuable for non-local environments.
3. Implementing Effective Logging Strategy
Logs are critical troubleshooting tools. Develop a logging strategy that captures necessary information while avoiding excessive output.
4. Performance Profiling
Combine system-level analysis with code profiling to address performance issues:
// Performance profiling example
long start = System.nanoTime();
result = expensiveOperation();
long end = System.nanoTime();
log.info("Operation took {} ms", (end - start) / 1_000_000);

// Detailed bottleneck identification
Map<String, Long> timings = new HashMap<>();
timings.put("db_query", measureDbQueryTime());
timings.put("external_api", measureExternalApiTime());
timings.put("processing", measureProcessingTime());
log.info("Performance breakdown: {}", timings);
Effective Postmortem Documentation
After resolving issues, create effective postmortem documentation to prevent recurrences and share knowledge:
# Incident Postmortem: API Server 504 Timeout (2023-05-15)

## Issue Summary

- **Time**: 2023-05-15 14:20 ~ 16:45 UTC
- **Impact**: 30% payment API request failures, affecting ~500 users
- **Symptom**: HTTP 504 Gateway Timeout during payment processing
- **Root Cause**: Database connection pool exhaustion

## Timeline

- **14:20** - Alert: API response time increase
- **14:25** - Initial investigation, log analysis
- **14:40** - Root cause identified: DB connection shortage
- **15:00** - Interim fix: Connection pool expansion
- **16:45** - Permanent fix: Query optimization and connection management improvements

## Root Cause

Specific API failing to properly return DB connections, causing connection pool depletion
`code: UserService.java:120 - connection.close() missing`

## Resolution

1. **Short-term**: Increased connection pool size (50 → 100)
2. **Medium-term**: Implemented try-with-resources pattern for automatic resource release
3. **Long-term**: Added connection leak detection monitoring

## Prevention Measures

- Completed review of all DB connection management code
- Added connection pool monitoring alerts (80% usage threshold)
- Documented DB transaction management guidelines for the team
Conclusion
Troubleshooting is more than just fixing errors—it's about strengthening system resilience. By resolving issues, documenting solutions, and sharing knowledge, you establish preventive measures that continuously improve system stability and reliability.


















![[The AI Show Episode 150]: AI Answers: AI Roadmaps, Which Tools to Use, Making the Case for AI, Training, and Building GPTs](https://www.marketingaiinstitute.com/hubfs/ep%20150%20cover.png)
![[The AI Show Episode 149]: Google I/O, Claude 4, White Collar Jobs Automated in 5 Years, Jony Ive Joins OpenAI, and AI’s Impact on the Environment](https://www.marketingaiinstitute.com/hubfs/ep%20149%20cover.png)


































![[DEALS] Mail Backup X Individual Edition: Lifetime Subscription (72% off) & Other Deals Up To 98% Off – Offers End Soon!](https://www.javacodegeeks.com/wp-content/uploads/2012/12/jcg-logo.jpg)















_Luis_Moreira_Alamy.jpg?width=1280&auto=webp&quality=80&disable=upscale#)


_imageBROKER.com_via_Alamy.jpg?width=1280&auto=webp&quality=80&disable=upscale#)









![iOS 19 may support easily transferring your iPhone’s eSIM to an Android device [U]](https://i0.wp.com/9to5mac.com/wp-content/uploads/sites/6/2022/09/iphone-14-eSIM-event.jpg?resize=1200%2C628&quality=82&strip=all&ssl=1)


![iPhone 16 Becomes World's Best-Selling Smartphone in Q1 2025 [Chart]](https://www.iclarified.com/images/news/97448/97448/97448-640.jpg)
![Apple Releases Xcode 16.4 With Support for Swift 6.1 and New SDKs [Download]](https://www.iclarified.com/images/news/97450/97450/97450-640.jpg)

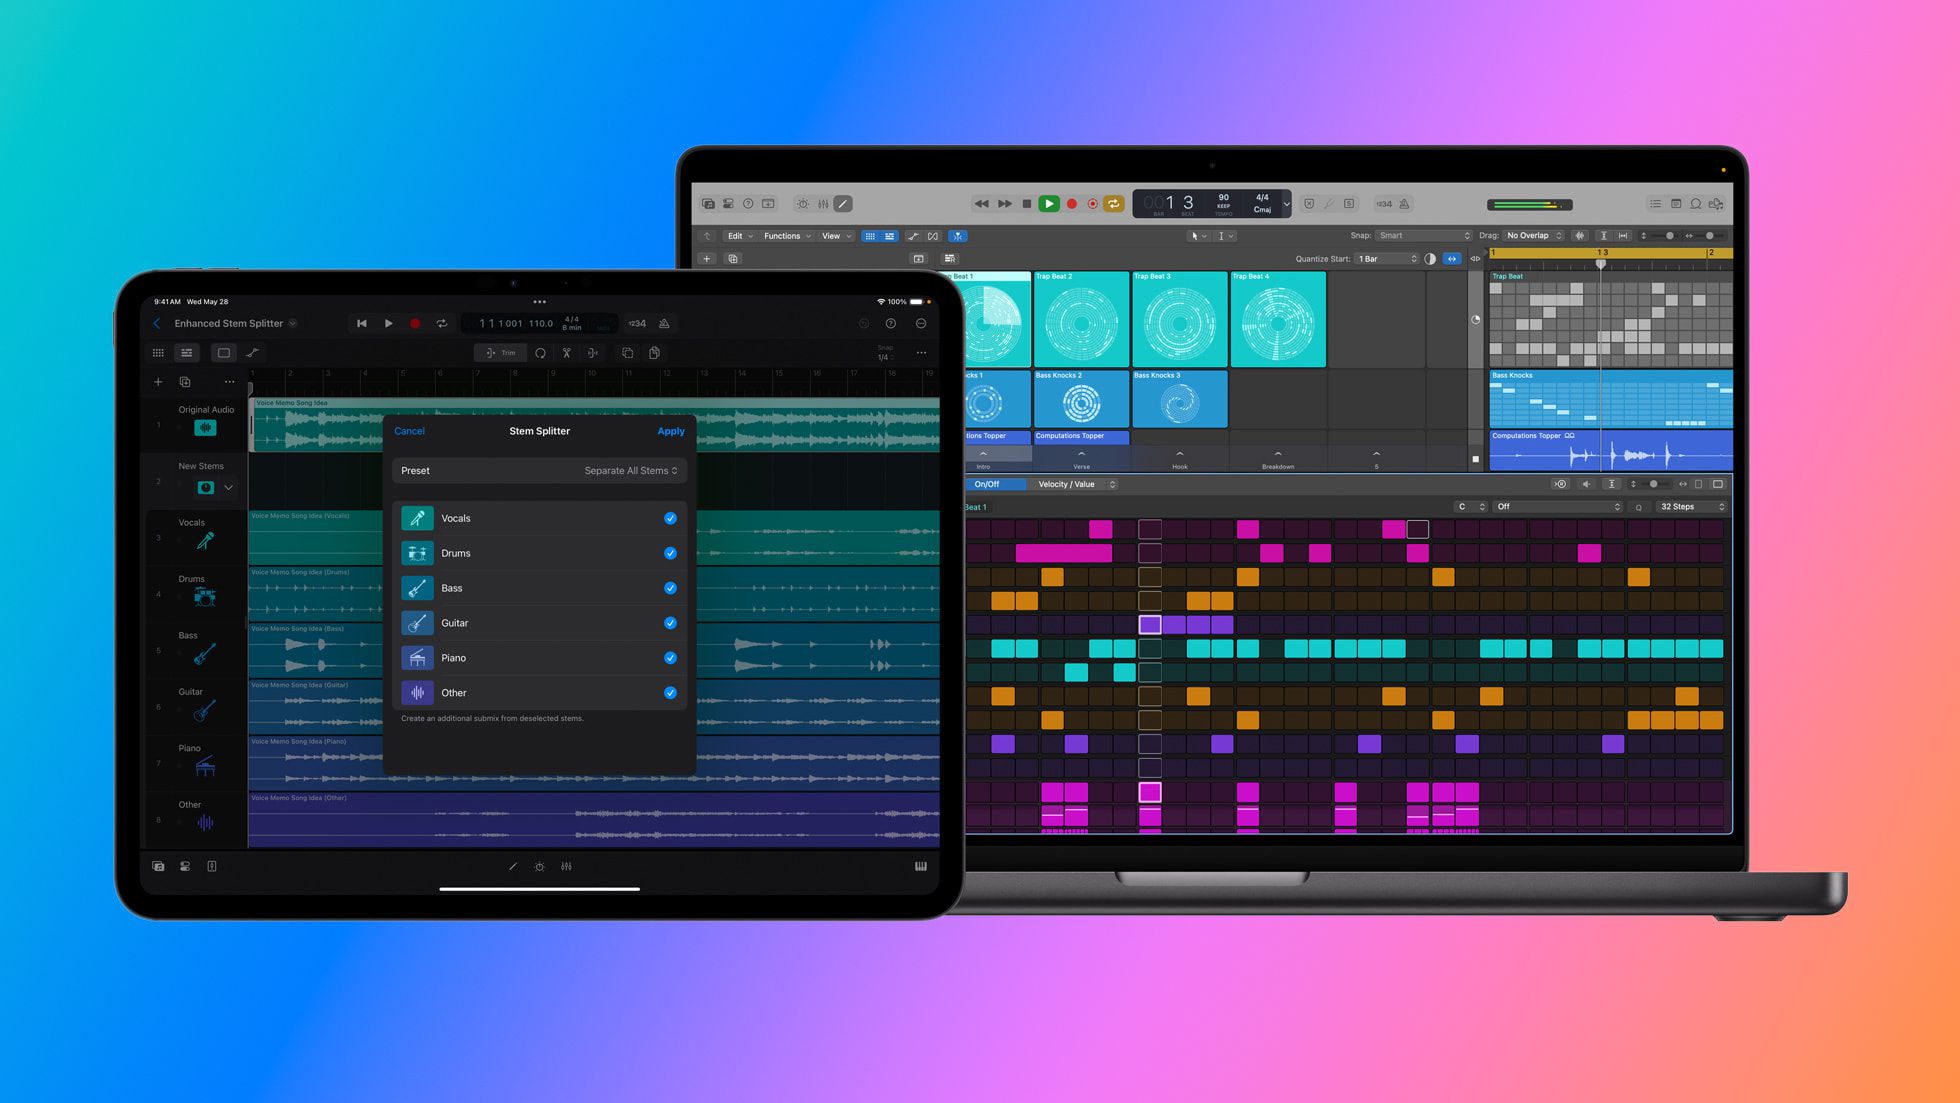
![Apple Updates Logic Pro With Flashback Capture, Enhanced Stem Splitter, More [Download]](https://www.iclarified.com/images/news/97446/97446/97446-640.jpg)


