


![[The AI Show Episode 146]: Rise of “AI-First” Companies, AI Job Disruption, GPT-4o Update Gets Rolled Back, How Big Consulting Firms Use AI, and Meta AI App](https://www.marketingaiinstitute.com/hubfs/ep%20146%20cover.png)


![Ditching a Microsoft Job to Enter Startup Hell with Lonewolf Engineer Sam Crombie [Podcast #171]](https://cdn.hashnode.com/res/hashnode/image/upload/v1746753508177/0cd57f66-fdb0-4972-b285-1443a7db39fc.png?#)


.jpg?width=1920&height=1920&fit=bounds&quality=70&format=jpg&auto=webp#)


-Nintendo-Switch-2-Hands-On-Preview-Mario-Kart-World-Impressions-&-More!-00-10-30.png?width=1920&height=1920&fit=bounds&quality=70&format=jpg&auto=webp#)


-xl.jpg)


![New iPad 11 (A16) On Sale for Just $277.78! [Lowest Price Ever]](https://www.iclarified.com/images/news/97273/97273/97273-640.jpg)

![Apple Foldable iPhone to Feature New Display Tech, 19% Thinner Panel [Rumor]](https://www.iclarified.com/images/news/97271/97271/97271-640.jpg)


![[Weekly funding roundup May 3-9] VC inflow into Indian startups touches new high](https://images.yourstory.com/cs/2/220356402d6d11e9aa979329348d4c3e/WeeklyFundingRoundupNewLogo1-1739546168054.jpg)


How Not to Write an MCP Server
Five hard lessons learned from my first attempt at leveraging the new MCP technology, a short developer’s diary The post How Not to Write an MCP Server appeared first on Towards Data Science.

I
While an initial POCs demonstrated that there was an immense potential for this to be a force multiplier to our product’s value, it took several iterations and several stumbles to deliver on that promise. In this post, I’ll try to capture some of the lessons learned, as I think that this can benefit other MCP server developers.
My Stack
- I was using Cursor and vscode intermittently as the main MCP client
- To develop the MCP server itself, I used the .NET MCP SDK, as I decided to host the server on another service written in .NET
Lesson 1: Don’t dump all of your data on the agent
In my application, one tool returns aggregated information on errors and exceptions. The API is very detailed as it serves a complex UI view, and spews out large amounts of deeply linked data:
- Error frames
- Affected endpoints
- Stack traces
- Priority and trends
- Histograms
My first hunch was to simply expose the API as is as an MCP tool. After all, the agent should be able to make more sense of it than any UI view, and catch on to interesting details or connections between events. There were several scenarios I had in mind as to how I would expect this data to be useful. The agent could automatically offer fixes for recent exceptions recorded in production or in the testing environment, let me know about errors that stand out, or help me address some systematic problems that are the underlying root cause of the issues.
The basic premise was therefore to allow the agent to work its ‘magic’, with more data potentially meaning more hooks for the agent to latch on in its investigation efforts. I quickly coded a wrapper around our API on the MCP endpoint and decided to start with a basic prompt to see whether everything is working:

We can see the agent was smart enough to know that it needed to call another tool to grab the environment ID for that ‘test’ environment I mentioned. With that at hand, after discovering that there was actually no recent exception in the last 24 hours, it then took the liberty to scan a more extended time period, and this is when things got a little weird:

What a strange response. The agent queries for exceptions from the last seven days, gets back some tangible results this time, and yet proceeds to ramble on as if ignoring the data altogether. It continues to try and use the tool in different ways and different parameter combinations, obviously fumbling, until I notice it flat out calls out the fact that the data is completely invisible to it. While errors are being sent back in the response, the agent actually claims there are no errors. What is going on?

After some investigation, the problem was revealed to be the fact that we’ve simply reached a cap in the agent’s capacity to process large amounts of data in the response.
I used an existing API that was extremely verbose, which I initially even considered to be an advantage. The end result, however, was that I somehow managed to overwhelm the model. Overall, there were around 360k characters and 16k words in the response JSON. This includes call stacks, error frames, and references. This should have been supported just by looking at the context window limit for the model I was using (Claude 3.7 Sonnet should support up to 200k tokens), but nevertheless the large data dump left the agent thoroughly stumped.
One strategy would be to change the model to one that supports an even bigger context window. I switched over to the Gemini 2.5 pro model just to test that theory out, as it boasts an outrageous limit of one million tokens. Sure enough, the same query now yielded a much more intelligent response:

This is great! The agent was able to parse the errors and find the systematic cause of many of them with some basic reasoning. However, we can’t rely on the user using a specific model, and to complicate things, this was output from a relatively low bandwidth testing environment. What if the dataset were even larger?
To solve this issue, I made some fundamental changes to how the API was structured:
- Nested data hierarchy: Keep the initial response focused on high-level details and aggregations. Create a separate API to retrieve the call stacks of specific frames as needed.
- Enhance queryability: All of the queries made so far by the agent used a very small page size for the data (10), if we want the agent to be able to to access more relevant subsets of the data to fit with the limitations of its context, we need to provide more APIs to query errors based on different dimensions, for example: affected methods, error type, priority and impact etc.
With the new changes, the tool now consistently analyzes important new exceptions and comes up with fix suggestions. However, I glanced over another minor detail I needed to sort before I could really use it reliably.
Lesson 2: What’s the time?

The keen-eyed reader may have noticed that in the previous example, to retrieve the errors in a specific time range, the agent uses the ISO 8601 time duration format instead of the actual dates and times. So instead of including standard ‘From’ and ‘To’ parameters with datetime values, the AI sent a duration value, for example, seven days or P7D, to indicate it wants to check for errors in the past week.
The reason for this is somewhat strange — the agent might not know the current date and time! You can verify that yourself by asking the agent that simple question. The below would have made sense were it not for the fact that I typed that prompt in at around noon on May 4th…

Using time duration values turned out to be a great solution that the agent handled quite well. Don’t forget to document the expected value and example syntax in the tool parameter description, though!
Lesson 3: When the agent makes a mistake, show it how to do better
In the first example, I was actually taken aback by how the agent was able to decipher the dependencies between the different tool calls In order to provide the right environment identifier. In studying the MCP contract, it figured out that it had to call on a dependent another tool to get the list of environment IDs first.
However, responding to other requests, the agent would sometimes take the environment names mentioned in the prompt verbatim. For example, I noticed that in response to this question: compare slow traces for this method between the test and prod environments, are there any significant differences? Depending on the context, the agent would sometimes use the environment names mentioned in the request and would send the strings “test” and “prod” as the environment ID.
In my original implementation, my MCP server would silently fail in this scenario, returning an empty response. The agent, upon receiving no data or a generic error, would simply quit and try to solve the request using another strategy. To offset that behavior, I quickly changed my implementation so that if an incorrect value was provided, the JSON response would describe exactly what went wrong, and even provide a valid list of possible values to save the agent another tool call.

This was enough for the agent, learning from its mistake, it repeated the call with the correct value and somehow also avoided making that same error in the future.
Lesson 4: Focus on user intent and not functionality
While it is tempting to simply describe what the API is doing, sometimes the generic terms don’t quite allow the agent to realize the type of requirements for which this functionality might apply best.
Let’s take a simple example: My MCP server has a tool that, for each method, endpoint, or code location, can indicate how it’s being used at runtime. Specifically, it uses the tracing data to indicate which application flows reach the specific function or method.
The original documentation simply described this functionality:
[McpServerTool,
Description(
@"For this method, see which runtime flows in the application
(including other microservices and code not in this project)
use this function or method.
This data is based on analyzing distributed tracing.")]
public static async Task GetUsagesForMethod(IMcpService client,
[Description("The environment id to check for usages")]
string environmentId,
[Description("The name of the class. Provide only the class name without the namespace prefix.")]
string codeClass,
[Description("The name of the method to check, must specify a specific method to check")]
string codeMethod)
The above represents a functionally accurate description of what this tool does, but it doesn’t necessarily make it clear what types of activities it might be relevant for. After seeing that the agent wasn’t picking this tool up for various prompts I thought it would be fairly useful for, I decided to rewrite the tool description, this time emphasizing the use cases:
[McpServerTool,
Description(
@"Find out what is the how a specific code location is being used and by
which other services/code.
Useful in order to detect possible breaking changes, to check whether
the generated code will fit the current usages,
to generate tests based on the runtime usage of this method,
or to check for related issues on the endpoints triggering this code
after any change to ensure it didnt impact it"
Updating the text helped the agent realize why the information was useful. For example, before making this change, the agent would not even trigger the tool in response to a prompt similar to the one below. Now, it has become completely seamless, without the user having to directly mention that this tool should be used:

Lesson 5: Document your JSON responses
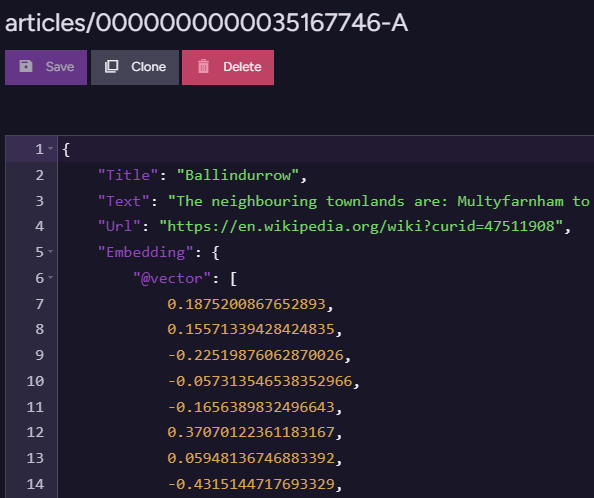
The JSON standard, at least officially, does not support comments. That means that if the JSON is all the agent has to go on, it might be missing some clues about the context of the data you’re returning. For example, in my aggregated error response, I returned the following score object:
"Score": {"Score":21,
"ScoreParams":{ "Occurrences":1,
"Trend":0,
"Recent":20,
"Unhandled":0,
"Unexpected":0}}
Without proper documentation, any non-clairvoyant agent would be hard pressed to make sense of what these numbers mean. Thankfully, it is easy to add a comment element at the beginning of the JSON file with additional information about the data provided:
"_comment": "Each error contains a link to the error trace,
which can be retrieved using the GetTrace tool,
information about the affected endpoints the code and the
relevant stacktrace.
Each error in the list represents numerous instances
of the same error and is given a score after its been
prioritized.
The score reflects the criticality of the error.
The number is between 0 and 100 and is comprised of several
parameters, each can contribute to the error criticality,
all are normalized in relation to the system
and the other methods.
The score parameters value represents its contributation to the
overall score, they include:

1. 'Occurrences', representing the number of instances of this error
compared to others.
2. 'Trend' whether this error is escalating in its
frequency.
3. 'Unhandled' represents whether this error is caught
internally or poropagates all the way
out of the endpoint scope
4. 'Unexpected' are errors that are in high probability
bugs, for example NullPointerExcetion or
KeyNotFound",
"EnvironmentErrors":[]
This enables the agent to explain to the user what the score means if they ask, but also feed this explanation into its own reasoning and recommendations.
Choosing the right architecture: SSE vs STDIO,
There are two architectures you can use in developing an MCP server. The more common and widely supported implementation is making your server available as a command triggered by the MCP client. This could be any CLI-triggered command; npx, docker, and python are some common examples. In this configuration, all communication is done via the process STDIO, and the process itself is running on the client machine. The client is responsible for instantiating and maintaining the lifecycle of the MCP server.

This client-side architecture has one major drawback from my perspective: Since the MCP server implementation is run by the client on the local machine, it is much harder to roll out updates or new capabilities. Even if that problem is somehow solved, the tight coupling between the MCP server and the backend APIs it depends on in our applications would further complicate this model in terms of versioning and forward/backward compatibility.
For these reasons, I chose the second type of MCP Server — an SSE Server hosted as a part of our application services. This removes any friction from running CLI commands on the client machine, as well as allows me to update and version the MCP server code along with the application code that it consumes. In this scenario, the client is provided with a URL of the SSE endpoint with which it interacts. While not all clients currently support this option, there is a brilliant commandMCP called supergateway that can be used as a proxy to the SSE server implementation. That means users can still add the more widely supported STDIO variant and still consume the functionality hosted on your SSE backend.

MCPs are still new
There are many more lessons and nuances to using this deceptively simple technology. I have found that there is a big gap between implementing a workable MCP to one that can actually integrate with user needs and usage scenarios, even beyond those you have anticipated. Hopefully, as the technology matures, we’ll see more posts on Best Practices and
Want to Connect? You can reach me on Twitter at @doppleware or via LinkedIn.
Follow my mcp for dynamic code analysis using observability at https://github.com/digma-ai/digma-mcp-server
The post How Not to Write an MCP Server appeared first on Towards Data Science.


