


![How to Build an AI Assistant with Keith Moehring [MAICON 2025 Speaker Series]](https://www.marketingaiinstitute.com/hubfs/MAICON-Speaker_Series%20%281%29.png)
![[The AI Show Episode 156]: AI Answers - Data Privacy, AI Roadmaps, Regulated Industries, Selling AI to the C-Suite & Change Management](https://www.marketingaiinstitute.com/hubfs/ep%20156%20cover.png)
![[The AI Show Episode 155]: The New Jobs AI Will Create, Amazon CEO: AI Will Cut Jobs, Your Brain on ChatGPT, Possible OpenAI-Microsoft Breakup & Veo 3 IP Issues](https://www.marketingaiinstitute.com/hubfs/ep%20155%20cover.png)


.jpg?width=1920&height=1920&fit=bounds&quality=70&format=jpg&auto=webp#)


_Michael_Burrell_Alamy.jpg?width=1280&auto=webp&quality=80&disable=upscale#)


Data Cleaning Part I.
This is a multipart series highlighting the processes involved in Cleaning data for Analysis. Data cleaning, refers to the process of identifying and correcting inaccuracies, inconsistencies, and errors in a data set to help improve its readability, quality, reliability and robustness. Data wrangling, also known as data munging, is the process of transforming raw, messy data into a clean, usable format for analysis and decision-making. It involves a range of techniques like cleaning, transforming, and restructuring data to ensure it is reliable, accurate, and consistent. Essentially, data wrangling prepares data for further processing, modeling, and analysis. Benefits of Data Cleaning; includes more accurate decision-making, increased productivity, and improved data-driven insights. In Python, some of the most popular libraries for cleaning data are; Pandas among other libraries like Scikit-learn, Pyjanitor, SciPy, DataPrep, CleanLab, Scrubadub, DataCleaner, CleanPrep and many more. Data cleaning with pandas involves identifying and correcting errors, inconsistencies, and missing values in a dataset to ensure its accuracy and reliability for further analysis. Common data cleaning tasks using pandas include: i) Handling Missing values: a) Identifying missing values using isnull() and/or isna() functions. b) Finding and filling missing values using the fillna() function with a specific value, mean, median and mode or any other appropriate strategy. Additional fillna() Options inplace=True: Modifies the DataFrame directly without creating a new one. method='ffill' or method='pad': Fills NaN values with the previous valid value. method='bfill' or method='backfill': Fills NaN values with the next valid value. limit: Sets the maximum number of consecutive NaN values to fill. c) Removing rows or columns with missing values using dropna() function. ii) Removing Duplicates: a)Identifying duplicates in a row using the duplicated() function. b) Removing duplicate rows using drop_duplicates() function. iii) Correcting Data Types: a) Checking data types of columns using dtypes. b) Converting data types using astype() function to ensure consistency and also enable proper data analysis. iv) Handling Outliers: a) Identify outliers using descriptive statistics like (Interquartile Range (IQR) method, the Z-score method) or using visualization like box plots. b) Removing or transforming outliers based on the context and analysis objectives. v) Clean Text Data and Formatting: a) Removing leading/Trailing spaces using strip(),lstrip(), rstrip(). b) You may opt to convert the text to upper or lowercase for data consistency, e.g., lower() or upper(). c) Replacing specific characters or patterns using replace(). #Example of replace() function in Python. string = "The Quick Brown Fox Jumped Over the Lazy Dog" new_string = string.replace("Over", "Under") print(new_string) # Output: sample string sample vi) Renaming Columns: a) Renaming columns to meaningful names using rename() function. vii) Removing or Avoiding Irrelevant Columns: a) Removing or totally avoiding irrelevant columns which may not be needed or necessary for analysis using drop() function. import pandas as pd # Sample Data-frame with potential data cleaning issues data = {'A': [1, 2, 3, None, 5], 'B': [None, 2, 3, None, 5], 'C': [None, 2, 3, 4, 5], 'Size(Sq.Miles)': [224961, 93065, 365755, 248777, 10169], 'Country': [' Kenya ', 'Uganda ', 'Tanzania ', 'S. Sudan ', 'Rwanda '], 'GDP(2023) in Billions': [108, 48.77, 79.06, 4.7, 14.1], 'Pop(2023) in Millions': [55.34, 66.62, 48.66, 13.95, 11.48]} # convert the dataset into a dataframe df = pd.DataFrame(data) # Drop rows with missing values df_cleaned = df.dropna() # Fill missing values with 0 df_filled = df.fillna(0) # Remove duplicate rows df_no_duplicates = df.drop_duplicates(subset=['GDP(2023) in Billions', 'Pop(2023) in Millions']) # Strip whitespace from column 'Country' df['Country'] = df['Country'].str.strip() print("Original DataFrame:") print("-------------------") print(df) print("") print("Cleaned DataFrame (missing values dropped):") print("-------------------------------------------") print(df_cleaned) print("\nCleaned DataFrame (missing values filled with 0):") print("---------------------------------------------------") print(df_filled) print("\nCleaned DataFrame (duplicates dropped):") print("---------------------------------------") print(df_no_duplicates) When working with a dataset, it is import to identify rows and columns and their data types in Python, particularly when working with data structures like Pandas Da

This is a multipart series highlighting the processes involved in Cleaning data for Analysis.
Data cleaning, refers to the process of identifying and correcting inaccuracies, inconsistencies, and errors in a data set to help improve its readability, quality, reliability and robustness.
Data wrangling, also known as data munging, is the process of transforming raw, messy data into a clean, usable format for analysis and decision-making. It involves a range of techniques like cleaning, transforming, and restructuring data to ensure it is reliable, accurate, and consistent. Essentially, data wrangling prepares data for further processing, modeling, and analysis.
Benefits of Data Cleaning; includes more accurate decision-making, increased productivity, and improved data-driven insights.
In Python, some of the most popular libraries for cleaning data are; Pandas among other libraries like Scikit-learn, Pyjanitor, SciPy, DataPrep, CleanLab, Scrubadub, DataCleaner, CleanPrep and many more. Data cleaning with pandas involves identifying and correcting errors, inconsistencies, and missing values in a dataset to ensure its accuracy and reliability for further analysis.
Common data cleaning tasks using pandas include:
i) Handling Missing values:
a) Identifying missing values using isnull() and/or
isna() functions.
b) Finding and filling missing values using the fillna()
function with a specific value, mean, median and mode or
any other appropriate strategy.
Additional fillna() Options
inplace=True: Modifies the DataFrame directly without
creating a new one.
method='ffill' or method='pad': Fills NaN values
with the previous valid value.
method='bfill' or method='backfill': Fills NaN
values with the next valid value.
limit: Sets the maximum number of consecutive NaN
values to fill.
c) Removing rows or columns with missing values using
dropna() function.
ii) Removing Duplicates:
a)Identifying duplicates in a row using the duplicated()
function.
b) Removing duplicate rows using drop_duplicates()
function.
iii) Correcting Data Types:
a) Checking data types of columns using dtypes.
b) Converting data types using astype() function to ensure
consistency and also enable proper data analysis.
iv) Handling Outliers:
a) Identify outliers using descriptive statistics like
(Interquartile Range (IQR) method, the Z-score method) or
using visualization like box plots.
b) Removing or transforming outliers based on the context
and analysis objectives.
v) Clean Text Data and Formatting:
a) Removing leading/Trailing spaces using strip(),lstrip(),
rstrip().
b) You may opt to convert the text to upper or lowercase for
data consistency, e.g., lower() or upper().
c) Replacing specific characters or patterns using
replace().
  #Example of replace() function in Python.
  string = "The Quick Brown Fox Jumped Over the Lazy Dog"
  new_string = string.replace("Over", "Under")
  print(new_string)
# Output: sample string sample
vi) Renaming Columns:
a) Renaming columns to meaningful names using rename()
function.
vii) Removing or Avoiding Irrelevant Columns:
a) Removing or totally avoiding irrelevant columns which may
not be needed or necessary for analysis using drop()
function.
   import pandas as pd

  # Sample Data-frame with potential data cleaning issues
data = {'A': [1, 2, 3, None, 5],
        'B': [None, 2, 3, None, 5],
        'C': [None, 2, 3, 4, 5],
        'Size(Sq.Miles)': [224961, 93065, 365755, 248777, 10169],
        'Country': [' Kenya ', 'Uganda ', 'Tanzania ', 'S. Sudan ', 'Rwanda '],
        'GDP(2023) in Billions': [108, 48.77, 79.06, 4.7, 14.1],
        'Pop(2023) in Millions': [55.34, 66.62, 48.66, 13.95, 11.48]}

  # convert the dataset into a dataframe
  df = pd.DataFrame(data)

  # Drop rows with missing values
  df_cleaned = df.dropna()

  # Fill missing values with 0
  df_filled = df.fillna(0)

  # Remove duplicate rows
  df_no_duplicates = df.drop_duplicates(subset=['GDP(2023) in
  Billions', 'Pop(2023) in Millions'])

  # Strip whitespace from column 'Country'
  df['Country'] = df['Country'].str.strip()

  print("Original DataFrame:")
  print("-------------------")
  print(df)
  print("")
  print("Cleaned DataFrame (missing values dropped):")
  print("-------------------------------------------")
  print(df_cleaned)

  print("\nCleaned DataFrame (missing values filled with 0):")
  print("---------------------------------------------------")
  print(df_filled)

  print("\nCleaned DataFrame (duplicates dropped):")
  print("---------------------------------------")
  print(df_no_duplicates)
When working with a dataset, it is import to identify rows and columns and their data types in Python, particularly when working with data structures like Pandas DataFrames:
Using dtypes
The .dtypes attribute in Pandas is the most direct way to inspect the data type of each column in a DataFrame.
Below is a how this will assist you to get to know which types of data types you are working with.
   import pandas as pd

   # Sample DataFrame
   df = pd.DataFrame(data)

   # Identify column data types
   print(df.dtypes)
It is also imperative to get to understand the dataset you plan to work with. Get to identify the missing rows or null values. Using the info() function will help you determine which rows have null values or are missing some values.
df.info()
Below is the output of the above code snippet. As you can see, we have the first 3 rows (A, B, and C) which are missing some values in their rows. while the rest of the rows are having 5 each, which is the full row values.
Below is the screenshot of what you shall see to help determine the datatypes you have. Rows A to C are of float64 datatype. Which means these are numbers, while row of Size is an int64 while Country is an object, which means it is a string value. The GPD and the Pop columns are made up of float64 which means they are in the range of numbers.

The shape() function usage will help you in determining the rows and columns contained in a dataset.
df.shape()
Above, is the code snippet of what you shall see to help you determine the size of data set you have to work with. (5, 7) in our case represents 5 rows and 7 columns.
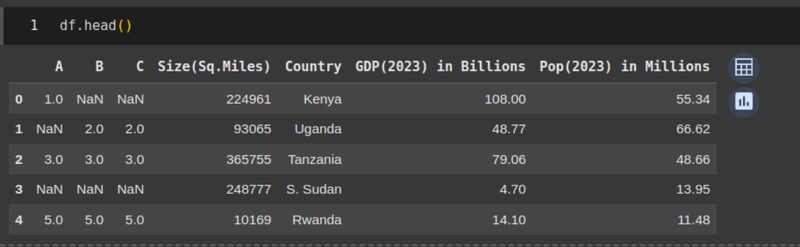
Using the head() and the tail() functions also gives us a snapshot of the first 5 rows of dataset and the last 5 rows of the dataset respectively - assuming that your Dataframe is stored in a variable df.
df.head()
df.tail()

To get to know how many rows of data are empty or with null values, you can employ one of the following strategies. Assuming that your Dataframe is stored in a variable df
df.isnull().sum()
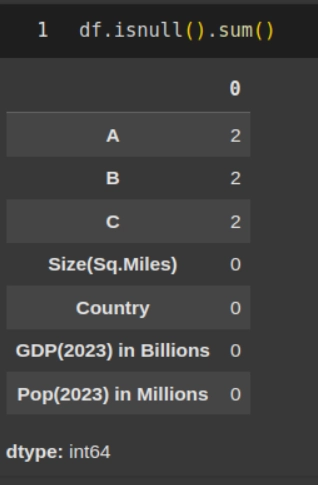
OR
df.isna().sum()

Any of the above functions isnull() or isna() should work just fine.
In Summary
This brings us to the end of of this Part I of the Data cleaning, also known as data cleansing or scrubbing, refers to the process of identifying and correcting inconsistencies and getting rid of errors in a dataset to help improve its quality and usability. This involves removing duplicates, handling missing values, irrelevant data, fixing incorrect formats, and standardizing entries. The goal is to ensure data accuracy, completeness, and consistency, making it suitable for analysis and decision-making.