


![[The AI Show Episode 146]: Rise of “AI-First” Companies, AI Job Disruption, GPT-4o Update Gets Rolled Back, How Big Consulting Firms Use AI, and Meta AI App](https://www.marketingaiinstitute.com/hubfs/ep%20146%20cover.png)


![Ditching a Microsoft Job to Enter Startup Hell with Lonewolf Engineer Sam Crombie [Podcast #171]](https://cdn.hashnode.com/res/hashnode/image/upload/v1746753508177/0cd57f66-fdb0-4972-b285-1443a7db39fc.png?#)


.jpg?width=1920&height=1920&fit=bounds&quality=70&format=jpg&auto=webp#)


-Nintendo-Switch-2-Hands-On-Preview-Mario-Kart-World-Impressions-&-More!-00-10-30.png?width=1920&height=1920&fit=bounds&quality=70&format=jpg&auto=webp#)


-xl.jpg)


![New iPad 11 (A16) On Sale for Just $277.78! [Lowest Price Ever]](https://www.iclarified.com/images/news/97273/97273/97273-640.jpg)

![Apple Foldable iPhone to Feature New Display Tech, 19% Thinner Panel [Rumor]](https://www.iclarified.com/images/news/97271/97271/97271-640.jpg)


![[Weekly funding roundup May 3-9] VC inflow into Indian startups touches new high](https://images.yourstory.com/cs/2/220356402d6d11e9aa979329348d4c3e/WeeklyFundingRoundupNewLogo1-1739546168054.jpg)


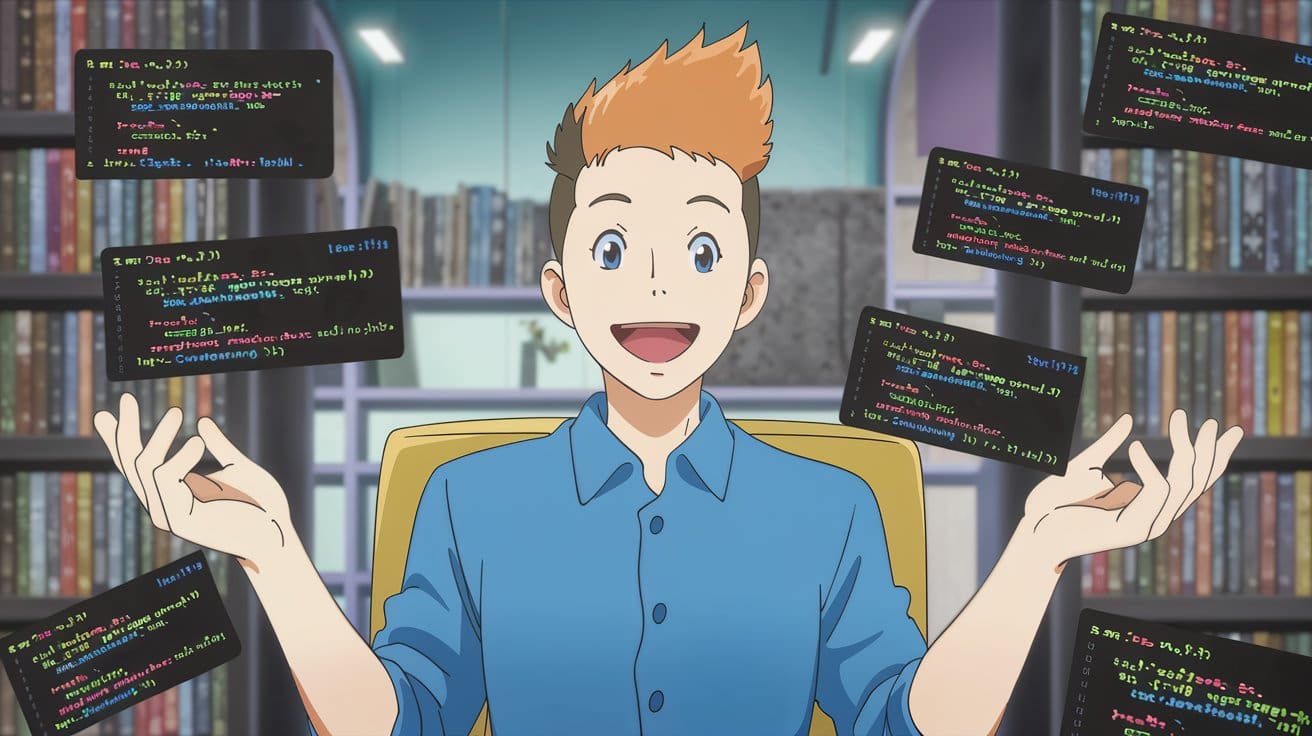
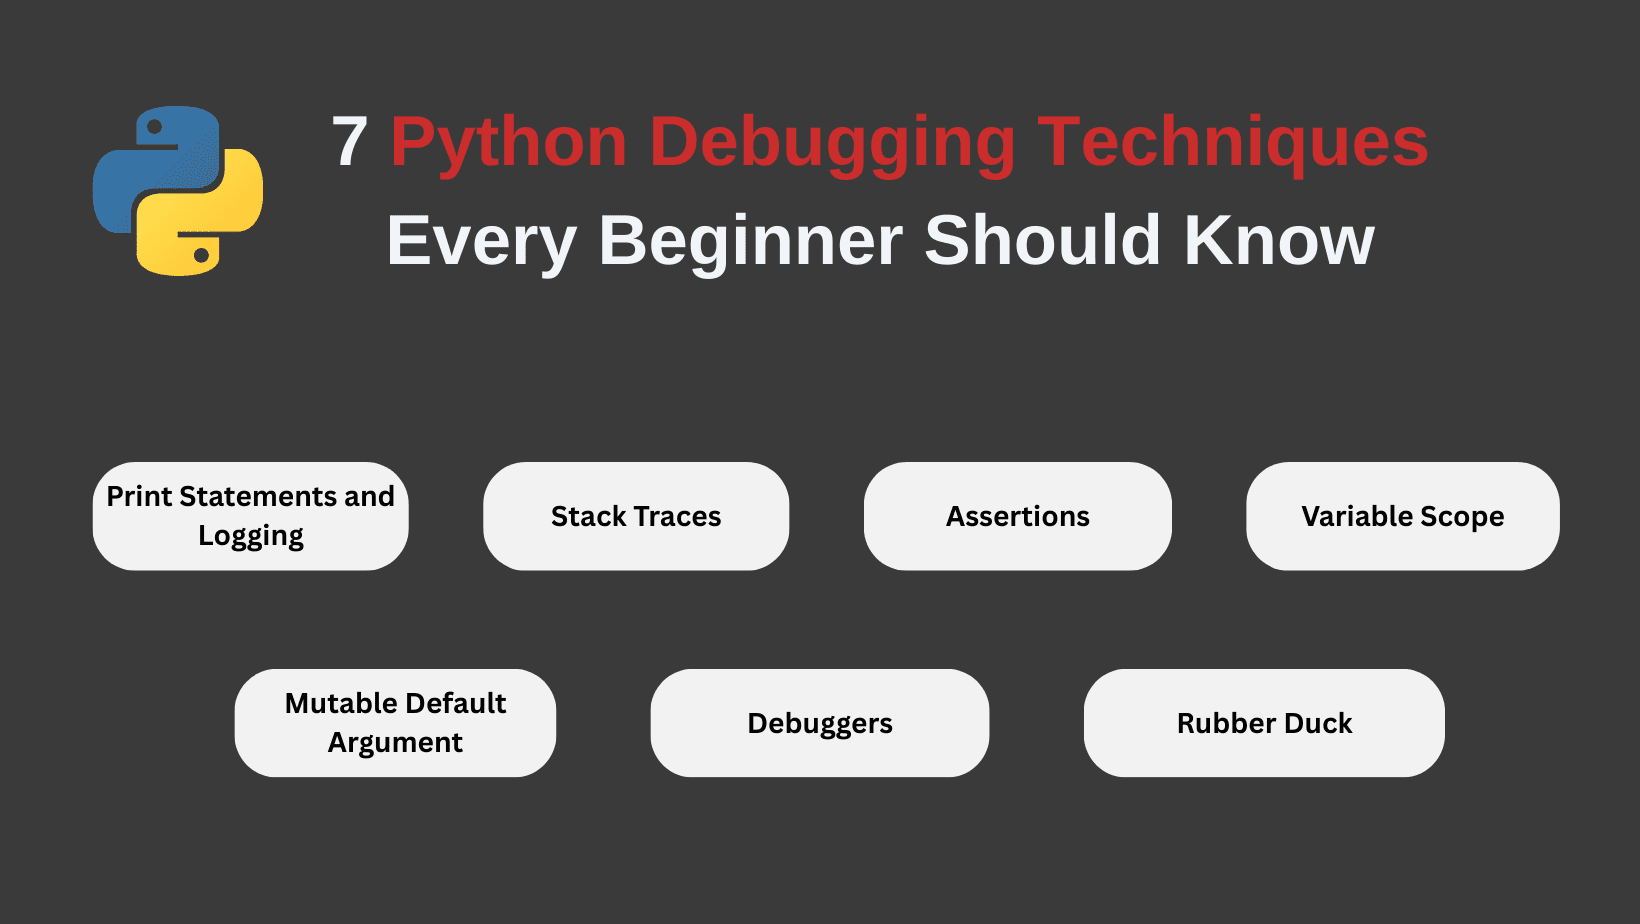
Ditch the Log: Supercharge Your Debugging Game with These Modern Tricks
The Console.log Comfort Zone: Time to Break Free! Hey there, fellow code wranglers! Remember when you first learned about console.log? It was like finding a trusty flashlight in a dark, buggy cave. But let's be real - we've all been guilty of plastering our code with more logs than a lumberjack convention. It's time to step up our game and explore the shiny new tools in our debugging toolbox. Why Console.log is So Yesterday Don't get me wrong, console.log isn't evil. It's like that old pair of sneakers you can't quite let go of - comfortable, but not exactly cutting-edge. Here's why we need to move on: It's messy: Your code ends up looking like a teenager's diary - full of random thoughts and exclamation points. It's slow: Excessive logging can actually slow down your app. Yikes! It's limited: Ever tried to log a complex object? It's about as helpful as a chocolate teapot. Modern Debugging Tricks: Your New Best Friends 1. Breakpoints: The Time-Stopping Superpower Imagine if you could freeze time in your code. That's exactly what breakpoints do! Here's how to use them like a pro: Open your browser's dev tools (F12 is your magic key). Click on the line number where you want to pause execution. Refresh your page and watch the magic happen! Breakpoints let you inspect variables, step through code line by line, and even change values on the fly. It's like being Doctor Strange, but for debugging! 2. console.table(): Data in a Tux If console.log is a t-shirt and jeans, console.table() is a perfectly tailored suit. It turns your messy data into a sleek, organized table. Check this out: const myTeam = [ { name: 'Alice', role: 'Developer', coffeeConsumed: 5 }, { name: 'Bob', role: 'Designer', coffeeConsumed: 3 }, { name: 'Charlie', role: 'Manager', coffeeConsumed: 7 } ]; console.table(myTeam); Run this, and you'll see a beautiful table that even your project manager would approve of! 3. Conditional Breakpoints: The Smart Cookie Regular breakpoints are cool, but conditional breakpoints? They're the Einstein of the debugging world. Set a condition, and your code will only pause when that condition is met. It's like having a personal assistant who only bothers you when it's important. Here's how: Set a breakpoint as usual. Right-click on the breakpoint. Select 'Edit breakpoint' and enter your condition. For example: i === 42 will only pause when i is the answer to life, the universe, and everything. 4. console.trace(): The Family Tree of Function Calls Ever wondered how your function got called? console.trace() is like a family tree for your code. It shows you the exact path of execution. Just drop it in your function: function deeplyNestedFunction() { console.trace('Who called me?'); // Your code here } Run this, and you'll see a stack trace that would make Sherlock Holmes proud! The Debugger Statement: Your Code's Emergency Brake Sometimes, you need to stop everything and take a look around. That's where the debugger statement comes in. It's like yelling "FREEZE!" in a movie: function mysteriousFunction(x, y) { debugger; // Your potentially buggy code here } When the JavaScript engine hits this line, it'll pause execution and open the debugger. It's perfect for those "What on earth is happening here?" moments. Chrome DevTools: Your New Playground If you're not using Chrome DevTools, you're missing out on a treasure trove of debugging goodness. Here are some cool tricks: Network Tab: See all your requests, response times, and even simulate slow 3G. It's like x-ray vision for your app's communication. Performance Tab: Find out what's making your app slower than a snail on vacation. Application Tab: Peek into local storage, session storage, and cookies. It's like being the NSA, but for your own app! A Personal Debugging Tale Let me share a quick story. Last week, I was working on a project that was acting weirder than a cat on catnip. I had console.logs everywhere, but I was still lost. Then I remembered these modern techniques. I set a conditional breakpoint, used console.table() to visualize my data, and boom! I found the bug in 10 minutes flat. My rubber duck was impressed. Wrapping Up: Your Debugging Toolkit To recap, here's your new debugging arsenal: Breakpoints (regular and conditional) console.table() console.trace() The debugger statement Chrome DevTools superpowers Remember, great debugging is an art. It's about asking the right questions and knowing which tool to use when. So go forth, fellow devs, and debug like the coding ninjas you are! And hey, if you found this helpful, why not follow me? I promise more tips that are cooler than the other side of the pillow. Just hit that follow button - it's bug-free, I swear! P.S. If you see me furiously typing and muttering "It worked on my machine" in a coffee shop, come s

The Console.log Comfort Zone: Time to Break Free!
Hey there, fellow code wranglers! Remember when you first learned about console.log? It was like finding a trusty flashlight in a dark, buggy cave. But let's be real - we've all been guilty of plastering our code with more logs than a lumberjack convention. It's time to step up our game and explore the shiny new tools in our debugging toolbox.
Why Console.log is So Yesterday
Don't get me wrong, console.log isn't evil. It's like that old pair of sneakers you can't quite let go of - comfortable, but not exactly cutting-edge. Here's why we need to move on:
- It's messy: Your code ends up looking like a teenager's diary - full of random thoughts and exclamation points.
- It's slow: Excessive logging can actually slow down your app. Yikes!
- It's limited: Ever tried to log a complex object? It's about as helpful as a chocolate teapot.
Modern Debugging Tricks: Your New Best Friends
1. Breakpoints: The Time-Stopping Superpower
Imagine if you could freeze time in your code. That's exactly what breakpoints do! Here's how to use them like a pro:
- Open your browser's dev tools (F12 is your magic key).
- Click on the line number where you want to pause execution.
- Refresh your page and watch the magic happen!
Breakpoints let you inspect variables, step through code line by line, and even change values on the fly. It's like being Doctor Strange, but for debugging!
2. console.table(): Data in a Tux
If console.log is a t-shirt and jeans, console.table() is a perfectly tailored suit. It turns your messy data into a sleek, organized table. Check this out:
const myTeam = [
  { name: 'Alice', role: 'Developer', coffeeConsumed: 5 },
  { name: 'Bob', role: 'Designer', coffeeConsumed: 3 },
  { name: 'Charlie', role: 'Manager', coffeeConsumed: 7 }
];

console.table(myTeam);
Run this, and you'll see a beautiful table that even your project manager would approve of!
3. Conditional Breakpoints: The Smart Cookie
Regular breakpoints are cool, but conditional breakpoints? They're the Einstein of the debugging world. Set a condition, and your code will only pause when that condition is met. It's like having a personal assistant who only bothers you when it's important.
Here's how:
- Set a breakpoint as usual.
- Right-click on the breakpoint.
- Select 'Edit breakpoint' and enter your condition.
For example: i === 42 will only pause when i is the answer to life, the universe, and everything.
4. console.trace(): The Family Tree of Function Calls
Ever wondered how your function got called? console.trace() is like a family tree for your code. It shows you the exact path of execution. Just drop it in your function:
function deeplyNestedFunction() {
  console.trace('Who called me?');
  // Your code here
}
Run this, and you'll see a stack trace that would make Sherlock Holmes proud!
The Debugger Statement: Your Code's Emergency Brake
Sometimes, you need to stop everything and take a look around. That's where the debugger statement comes in. It's like yelling "FREEZE!" in a movie:
function mysteriousFunction(x, y) {
  debugger;
  // Your potentially buggy code here
}
When the JavaScript engine hits this line, it'll pause execution and open the debugger. It's perfect for those "What on earth is happening here?" moments.
Chrome DevTools: Your New Playground
If you're not using Chrome DevTools, you're missing out on a treasure trove of debugging goodness. Here are some cool tricks:
Network Tab: See all your requests, response times, and even simulate slow 3G. It's like x-ray vision for your app's communication.
Performance Tab: Find out what's making your app slower than a snail on vacation.
Application Tab: Peek into local storage, session storage, and cookies. It's like being the NSA, but for your own app!
A Personal Debugging Tale
Let me share a quick story. Last week, I was working on a project that was acting weirder than a cat on catnip. I had console.logs everywhere, but I was still lost. Then I remembered these modern techniques. I set a conditional breakpoint, used console.table() to visualize my data, and boom! I found the bug in 10 minutes flat. My rubber duck was impressed.
Wrapping Up: Your Debugging Toolkit
To recap, here's your new debugging arsenal:
- Breakpoints (regular and conditional)
console.table()console.trace()- The
debuggerstatement - Chrome DevTools superpowers
Remember, great debugging is an art. It's about asking the right questions and knowing which tool to use when. So go forth, fellow devs, and debug like the coding ninjas you are!
And hey, if you found this helpful, why not follow me? I promise more tips that are cooler than the other side of the pillow. Just hit that follow button - it's bug-free, I swear!
P.S. If you see me furiously typing and muttering "It worked on my machine" in a coffee shop, come say hi. Debugging is always better with company (and caffeine)!