


![[The AI Show Episode 143]: ChatGPT Revenue Surge, New AGI Timelines, Amazon’s AI Agent, Claude for Education, Model Context Protocol & LLMs Pass the Turing Test](https://www.marketingaiinstitute.com/hubfs/ep%20143%20cover.png)


![From Accountant to Data Engineer with Alyson La [Podcast #168]](https://cdn.hashnode.com/res/hashnode/image/upload/v1744420903260/fae4b593-d653-41eb-b70b-031591aa2f35.png?#)


.png?#)


![Apple Watch SE 2 On Sale for Just $169.97 [Deal]](https://www.iclarified.com/images/news/96996/96996/96996-640.jpg)

![Apple Posts Full First Episode of 'Your Friends & Neighbors' on YouTube [Video]](https://www.iclarified.com/images/news/96990/96990/96990-640.jpg)


Stream Logs from Two Services in a Single Docker Container to Grafana Cloud Loki with Alloy
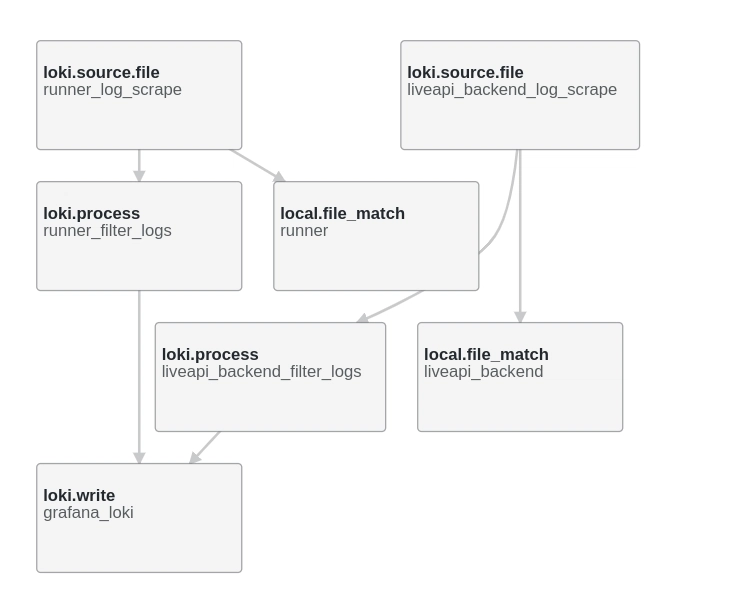
Stream Logs from Multiple Docker Services to Grafana Cloud with Alloy (Part 2) In Part 1, we set up a basic pipeline using Grafana Alloy to stream logs from a Docker container to Grafana Cloud Loki. Now let’s level up. This time, we’re collecting logs from two services — liveapi-backend and runner — each writing to their own file, and we’ll push them to Loki with proper labels so filtering and visualizing in Grafana feels effortless. The Services We’re logging from two separate backend services inside our containerized environment: liveapi-backend → /code/liveapi-backend/liveapi.log runner → /code/runner/runner.log Each of these logs need to be: Watched by Alloy Parsed and labeled Shipped to Grafana Cloud Loki Let’s walk through the configuration. The Config File Path: /etc/alloy/config.alloy # Match log file paths for both services local.file_match "liveapi_backend" { path_targets = [ { "__path__" = "/code/liveapi-backend/liveapi.log" } ] sync_period = "5s" } local.file_match "runner" { path_targets = [ { "__path__" = "/code/runner/runner.log" } ] sync_period = "5s" } # Source log lines from files and send to processors loki.source.file "liveapi_backend_log_scrape" { targets = local.file_match.liveapi_backend.targets forward_to = [loki.process.liveapi_backend_filter_logs.receiver] tail_from_end = true } loki.source.file "runner_log_scrape" { targets = local.file_match.runner.targets forward_to = [loki.process.runner_filter_logs.receiver] tail_from_end = true } # Attach static labels to each log line loki.process "liveapi_backend_filter_logs" { forward_to = [loki.write.grafana_loki.receiver] stage.static_labels { values = { job = "liveapi-backend" service_name = "liveapi-backend" } } } loki.process "runner_filter_logs" { forward_to = [loki.write.grafana_loki.receiver] stage.static_labels { values = { job = "liveapi-runner" service_name = "liveapi-runner" } } } # Loki write target — this is your Grafana Cloud endpoint loki.write "grafana_loki" { endpoint { url = "https://YOUR_INSTANCE_ID:YOUR_API_KEY@logs-prod-028.grafana.net/api/prom/push" } } Replace the url with your actual Grafana Cloud Loki push endpoint. You can find it under Logs → Details → Grafana Agent in your Grafana Cloud account. Breakdown: What’s Happening? Let’s decode the setup: local.file_match These blocks define which files Alloy watches and how often it checks for changes (sync_period). loki.source.file This is where log ingestion begins. Each source: Reads logs from the matched file path Starts tailing from the end (avoids re-sending old logs) Sends logs to the defined processor loki.process Adds metadata (aka labels) to each log line. These are critical for querying in Grafana. You can add whatever makes sense — service_name, env, region, etc. loki.write Defines the output — in our case, Grafana Cloud Loki. The URL includes: Your Grafana Cloud ID A Loki API key with write permissions Useful Commands Need to troubleshoot or inspect your setup? Validate syntax and format the config alloy fmt View the config sudo cat /etc/alloy/config.alloy Restart Alloy sudo systemctl restart alloy View logs (if running under systemd) journalctl -u alloy -n 50 --no-pager If journalctl isn’t available (common in Docker): alloy run /etc/alloy/config.alloy > /var/log/alloy.log 2>&1 & This will run Alloy in the background and dump its logs to /var/log/alloy.log. Use tail -f /var/log/alloy.log to monitor. Syntax Help Want to learn more about the config language? Alloy uses a custom HCL-inspired syntax. You can explore the syntax rules here:
Stream Logs from Multiple Docker Services to Grafana Cloud with Alloy (Part 2)
In Part 1, we set up a basic pipeline using Grafana Alloy to stream logs from a Docker container to Grafana Cloud Loki.
Now let’s level up.
This time, we’re collecting logs from two services — liveapi-backend and runner — each writing to their own file, and we’ll push them to Loki with proper labels so filtering and visualizing in Grafana feels effortless.
The Services
We’re logging from two separate backend services inside our containerized environment:
-
liveapi-backend→/code/liveapi-backend/liveapi.log -
runner→/code/runner/runner.log
Each of these logs need to be:
- Watched by Alloy
- Parsed and labeled
- Shipped to Grafana Cloud Loki
Let’s walk through the configuration.
The Config File
Path: /etc/alloy/config.alloy
# Match log file paths for both services
local.file_match "liveapi_backend" {
  path_targets = [
    { "__path__" = "/code/liveapi-backend/liveapi.log" }
  ]
  sync_period = "5s"
}

local.file_match "runner" {
  path_targets = [
    { "__path__" = "/code/runner/runner.log" }
  ]
  sync_period = "5s"
}

# Source log lines from files and send to processors
loki.source.file "liveapi_backend_log_scrape" {
  targets       = local.file_match.liveapi_backend.targets
  forward_to    = [loki.process.liveapi_backend_filter_logs.receiver]
  tail_from_end = true
}

loki.source.file "runner_log_scrape" {
  targets       = local.file_match.runner.targets
  forward_to    = [loki.process.runner_filter_logs.receiver]
  tail_from_end = true
}

# Attach static labels to each log line
loki.process "liveapi_backend_filter_logs" {
  forward_to = [loki.write.grafana_loki.receiver]

  stage.static_labels {
    values = {
      job          = "liveapi-backend"
      service_name = "liveapi-backend"
    }
  }
}

loki.process "runner_filter_logs" {
  forward_to = [loki.write.grafana_loki.receiver]

  stage.static_labels {
    values = {
      job          = "liveapi-runner"
      service_name = "liveapi-runner"
    }
  }
}

# Loki write target — this is your Grafana Cloud endpoint
loki.write "grafana_loki" {
  endpoint {
    url = "https://YOUR_INSTANCE_ID:YOUR_API_KEY@logs-prod-028.grafana.net/api/prom/push"
  }
}
Replace the url with your actual Grafana Cloud Loki push endpoint.
You can find it under Logs → Details → Grafana Agent in your Grafana Cloud account.
Breakdown: What’s Happening?
Let’s decode the setup:
local.file_match
These blocks define which files Alloy watches and how often it checks for changes (sync_period).
loki.source.file
This is where log ingestion begins. Each source:
- Reads logs from the matched file path
- Starts tailing from the end (avoids re-sending old logs)
- Sends logs to the defined processor
loki.process
Adds metadata (aka labels) to each log line. These are critical for querying in Grafana. You can add whatever makes sense — service_name, env, region, etc.
loki.write
Defines the output — in our case, Grafana Cloud Loki. The URL includes:
- Your Grafana Cloud ID
- A Loki API key with write permissions
Useful Commands
Need to troubleshoot or inspect your setup?
Validate syntax and format the config
alloy fmt
View the config
sudo cat /etc/alloy/config.alloy
Restart Alloy
sudo systemctl restart alloy
View logs (if running under systemd)
journalctl -u alloy -n 50 --no-pager
If journalctl isn’t available (common in Docker):
alloy run /etc/alloy/config.alloy > /var/log/alloy.log 2>&1 &
This will run Alloy in the background and dump its logs to /var/log/alloy.log.
Use tail -f /var/log/alloy.log to monitor.
Syntax Help
Want to learn more about the config language? Alloy uses a custom HCL-inspired syntax.
You can explore the syntax rules here: