


![[The AI Show Episode 143]: ChatGPT Revenue Surge, New AGI Timelines, Amazon’s AI Agent, Claude for Education, Model Context Protocol & LLMs Pass the Turing Test](https://www.marketingaiinstitute.com/hubfs/ep%20143%20cover.png)


![From Accountant to Data Engineer with Alyson La [Podcast #168]](https://cdn.hashnode.com/res/hashnode/image/upload/v1744420903260/fae4b593-d653-41eb-b70b-031591aa2f35.png?#)


.png?#)


![Apple Posts Full First Episode of 'Your Friends & Neighbors' on YouTube [Video]](https://www.iclarified.com/images/news/96990/96990/96990-640.jpg)

![Apple May Implement Global iPhone Price Increases to Mitigate Tariff Impacts [Report]](https://www.iclarified.com/images/news/96987/96987/96987-640.jpg)


How To Increase Code Quality in GitHub With Qodana
A year ago we shared a post on how to integrate Qodana with Github Actions on the .NET Community – but a lot has changed since then. Qodana self-hosted has been released, with analysis that can make your code more secure by detecting hardcoded passwords and running taint analysis for JVM. The new Android Linter […]

A year ago we shared a post on how to integrate Qodana with Github Actions on the .NET Community – but a lot has changed since then.
Qodana self-hosted has been released, with analysis that can make your code more secure by detecting hardcoded passwords and running taint analysis for JVM. The new Android Linter has also been released.
And, more importantly than releasing new functionality and features, the Qodana team has worked hard on improving the experience for users – creating a world-class platform for developers and QAs. As a result of this, we’re now providing a more seamless integration with Github too.
In this post, we will discuss what’s changed and how to elevate your code quality in Github with Qodana.
Table of Contents
Setting up a Qodana Project and configuring a GitHub Actions workflow file
Head over to Qodana Cloud or your on-premise solution, and create a new project.

After you created the project, choose Github Actions from the options:

You will be prompted to install the Qodana Cloud Github application. You can choose which repositories it will have access to. After installation, you will be able to link your repository to the Qodana Cloud project:

The final step is to integrate Qodana into your pipeline. To do this, you only need to choose the right linter, suitable for the language of your project and press the Save token and submit pull request button. If you want to set everything manually, you will be able to find instructions on the same page:

After that, navigate to your repository and find the pull request created by Qodana. There, you will see the configuration to apply Qodana to your GitHub CI/CD.


And that’s it! The Qodana team put a great effort into making the configuration as seamless as possible. If you would like to change the configuration later, you can easily do so in the IDE – because the configuration fully supports the YAML format. Then you can take advantage of code completion, formatting, and validation when editing the file. For instance, you can see which inspection profiles are included out of the box:

Inspecting Qodana results for GitHub Actions
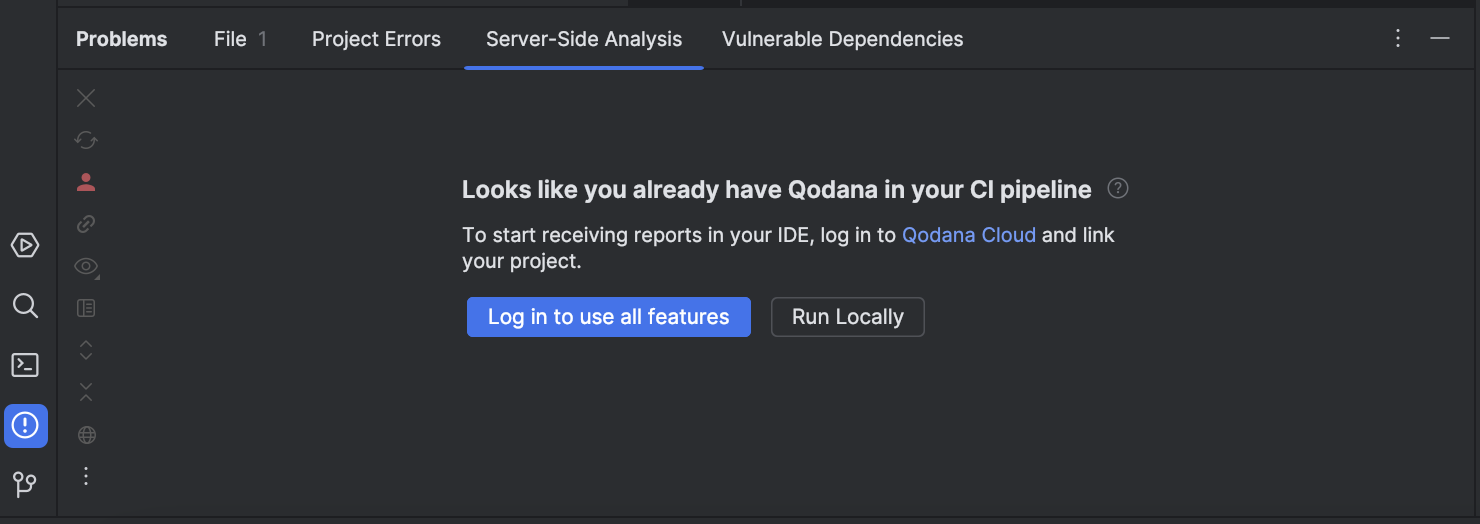
At this point, you might start imagining the process of using Qodana like this: make some changes to the project, push it to GitHub, wait until the Qodana Action is complete, view the result in Github and then start switching back and forth to fix all the issues you find. Well, here’s some good news – you can fix everything without leaving your IDE!
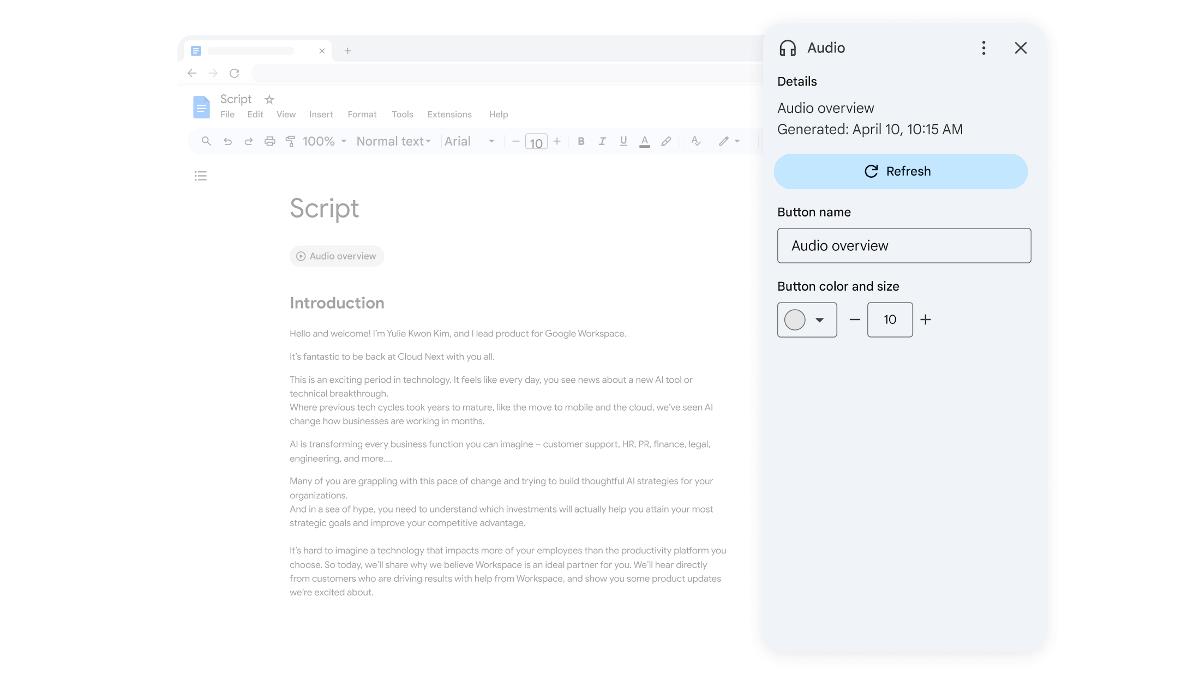
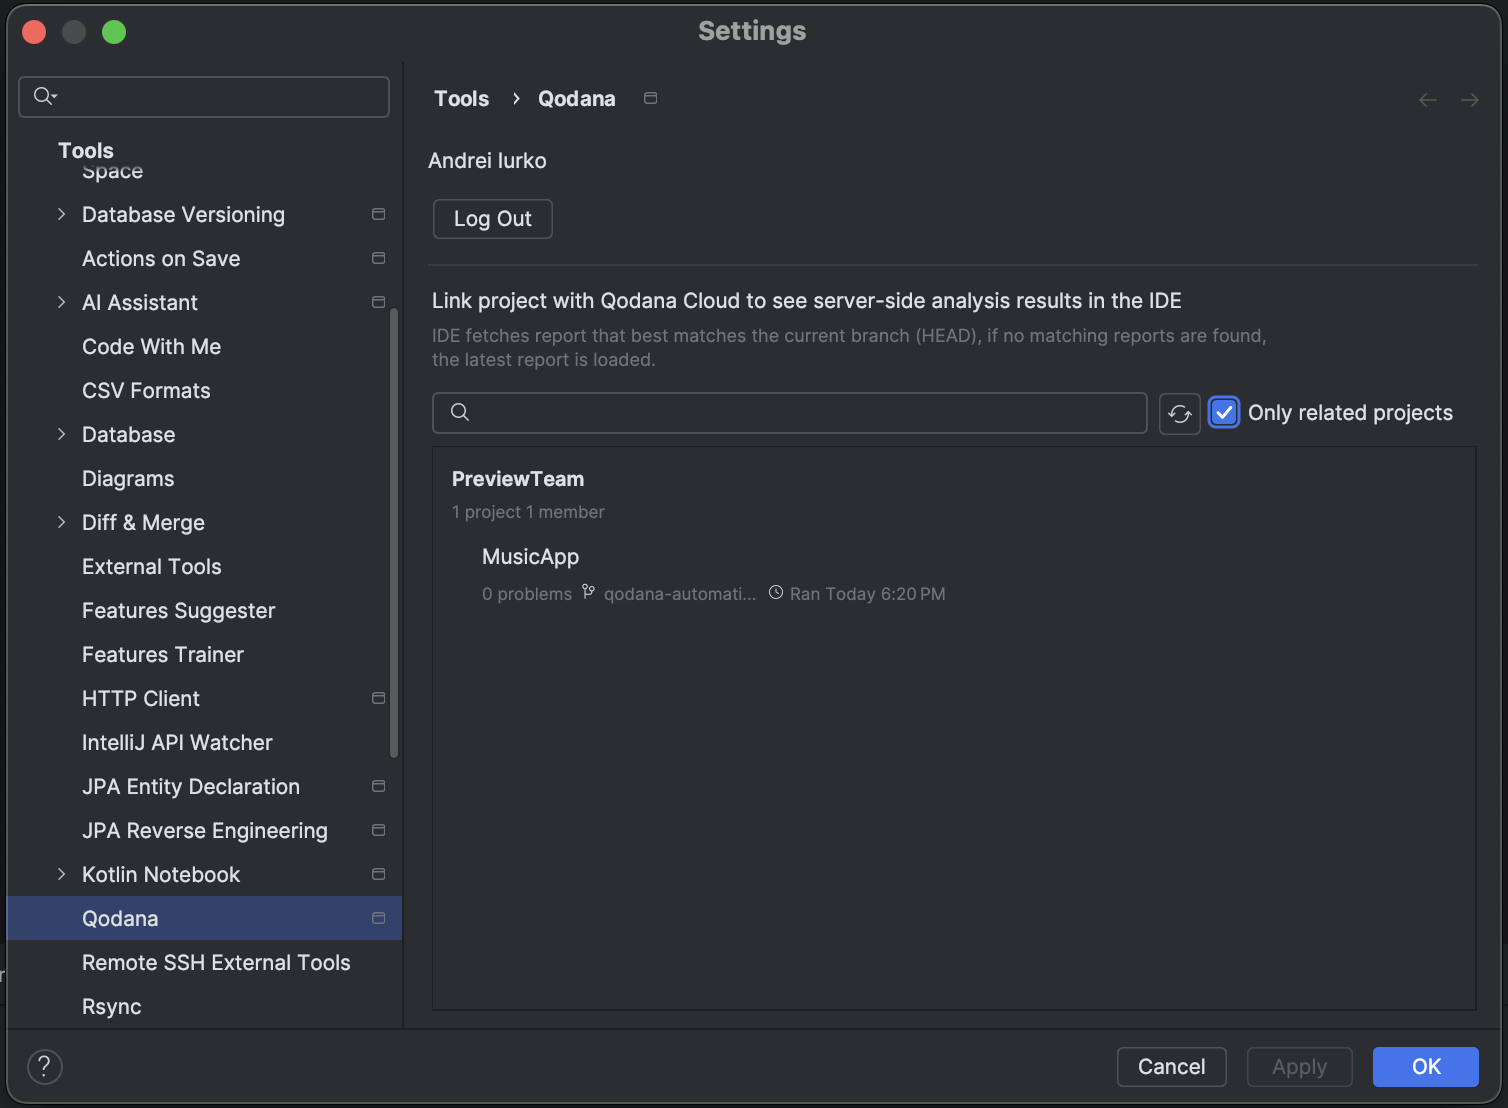
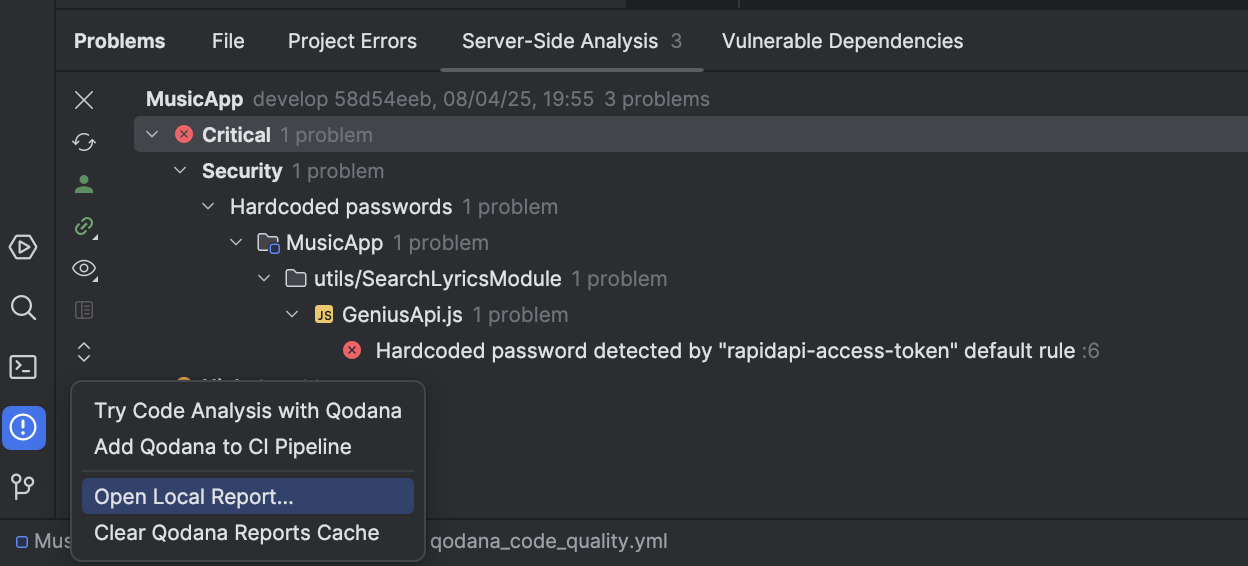
To do so, you need to connect the IDE to Qodana Cloud. Launch your IDE and navigate to problems → Server-Side Analysis tab. Make sure that the configuration suggested in GitHub is applied locally – and press the Log in to use all features button!
After you log in, you will find the Qodana Cloud project in the window – choose it and press OK.
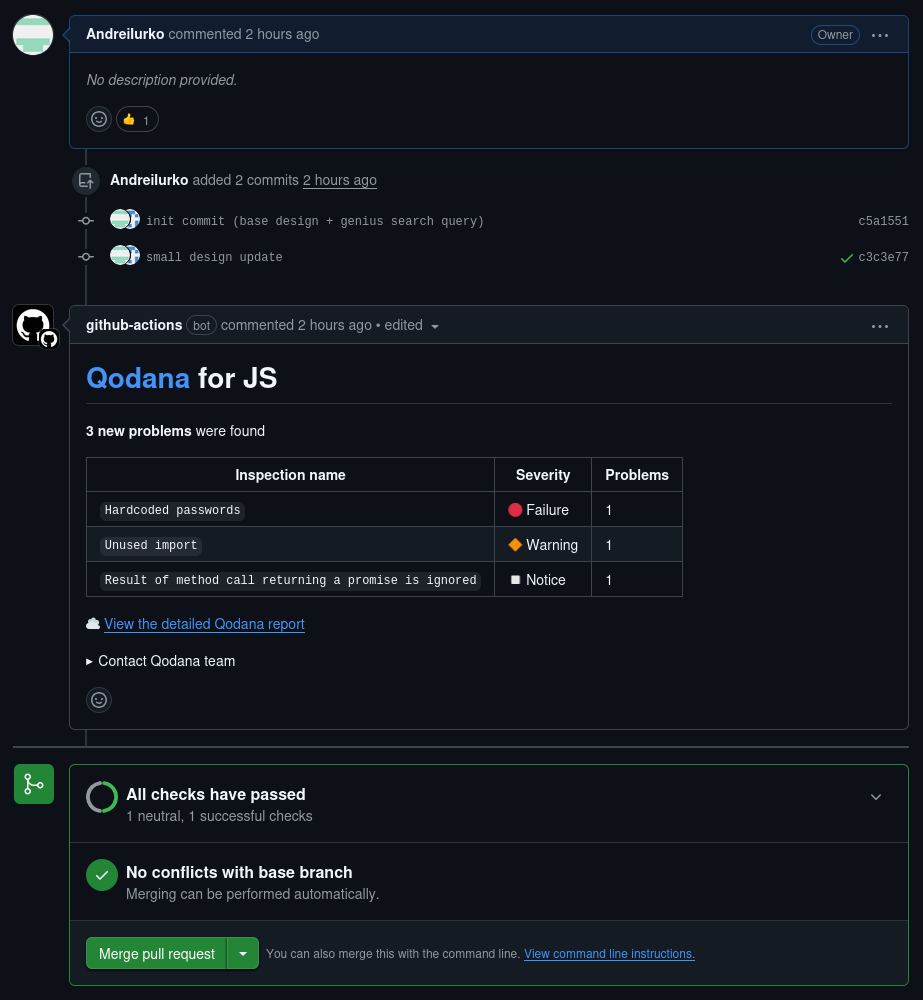
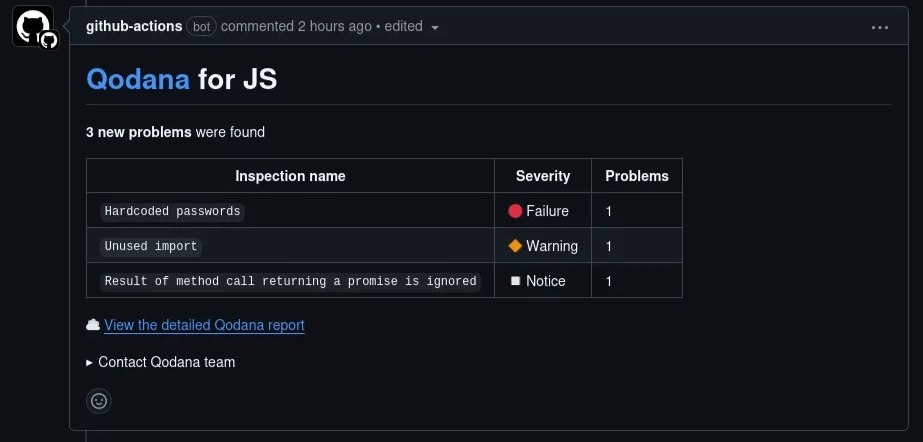
Let’s test our setup! I had this ancient react-native project for testing. After adding configuration to the develop branch, I opened a pull request to master. As you can see, Qodana gave us the result as a comment in the pull request, and we can see that there are some issues in the project.
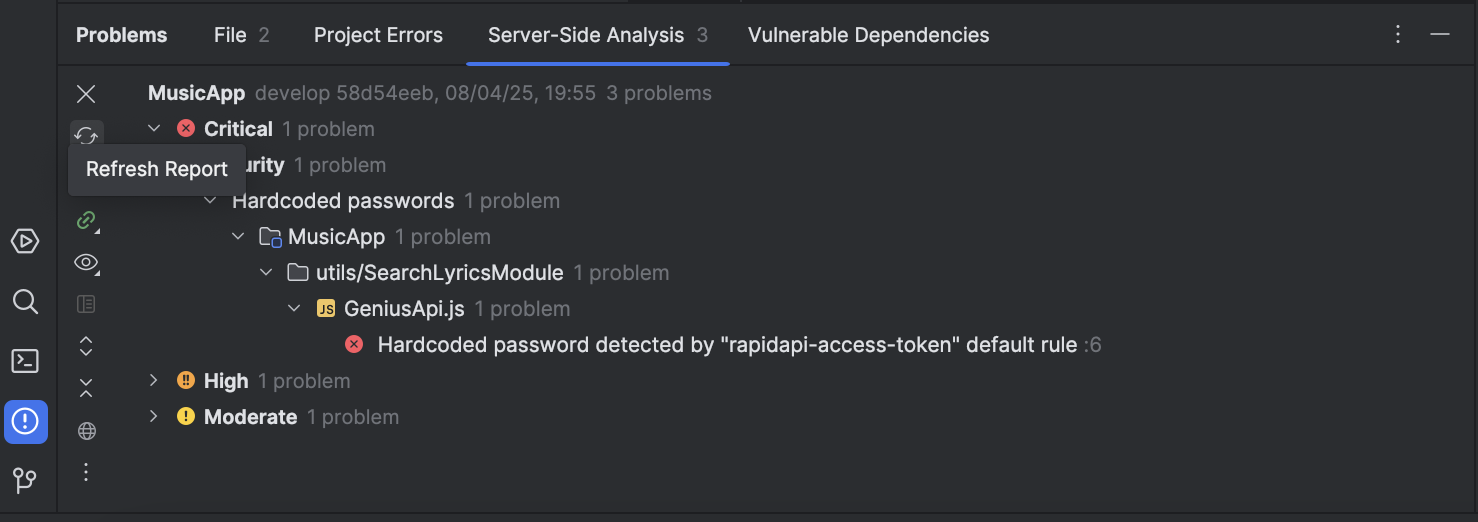
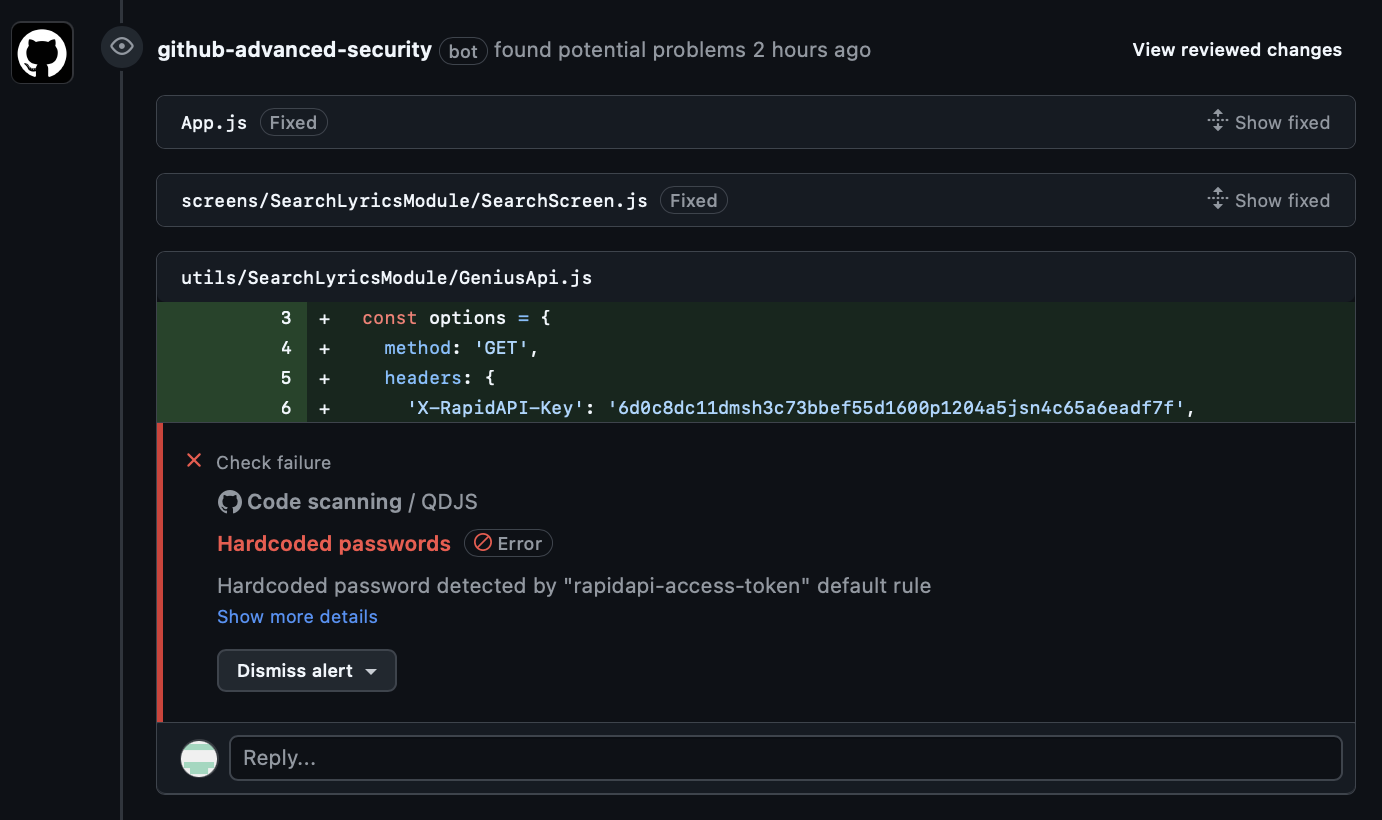
We are one click away from seeing this report in IDE. All that is left is to open the Server-Side Analysis tab again and press the Refresh Report button (make sure you are on the same branch as your pull request). This report will include all the important information about the workflow run, branch, number of issues, their classifications, and severities. And it seems like in the past, I made a serious mistake – I pushed a RAPID API token right into the code. Well, it was almost my first application, after all.
But if you would prefer to view all problems on Github – Qodana can show them to you directly through both annotations and job summaries under workflow runs. That means even contributors who don’t use JetBrains IDEs or don’t have access to your Qodana project can take advantage of Qodana’s first-class analysis reports:
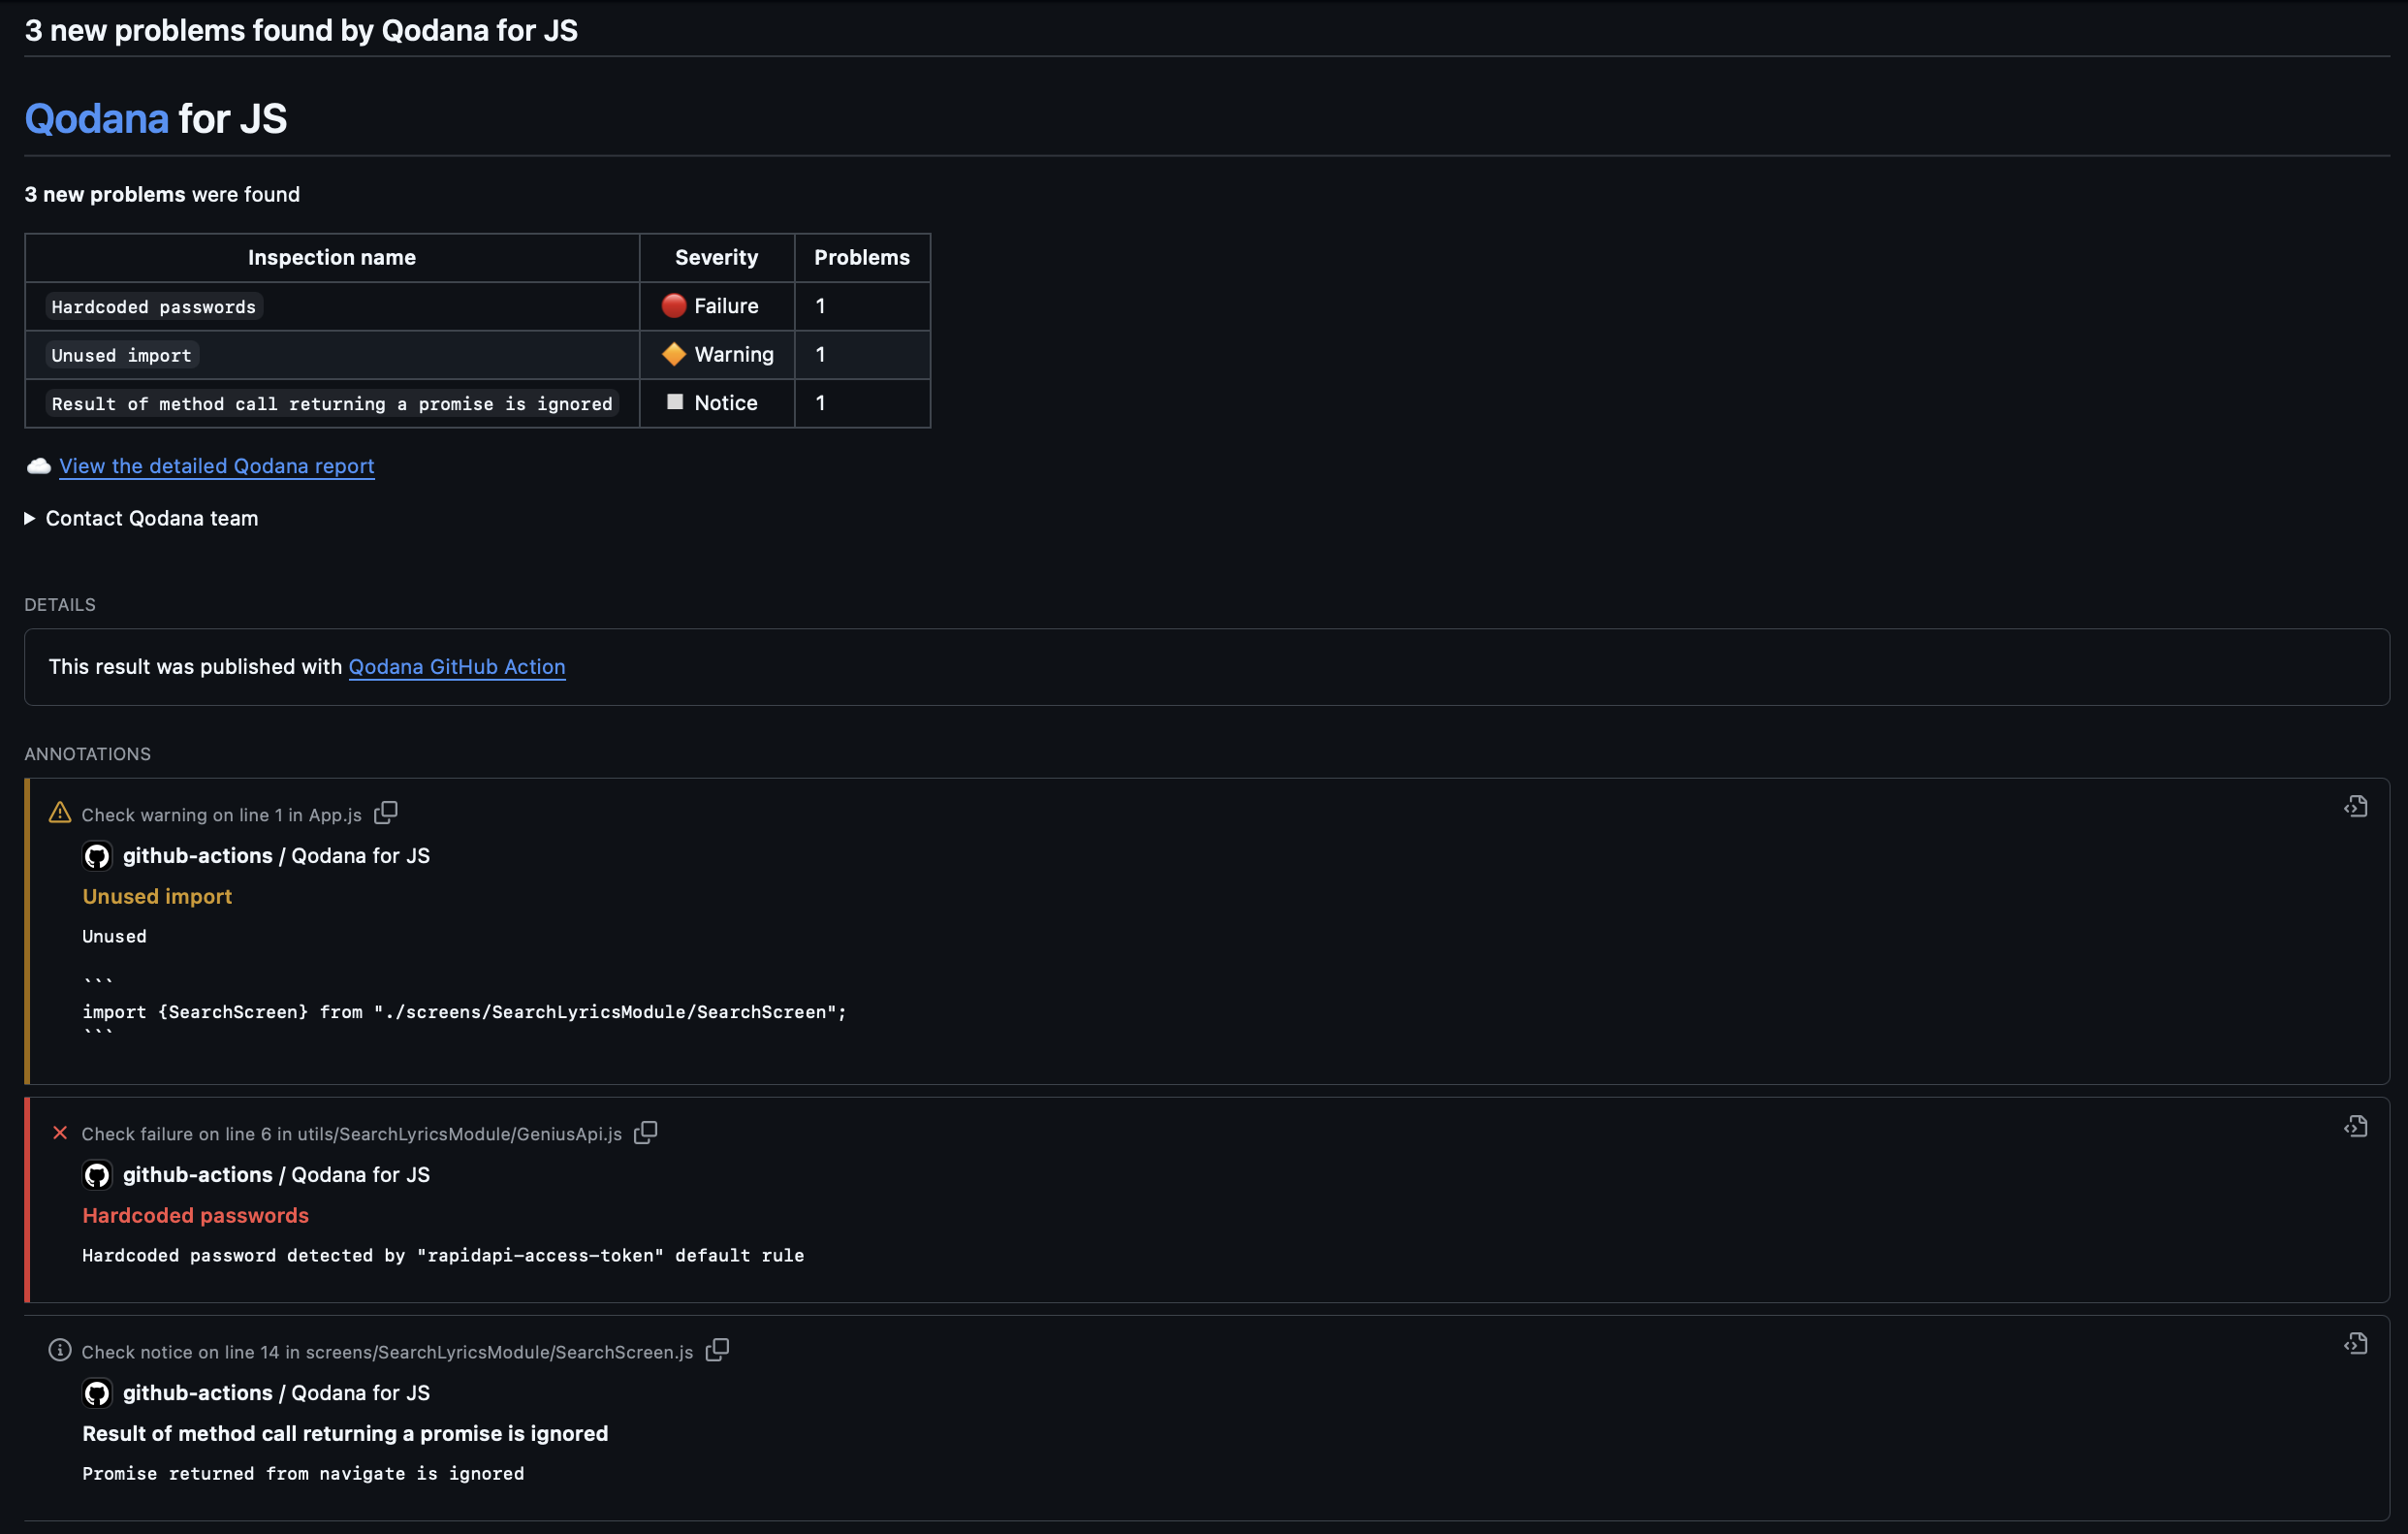
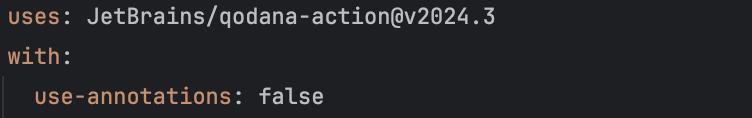
In case you don’t want to see any annotations, you can opt out via the use-annotations property:
In contrast to our demo project, your solution might show significantly more code inspections and problems. This is expected, and you shouldn’t feel discouraged by it. Our goal with Qodana is to help you improve your code quality in an incremental and flexible way, which can be achieved by moving existing problems to the baseline and configuring a fail threshold as a quality gate.
Qodana also supports CodeQL format reporting, which means that you can configure It to include found problems in a Github CodeQL scan. While not all found issues are security concerns, you may want to look into Qodana Taint Analysis results to be on the safe side.
Qodana results in GitHub pull requests
In order to make Qodana work properly with pull requests, you need to set the ref and fetch-depth properties on the checkout action as follows (already pre-configured if you followed the previous steps):
- uses: actions/checkout@v4
	with:
		ref: ${{ github.event.pull_request.head.sha }}
		fetch-depth: 0
Without any additional effort, Qodana can post the results of your analysis on GitHub pull requests. This enables contributors to react quickly to potential bugs and quality degradation. At the same time, it gives repository owners more confidence when it comes to merging pull requests by providing a summary in comments:
This analysis report is updated as more commits are pushed to the branch.
If you prefer not to post any updates on pull requests, you can opt out via the post-pr-comment property:
- name: 'Qodana Scan'
  uses: JetBrains/qodana-action@v2024.3
  with:
    post-pr-comment: false
Uploading Qodana results as artifacts
By default, Qodana will upload analysis results only to Qodana Cloud. Under certain circumstances, you might also want to upload them as artifacts. This could be to update the qodana.sarif.json baseline file by simply downloading and replacing it in your repository or allow contributors to investigate a report directly in their IDE without having to link the project (which is also possible in our Visual Studio Code extension):
In order to opt into uploading the Qodana report as an artifact, you can use the upload-result and artifact-name properties:
- name: 'Qodana Scan'
  uses: JetBrains/qodana-action@v2024.3
  with:
    upload-result: ${{ github.ref_name == 'main' }}
    artifact-name: qodana-report
Adding Quick Fixes in your worflow run
Another powerful feature of Qodana is quick fixes. Jetbrains and the community have developed them for years and you can enable them in your codebase through Qodana. This can be done with any paid linter by adding this configuration to your workflow file:
- name: 'Qodana Scan'
  uses: JetBrains/qodana-action@v2024.3
  with:
    args: --apply-fixes
    push-fixes: 'branch'
With this configuration, after Qodana runs, it will push fixes directly into your branch, without any additional input. If you want to be on the safe side and first review the fixes, then you can change the push-fixes input argument to ‘pull-request‘ and Qodana will open the pull request suggesting fixes in the analyzed branch!
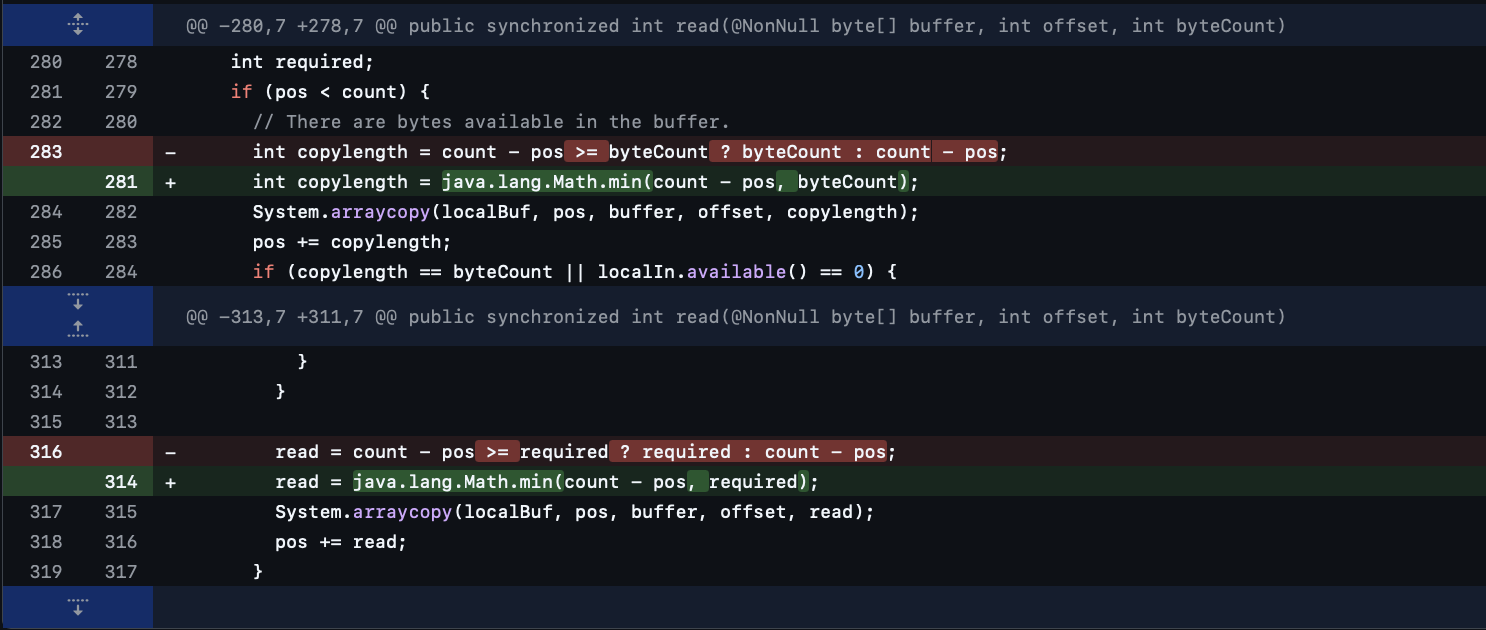
For example, here is how one of the quick-fixes looks after the analysis of Glide – a popular Android library for image loading.
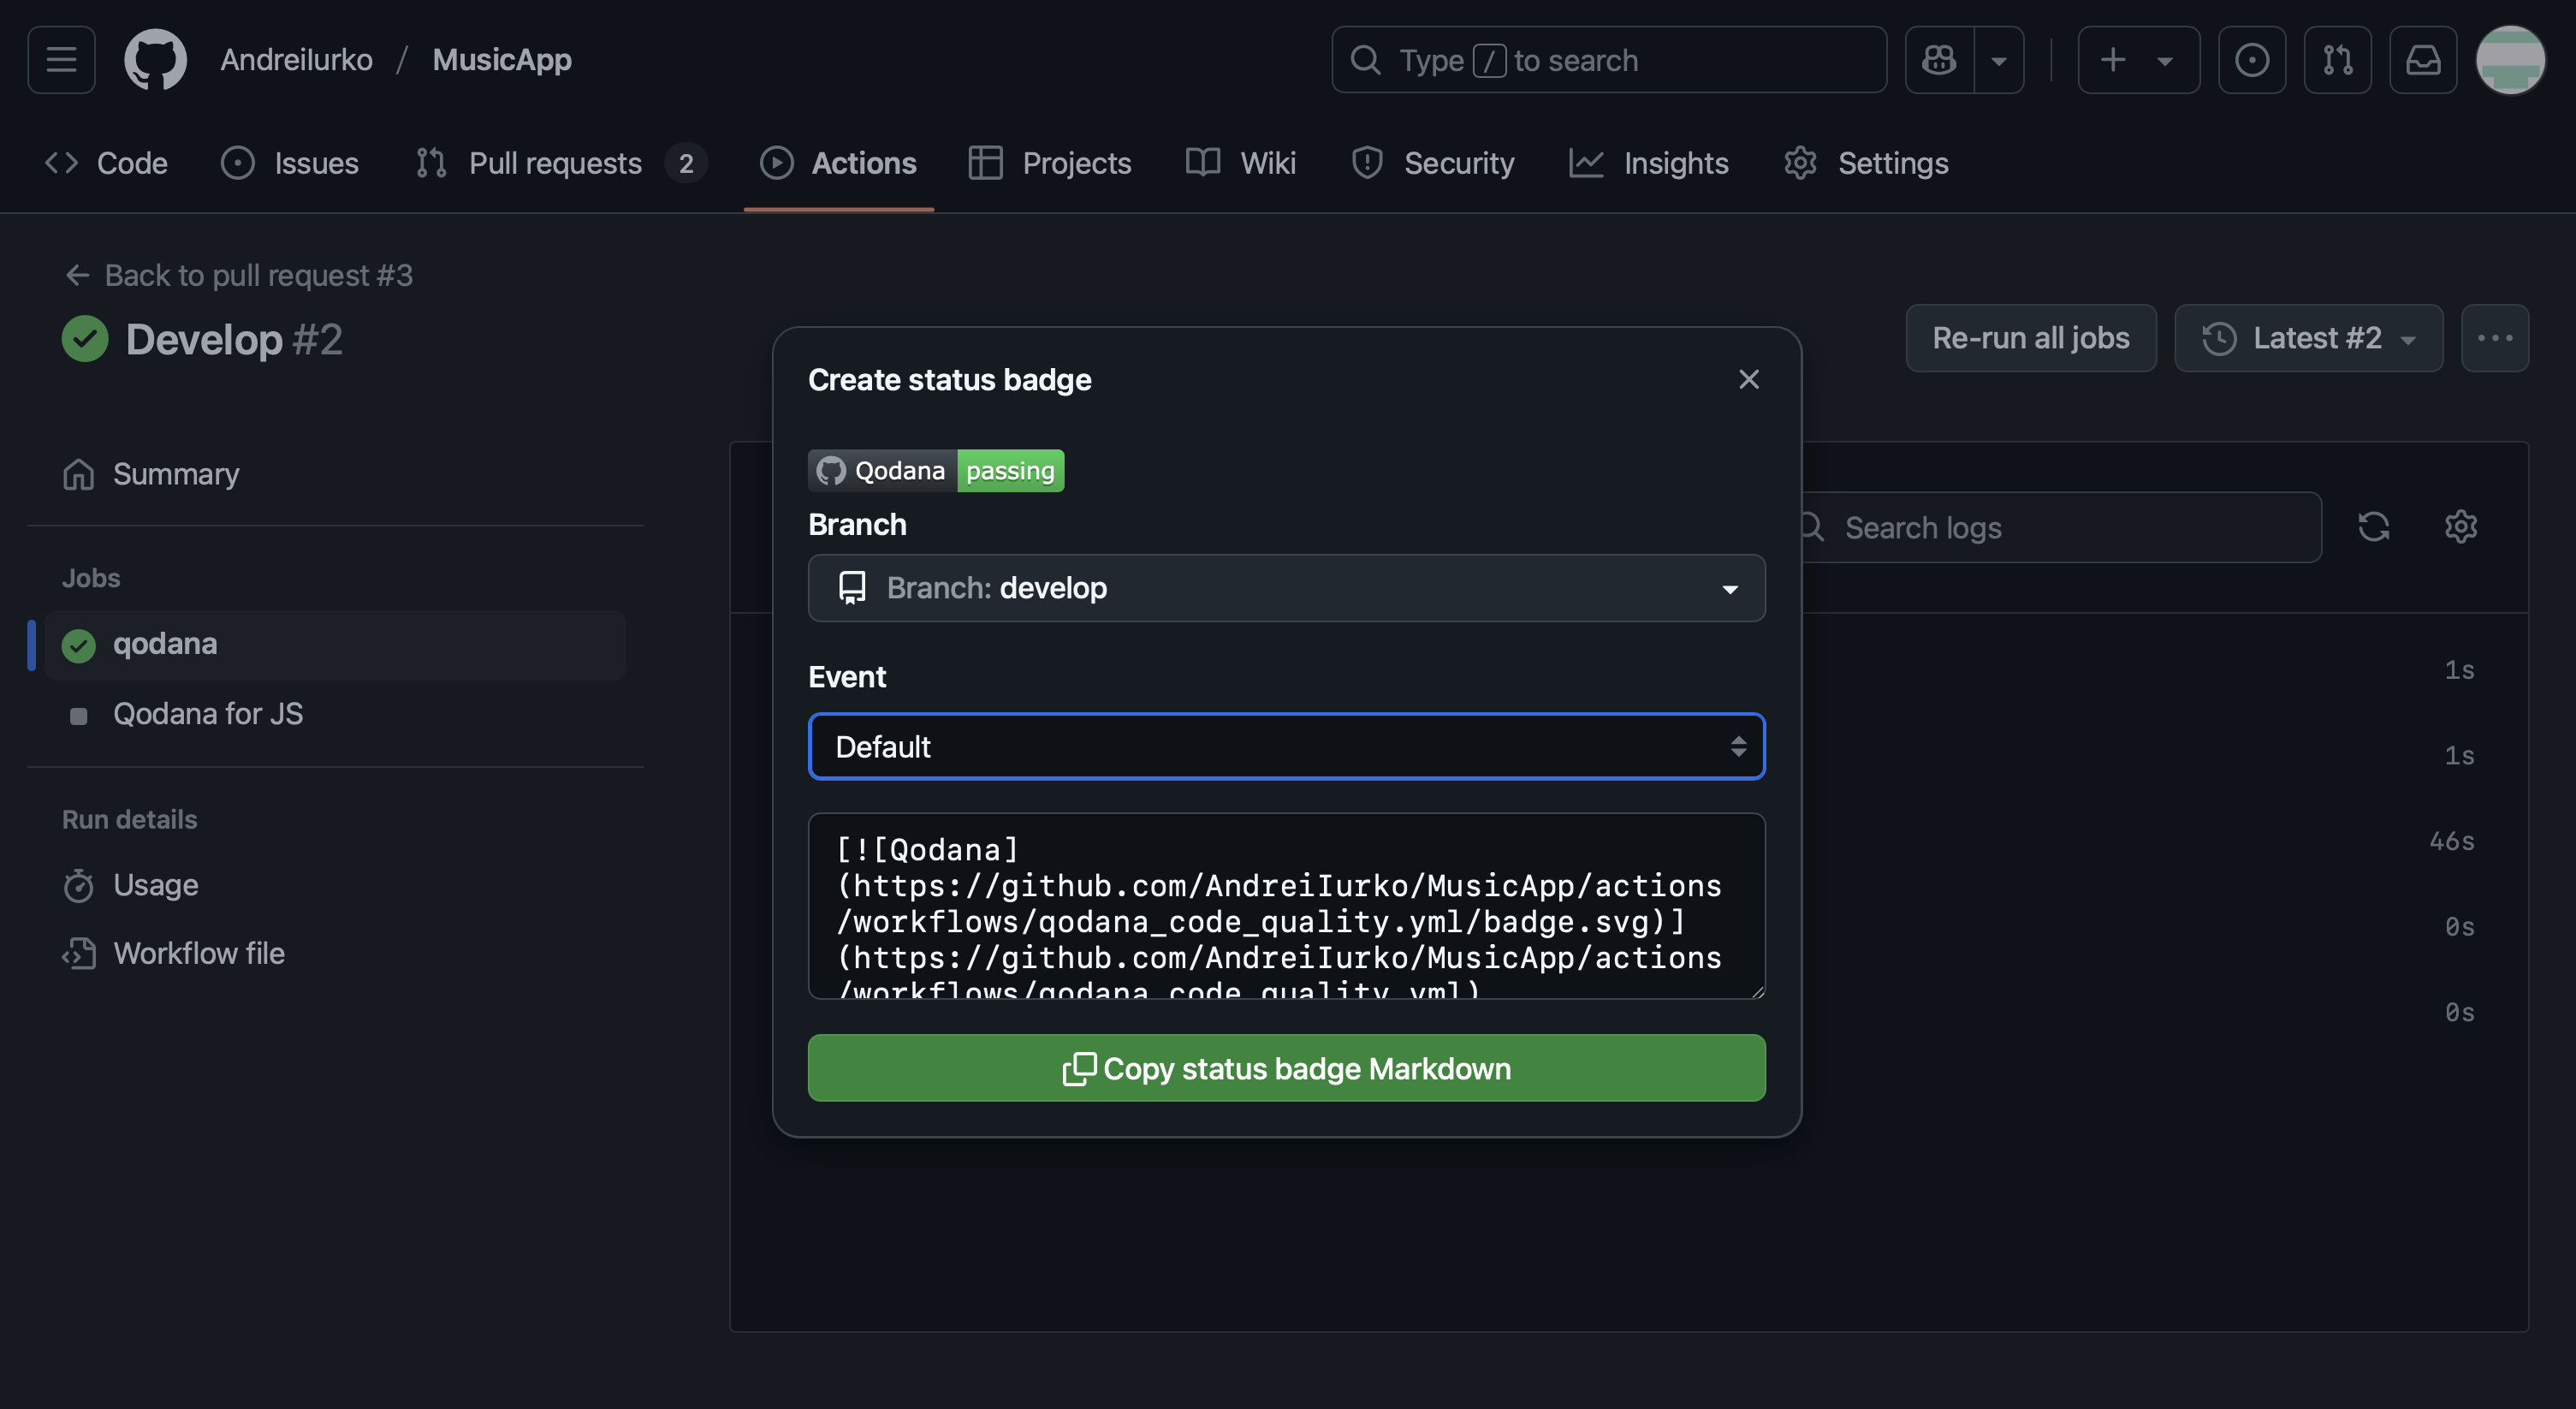
Adding a Qodana status badge
After integrating Qodana into your repository, what could be better than adding a cool badge to show that it’s in good shape? Just head over to one of the workflow runs and grab it from the menu in the upper right-hand corner:
Try Qodana for GitHub
The Qodana team has improved Github integration, allowing maintainers and contributors to react to any issue fast, and improving the code quality and security of the your products. The experience is not limited to JetBrains IDE users – anyone can benefit from issues displayed in the Github UI and reports exported to their Visual Studio Code too. Get Qodana Cloud or Self-Hosted for your team, and give it a try.