


![[The AI Show Episode 143]: ChatGPT Revenue Surge, New AGI Timelines, Amazon’s AI Agent, Claude for Education, Model Context Protocol & LLMs Pass the Turing Test](https://www.marketingaiinstitute.com/hubfs/ep%20143%20cover.png)


![From Accountant to Data Engineer with Alyson La [Podcast #168]](https://cdn.hashnode.com/res/hashnode/image/upload/v1744420903260/fae4b593-d653-41eb-b70b-031591aa2f35.png?#)


.png?#)


![iPadOS 19 Will Be More Like macOS [Gurman]](https://www.iclarified.com/images/news/97001/97001/97001-640.jpg)
![Apple TV+ Summer Preview 2025 [Video]](https://www.iclarified.com/images/news/96999/96999/96999-640.jpg)
![Apple Watch SE 2 On Sale for Just $169.97 [Deal]](https://www.iclarified.com/images/news/96996/96996/96996-640.jpg)


Cracking the Code on Market Indicators: How Analyst AI Simplifies the Most Complex Stats
At Analyst AI, we asked: Why does in-depth market analysis have to be so cumbersome? In this post, we’ll explore why these stats are so important, why compiling them is notoriously hard, and how we built a platform that makes it all look easy. Why These Stats Matter RSI, Moving Averages, and Bollinger Bands RSI (Relative Strength Index) helps gauge whether an asset is overbought or oversold. Moving Average lines smooth out price data to show overall trends. Bollinger Bands give insight into volatility, showing when prices are unusually high or low relative to a moving average. Each of these technical indicators alone can offer powerful signals for entry or exit strategies. But taken together, they paint a fuller picture of momentum, trend strength, and volatility. Growth, Debt Stability, and Profitability EPS Growth Score reveals how fast a company’s earnings are climbing. Debt Stability Score highlights a firm’s leverage and repayment reliability. Profitability Score cuts through revenue hype to show how efficient a company is at generating profits. Without these metrics, you might buy into a company that’s booming in sales but drowning in debt. Having a single, integrated view can be the difference between a successful long-term investment and a costly mistake. Sentiment Indicators Social Media Sentiment picks up on the crowds’ emotional pulse. News Sentiment Score filters out noise from headlines to see if media coverage is bullish or bearish. In the age of viral tweets moving markets, sentiment data isn’t just a “nice-to-have” — it’s game-changing. Risk Metrics Value at Risk Score and Beta Risk Score illustrate just how volatile or stable an investment might be under different conditions. Drawdown Risk Score helps gauge the likelihood of major losses. Ignoring these risk indicators is like driving without brakes. One negative market jolt, and you’re flying off the road with no plan. The Big Headache: Gathering All This Manually Traditionally, an analyst might: Pull RSI and Bollinger Band data from a charting platform. Gather fundamentals like EPS from an earnings database. Skim Twitter, Reddit, news feeds for sentiment manually. Calculate or approximate risk scores using spreadsheets. Not only is this incredibly time-consuming, but it’s also prone to human error. It’s like juggling flaming torches while tightrope-walking: the complexity grows with every new indicator you add. Why it’s difficult to automate: Multiple data sources (technical, fundamental, social) rarely align neatly. Complex computations require advanced math and financial modeling. Real-time updates mean massive data ingestion pipelines that traditional setups can’t handle elegantly. How We Built Analyst AI to Solve It At Analyst AI, we decided enough was enough. Here’s what we did differently: Unified Data Pipeline We pull real-time and historical data from a network of validated sources. No more hopping between fifteen platforms to get the full picture. Advanced AI Agents We use cutting-edge workflows (LangChain, RAG, multi-LLM orchestration) to interpret and calculate these stats in minutes — not hours. Each agent specializes in a particular domain (e.g., sentiment, risk, technical analysis) and then collaborates like a team of analysts. Quantum-Inspired Structuring Instead of analyzing each indicator in isolation, our system processes them simultaneously, cross-referencing signals for deeper insight. It’s like having 20 specialists in a single room, each focusing on one indicator, but constantly sharing feedback with the rest. Instant Visualization Numbers are great, but clarity is king. Our platform automatically visualizes each score and distills them into simple percentage points, letting you see what matters at a glance. Why These Stats Are a Game-Changer Actionable Simplicity Instead of spreadsheets full of raw data, you get a clean dashboard with color-coded metrics. Make faster, more confident decisions. Early Warnings High drawdown risk? Dwindling profitability? Bearish sentiment swelling? Get notified before it’s too late. Cross-Market Intelligence Analyst AI doesn’t just handle stocks — it’s equally at home with crypto, forex, commodities, and more. No need to learn separate tools for each market. Time Savings A process that once took hours of manual legwork now runs in the background, delivering a full report in under 15 minutes. Real-World Example: A Quick Scenario Imagine you want to evaluate a promising new altcoin: RSI & Bollinger: See if it’s overbought after a recent hype cycle. Social Media Sentiment: Check if influencer chatter is still positive or cooling off. Drawdown Risk Score: Evaluate how badly you might get hit if sentiment flips. Fundamental Snapshot: For coins, look at developer activity or ecosystem health (fewer dev commits might signal a dec
At Analyst AI, we asked: Why does in-depth market analysis have to be so cumbersome? In this post, we’ll explore why these stats are so important, why compiling them is notoriously hard, and how we built a platform that makes it all look easy.
Why These Stats Matter
RSI, Moving Averages, and Bollinger Bands
- RSI (Relative Strength Index) helps gauge whether an asset is overbought or oversold.
- Moving Average lines smooth out price data to show overall trends.
- Bollinger Bands give insight into volatility, showing when prices are unusually high or low relative to a moving average.
Each of these technical indicators alone can offer powerful signals for entry or exit strategies. But taken together, they paint a fuller picture of momentum, trend strength, and volatility.
Growth, Debt Stability, and Profitability
- EPS Growth Score reveals how fast a company’s earnings are climbing.
- Debt Stability Score highlights a firm’s leverage and repayment reliability.
- Profitability Score cuts through revenue hype to show how efficient a company is at generating profits.
Without these metrics, you might buy into a company that’s booming in sales but drowning in debt. Having a single, integrated view can be the difference between a successful long-term investment and a costly mistake.
Sentiment Indicators
- Social Media Sentiment picks up on the crowds’ emotional pulse.
- News Sentiment Score filters out noise from headlines to see if media coverage is bullish or bearish.
In the age of viral tweets moving markets, sentiment data isn’t just a “nice-to-have” — it’s game-changing.
Risk Metrics
- Value at Risk Score and Beta Risk Score illustrate just how volatile or stable an investment might be under different conditions.
- Drawdown Risk Score helps gauge the likelihood of major losses.
Ignoring these risk indicators is like driving without brakes. One negative market jolt, and you’re flying off the road with no plan.
The Big Headache: Gathering All This Manually
Traditionally, an analyst might:
- Pull RSI and Bollinger Band data from a charting platform.
- Gather fundamentals like EPS from an earnings database.
- Skim Twitter, Reddit, news feeds for sentiment manually.
- Calculate or approximate risk scores using spreadsheets.
Not only is this incredibly time-consuming, but it’s also prone to human error. It’s like juggling flaming torches while tightrope-walking: the complexity grows with every new indicator you add.
Why it’s difficult to automate:
- Multiple data sources (technical, fundamental, social) rarely align neatly.
- Complex computations require advanced math and financial modeling.
- Real-time updates mean massive data ingestion pipelines that traditional setups can’t handle elegantly.
How We Built Analyst AI to Solve It
At Analyst AI, we decided enough was enough. Here’s what we did differently:
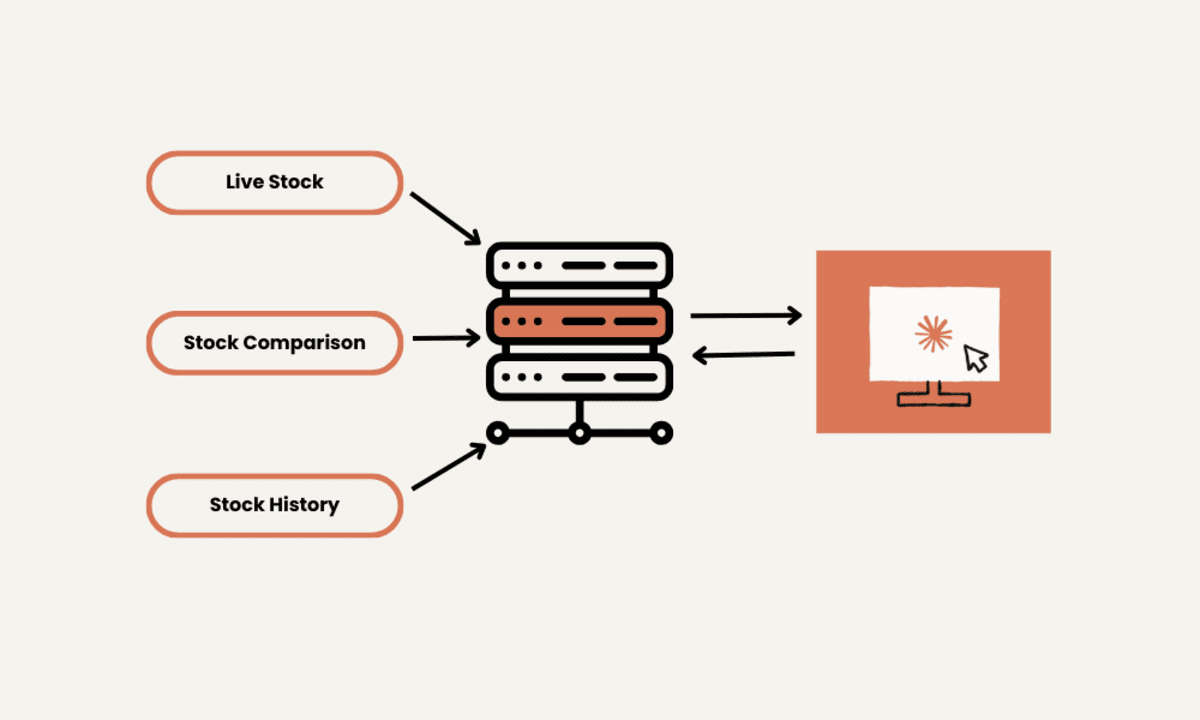
Unified Data Pipeline
We pull real-time and historical data from a network of validated sources. No more hopping between fifteen platforms to get the full picture.Advanced AI Agents
We use cutting-edge workflows (LangChain, RAG, multi-LLM orchestration) to interpret and calculate these stats in minutes — not hours. Each agent specializes in a particular domain (e.g., sentiment, risk, technical analysis) and then collaborates like a team of analysts.Quantum-Inspired Structuring
Instead of analyzing each indicator in isolation, our system processes them simultaneously, cross-referencing signals for deeper insight. It’s like having 20 specialists in a single room, each focusing on one indicator, but constantly sharing feedback with the rest.Instant Visualization
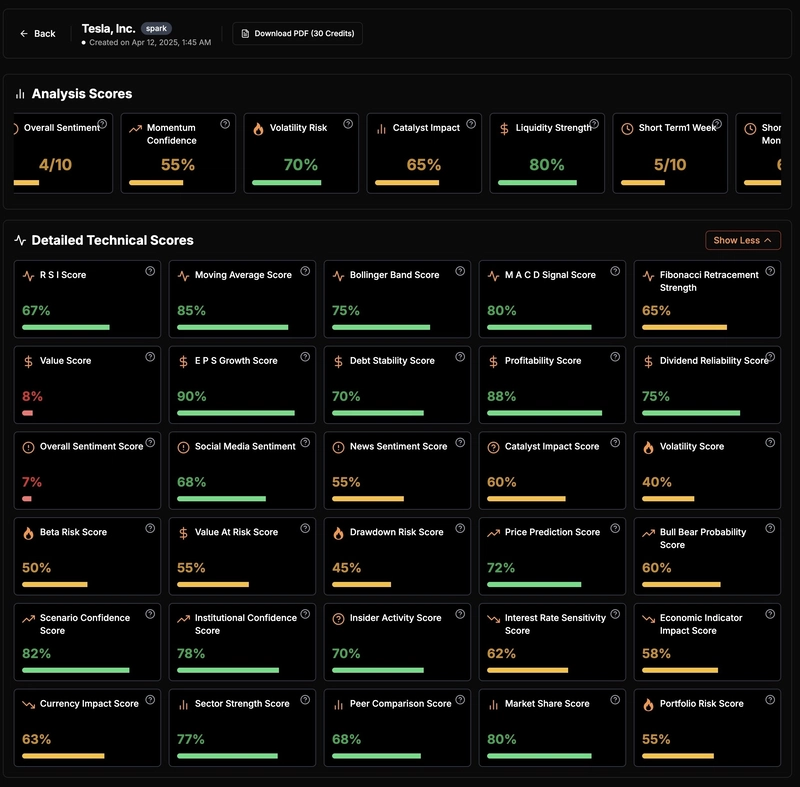
Numbers are great, but clarity is king. Our platform automatically visualizes each score and distills them into simple percentage points, letting you see what matters at a glance.
Why These Stats Are a Game-Changer
Actionable Simplicity
Instead of spreadsheets full of raw data, you get a clean dashboard with color-coded metrics. Make faster, more confident decisions.Early Warnings
High drawdown risk? Dwindling profitability? Bearish sentiment swelling? Get notified before it’s too late.Cross-Market Intelligence
Analyst AI doesn’t just handle stocks — it’s equally at home with crypto, forex, commodities, and more. No need to learn separate tools for each market.Time Savings
A process that once took hours of manual legwork now runs in the background, delivering a full report in under 15 minutes.
Real-World Example: A Quick Scenario
Imagine you want to evaluate a promising new altcoin:
- RSI & Bollinger: See if it’s overbought after a recent hype cycle.
- Social Media Sentiment: Check if influencer chatter is still positive or cooling off.
- Drawdown Risk Score: Evaluate how badly you might get hit if sentiment flips.
- Fundamental Snapshot: For coins, look at developer activity or ecosystem health (fewer dev commits might signal a decline).
Analyst AI automatically compiles all this data into a single view. You get the story behind the numbers plus an overall summary — all without rummaging through 10 separate sites.
Conclusion: Better Stats, Better Decisions
When you have the right metrics in front of you — at the right time — you stop making decisions based on guesswork. This is the power of truly integrated research.
Analyst AI was built to give every investor, trader, and curious mind an instant gateway into deep, actionable market intelligence. So if you’re tired of scattered data and guesswork, take a peek at what we’ve built.
Ready to Level Up Your Analysis?
Generate your next all-in-one research report in minutes.
No confusion, no cross-tabs, just clarity.