


![[The AI Show Episode 143]: ChatGPT Revenue Surge, New AGI Timelines, Amazon’s AI Agent, Claude for Education, Model Context Protocol & LLMs Pass the Turing Test](https://www.marketingaiinstitute.com/hubfs/ep%20143%20cover.png)


![From Accountant to Data Engineer with Alyson La [Podcast #168]](https://cdn.hashnode.com/res/hashnode/image/upload/v1744420903260/fae4b593-d653-41eb-b70b-031591aa2f35.png?#)


.png?#)


.png?width=1920&height=1920&fit=bounds&quality=70&format=jpg&auto=webp#)


![Apple Posts Full First Episode of 'Your Friends & Neighbors' on YouTube [Video]](https://www.iclarified.com/images/news/96990/96990/96990-640.jpg)

![Apple May Implement Global iPhone Price Increases to Mitigate Tariff Impacts [Report]](https://www.iclarified.com/images/news/96987/96987/96987-640.jpg)
![Apple Aims to Launch Revamped Siri This Fall After AI Setbacks [Report]](https://www.iclarified.com/images/news/96984/96984/96984-640.jpg)


Java Memory Leaks: What Causes Them and How to Avoid Them
Memory leaks in Java aren’t always loud or obvious. Sometimes, they creep in quietly - through static fields, forgotten listeners, or subtle misuse of common classes. These leaks don’t crash your app right away, but they slowly degrade performance, increase memory usage, and lead to unexpected OOM errors in long-running systems. In this post, we’ll look at some lesser-known but real-world Java memory leak patterns with clean fixes you can apply right away. 1. Using ThreadLocal without removing In thread pools (e.g., servlet containers), threads live long. If we don't remove the value, it stays in memory forever, even if it's not used again Fix: .remove() clears the reference tied to the thread, allowing GC to collect the HeavyObject instance after it's used - avoiding memory bloat in long-lived threads. 2. Static Collections Holding Data Static map never dies = entries stick around forever = slow memory leak as data piles up. Solution: Using a proper caching library (like Caffeine) introduces eviction + TTL, meaning old or unused entries are automatically removed, keeping memory usage in check. 3. Anonymous Inner Classes Holding Outer Class References Inner classes implicitly hold a reference to the outer class. If the task lives long, it prevents the outer class from being GC'ed - even if the user navigated away. Non-static inner classes hold an implicit reference to their outer class. If they outlive the outer class, they can cause a memory leak. Fix: Use static inner classes or separate classes. A static inner class does not hold an implicit reference to an instance of the outer class. This decoupling ensures that the lifecycle of the inner class is not tied to the outer class, preventing potential memory leaks. when the outer object is unused, it’s freed correctly by the GC. 4. Listeners Not Removed You added a listener but never removed it. So even if the object that registered it is no longer needed, it stays alive because the button holds it. Fix: Explicitly removing the listener breaks the reference chain, allowing both the listener and possibly its enclosing object to be garbage collected. 5. Holding Strong References to ClassLoaders private static final List loaders = new ArrayList(); In plugin/reloadable apps, classloaders should be GC'ed after unload. But strong references keep them in memory, causing class metadata and heap leaks. Fix: Weak references don’t prevent GC, so once a classloader is unused, it’s eligible for cleanup. You avoid both heap and Metaspace bloat. List loaders = new ArrayList(); 6. Unbounded Executor Queues The default LinkedBlockingQueue used by Executors.newFixedThreadPool() is unbounded. Submitting millions of tasks causes the queue to grow indefinitely, consuming heap. Fix: Use a custom ThreadPoolExecutor with a bounded queue: The queue has a size cap, preventing runaway heap usage. CallerRunsPolicy throttles the caller instead of leaking memory. 7. JDBC Connections Not Closed Properly If the connection isn’t closed, it stays alive, leading to connection leaks and memory/resource exhaustion. Connection conn = dataSource.getConnection(); // do stuff Fix: try (Connection conn = dataSource.getConnection()) { // use it } The try-with-resources block ensures the connection is always closed, even if an exception occurs - preventing resource + memory leaks. 8. Keeping Long References in Logging Context (like MDC) MDC uses ThreadLocal internally. If you don’t clear the context, that data lives on in the thread - leaking memory across requests in thread pools. Fix: .clear() removes all MDC values tied to the thread, letting memory get released cleanly after request completion. Most memory leaks in Java happen not because of complex code, but because of overlooked patterns in everyday usage. Catch these early, and your app stays healthy. Miss them, and they quietly eat your memory. If you found these helpful, drop a follow or share — and let me know if you’ve seen any sneaky leaks in the wild. For more coding related content subscribe to my newsletter and twitter
Memory leaks in Java aren’t always loud or obvious. Sometimes, they creep in quietly - through static fields, forgotten listeners, or subtle misuse of common classes. These leaks don’t crash your app right away, but they slowly degrade performance, increase memory usage, and lead to unexpected OOM errors in long-running systems.
In this post, we’ll look at some lesser-known but real-world Java memory leak patterns with clean fixes you can apply right away.
1. Using ThreadLocal without removing
In thread pools (e.g., servlet containers), threads live long. If we don't remove the value, it stays in memory forever, even if it's not used again
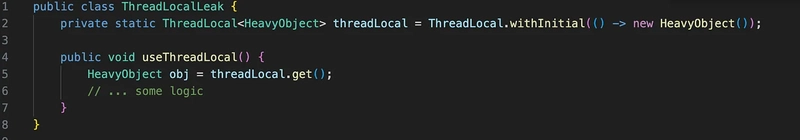
Fix:
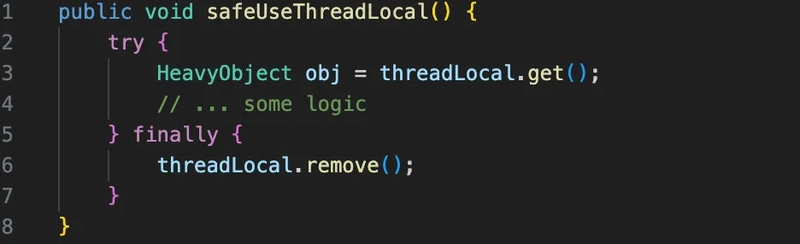
.remove() clears the reference tied to the thread, allowing GC to collect the HeavyObject instance after it's used - avoiding memory bloat in long-lived threads.
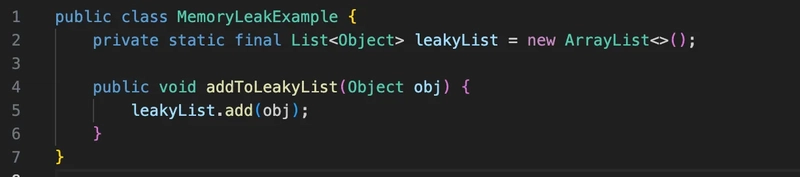
2. Static Collections Holding Data
Static map never dies = entries stick around forever = slow memory leak as data piles up.
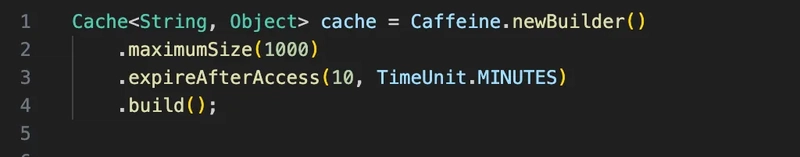
Solution: Using a proper caching library (like Caffeine) introduces eviction + TTL, meaning old or unused entries are automatically removed, keeping memory usage in check.
3. Anonymous Inner Classes Holding Outer Class References
Inner classes implicitly hold a reference to the outer class. If the task lives long, it prevents the outer class from being GC'ed - even if the user navigated away.

Non-static inner classes hold an implicit reference to their outer class. If they outlive the outer class, they can cause a memory leak.
Fix: Use static inner classes or separate classes. A static inner class does not hold an implicit reference to an instance of the outer class. This decoupling ensures that the lifecycle of the inner class is not tied to the outer class, preventing potential memory leaks.
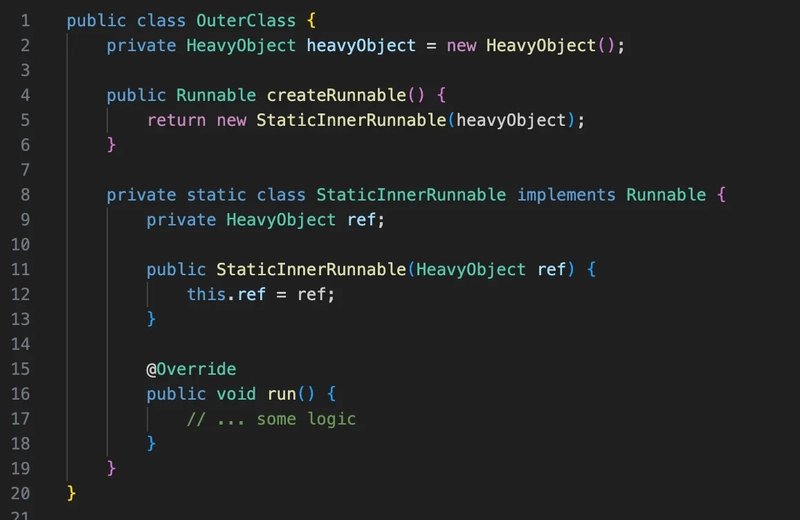
when the outer object is unused, it’s freed correctly by the GC.
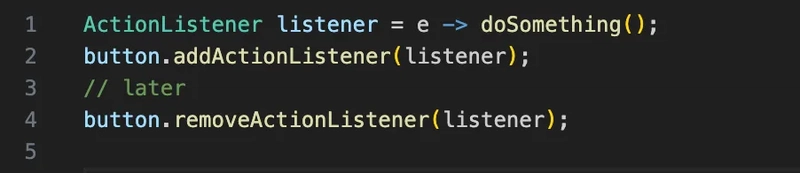
4. Listeners Not Removed
You added a listener but never removed it. So even if the object that registered it is no longer needed, it stays alive because the button holds it.
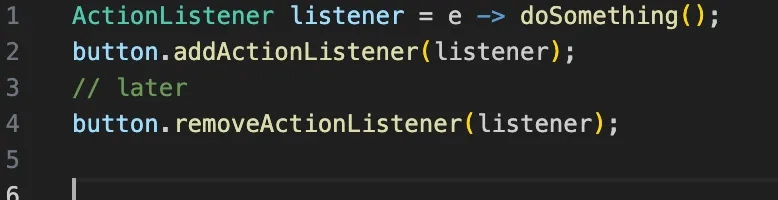
Fix: Explicitly removing the listener breaks the reference chain, allowing both the listener and possibly its enclosing object to be garbage collected.
5. Holding Strong References to ClassLoaders
private static final List loaders = new ArrayList<>();
In plugin/reloadable apps, classloaders should be GC'ed after unload. But strong references keep them in memory, causing class metadata and heap leaks.
Fix:
Weak references don’t prevent GC, so once a classloader is unused, it’s eligible for cleanup. You avoid both heap and Metaspace bloat.
List> loaders = new ArrayList<>();
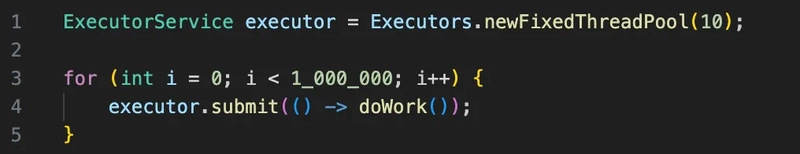
6. Unbounded Executor Queues
The default LinkedBlockingQueue used by Executors.newFixedThreadPool() is unbounded. Submitting millions of tasks causes the queue to grow indefinitely, consuming heap.
Fix: Use a custom ThreadPoolExecutor with a bounded queue:
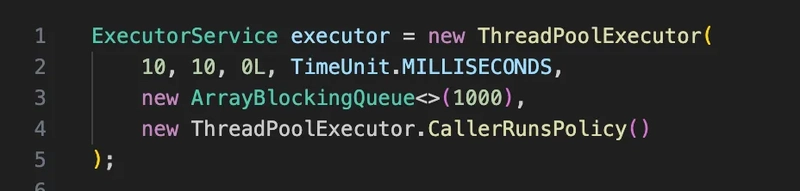
The queue has a size cap, preventing runaway heap usage. CallerRunsPolicy throttles the caller instead of leaking memory.
7. JDBC Connections Not Closed Properly
If the connection isn’t closed, it stays alive, leading to connection leaks and memory/resource exhaustion.
Connection conn = dataSource.getConnection();
// do stuff
Fix:
try (Connection conn = dataSource.getConnection()) {
    // use it
}
The try-with-resources block ensures the connection is always closed, even if an exception occurs - preventing resource + memory leaks.
8. Keeping Long References in Logging Context (like MDC)
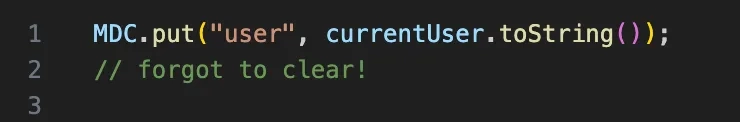
MDC uses ThreadLocal internally. If you don’t clear the context, that data lives on in the thread - leaking memory across requests in thread pools.
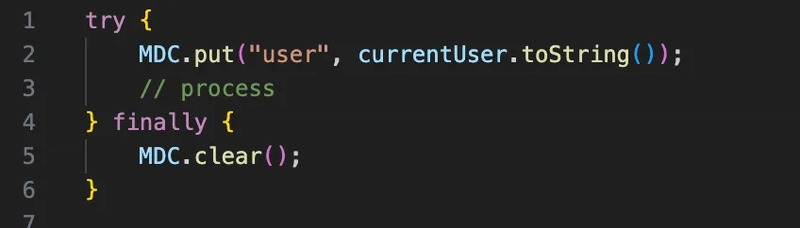
Fix:
.clear() removes all MDC values tied to the thread, letting memory get released cleanly after request completion.
Most memory leaks in Java happen not because of complex code, but because of overlooked patterns in everyday usage.
Catch these early, and your app stays healthy. Miss them, and they quietly eat your memory.
If you found these helpful, drop a follow or share — and let me know if you’ve seen any sneaky leaks in the wild.
For more coding related content subscribe to my newsletter and twitter