


![[The AI Show Episode 143]: ChatGPT Revenue Surge, New AGI Timelines, Amazon’s AI Agent, Claude for Education, Model Context Protocol & LLMs Pass the Turing Test](https://www.marketingaiinstitute.com/hubfs/ep%20143%20cover.png)


.png?#)


.webp?#)
.webp?#)

.webp?#)


![[Fixed] Gemini app is failing to generate Audio Overviews](https://i0.wp.com/9to5google.com/wp-content/uploads/sites/4/2025/03/Gemini-Audio-Overview-cover.jpg?resize=1200%2C628&quality=82&strip=all&ssl=1)

![What’s new in Android’s April 2025 Google System Updates [U: 4/14]](https://i0.wp.com/9to5google.com/wp-content/uploads/sites/4/2025/01/google-play-services-3.jpg?resize=1200%2C628&quality=82&strip=all&ssl=1)


![Apple Seeds tvOS 18.5 Beta 2 to Developers [Download]](https://www.iclarified.com/images/news/97011/97011/97011-640.jpg)
![Apple Releases macOS Sequoia 15.5 Beta 2 to Developers [Download]](https://www.iclarified.com/images/news/97014/97014/97014-640.jpg)


A Beginner's Guide to Auto-Instrumenting a Flask App with OpenTelemetry and SigNoz
Understanding what your code is doing — really doing — isn’t a nice-to-have. It’s essential. That’s where observability comes in. In this hands-on tutorial, you’ll learn how to instrument a simple Python Flask app using OpenTelemetry and send that data to SigNoz, an open-source observability platform. Step by step, we’ll walk through everything you need to get visibility into your application. By the end, you’ll know how to: Enable auto-instrumentation Add custom spans Track custom metrics Capture logs Correlate logs with traces What Is OpenTelemetry and Why Use It? OpenTelemetry is an open-source framework that helps you collect data about your application's performance and behavior. It gathers three types of telemetry data: traces, metrics, and logs. The data together provide a complete picture of how your app is working. For beginners, OpenTelemetry is valuable because it simplifies monitoring without requiring deep expertise, and it works with many tools, like SigNoz, to display the data. Understanding Telemetry Data: Traces, Metrics, and Logs Telemetry data is the information your app produces to show what it's doing: Traces track the journey of a request through your app Metrics measure things like how many requests happen Logs record specific events or messages. Together, they help you spot problems, measure performance, and debug issues. What Is SigNoz and How Does It Fit In? SigNoz is an open-source tool that takes the telemetry data from OpenTelemetry and turns it into easy-to-read charts and dashboards. It's designed to work seamlessly with OpenTelemetry, making it perfect for anyone who wants to see their app's data without complex setup. SigNoz will be our window into the Flask app's performance in this tutorial. Setting Up the Environment Before we start instrumenting our Flask app, we need to prepare our system with the right tools. This section walks you through: Installing Python Creating a virtual environment to manage packages safely Setting up SigNoz locally Following the steps, you'll have a clean workspace ready for OpenTelemetry. Installing Python and Creating a Virtual Environment We'll use Python and Flask, a simple web framework, for our app. First, ensure that Python 3.8 or newer is installed by running python3 --version on your terminal. If Python is not installed, download it from python.org or use your system's package manager (e.g., sudo apt install python3 on Ubuntu). Verify that pip is available with the pip3 --version; if not, install it with sudo apt install python3-pip. We'll create a virtual environment to avoid conflicts with your system's Python. This self-contained Python setup lets you install packages without affecting the rest of your system. Run these commands in your terminal: python3 -m venv otel-venv source otel-venv/bin/activate After running source otel-venv/bin/activate, your terminal prompt should change (e.g., (otel-venv)), indicating you're in the virtual environment. Now, any packages you install with pip will stay isolated here. If you ever need to exit the virtual environment, type deactivate. Setting Up SigNoz Locally SigNoz will collect and display our telemetry data, and we'll run it using Docker. Open a terminal and run these commands to set up SigNoz: git clone -b main https://github.com/SigNoz/signoz.git cd signoz/deploy/ ./install.sh This downloads SigNoz and starts it. Once finished, SigNoz will be accessible at http://localhost:8080 : You've now set up the backend to receive data from our app. Creating a Simple Flask Application Let's build a basic Flask app to instrument. Create a file called app.py and add this code: from flask import Flask app = Flask(__name__) @app.route('/') def home(): return "Welcome to the Flask App!" @app.route('/task') def task(): return "Task completed!" if __name__ == "__main__": app.run(host='0.0.0.0', port=5000) This app has two endpoints: one to greet users (http://localhost:5000) and another to simulate a task (http://localhost:5000/task). This gives us something simple yet practical to monitor. Auto-Instrumenting the Flask App with OpenTelemetry Auto-instrumentation lets OpenTelemetry automatically track your app's activity without changing much code. It's a beginner-friendly way to monitor and capture data like request times and errors. Installing OpenTelemetry Packages With your virtual environment active (run source otel-venv/bin/activate if it's not), install the necessary OpenTelemetry packages. In your terminal, run: pip install opentelemetry-distro \ opentelemetry-exporter-otlp \ flask \ opentelemetry-instrumentation-flask \ opentelemetry-instrumentation-logging Then run: opentelemetry-bootstrap --action=install opentelemetry-distro: Provides auto-instrumentation for Python apps. opentelemetry-exporter-otlp:
Understanding what your code is doing — really doing — isn’t a nice-to-have. It’s essential. That’s where observability comes in.
In this hands-on tutorial, you’ll learn how to instrument a simple Python Flask app using OpenTelemetry and send that data to SigNoz, an open-source observability platform. Step by step, we’ll walk through everything you need to get visibility into your application.
By the end, you’ll know how to:
- Enable auto-instrumentation
- Add custom spans
- Track custom metrics
- Capture logs
- Correlate logs with traces
What Is OpenTelemetry and Why Use It?
OpenTelemetry is an open-source framework that helps you collect data about your application's performance and behavior. It gathers three types of telemetry data: traces, metrics, and logs. The data together provide a complete picture of how your app is working.
For beginners, OpenTelemetry is valuable because it simplifies monitoring without requiring deep expertise, and it works with many tools, like SigNoz, to display the data.
Understanding Telemetry Data: Traces, Metrics, and Logs
Telemetry data is the information your app produces to show what it's doing:
- Traces track the journey of a request through your app
- Metrics measure things like how many requests happen
- Logs record specific events or messages.
Together, they help you spot problems, measure performance, and debug issues.
What Is SigNoz and How Does It Fit In?
SigNoz is an open-source tool that takes the telemetry data from OpenTelemetry and turns it into easy-to-read charts and dashboards. It's designed to work seamlessly with OpenTelemetry, making it perfect for anyone who wants to see their app's data without complex setup. SigNoz will be our window into the Flask app's performance in this tutorial.
Setting Up the Environment
Before we start instrumenting our Flask app, we need to prepare our system with the right tools. This section walks you through:
- Installing Python
- Creating a virtual environment to manage packages safely
- Setting up SigNoz locally
Following the steps, you'll have a clean workspace ready for OpenTelemetry.
Installing Python and Creating a Virtual Environment
We'll use Python and Flask, a simple web framework, for our app. First, ensure that Python 3.8 or newer is installed by running python3 --version on your terminal.
If Python is not installed, download it from python.org or use your system's package manager (e.g., sudo apt install python3 on Ubuntu).
Verify that pip is available with the pip3 --version; if not, install it with sudo apt install python3-pip.
We'll create a virtual environment to avoid conflicts with your system's Python. This self-contained Python setup lets you install packages without affecting the rest of your system.
Run these commands in your terminal:
python3 -m venv otel-venv
source otel-venv/bin/activate
After running source otel-venv/bin/activate, your terminal prompt should change (e.g., (otel-venv)), indicating you're in the virtual environment. Now, any packages you install with pip will stay isolated here.
If you ever need to exit the virtual environment, type deactivate.
Setting Up SigNoz Locally
SigNoz will collect and display our telemetry data, and we'll run it using Docker. Open a terminal and run these commands to set up SigNoz:
git clone -b main https://github.com/SigNoz/signoz.git
cd signoz/deploy/
./install.sh
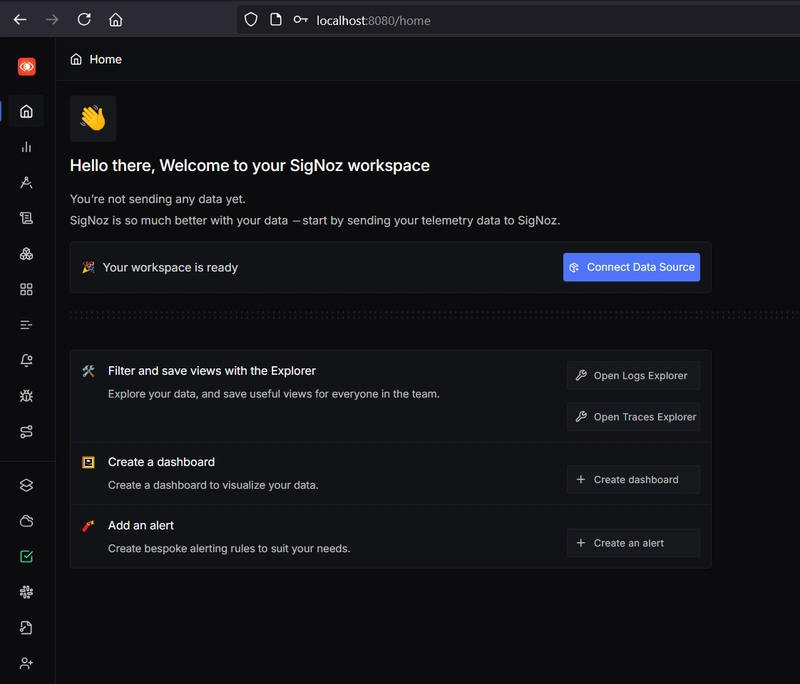
This downloads SigNoz and starts it. Once finished, SigNoz will be accessible at http://localhost:8080 :
You've now set up the backend to receive data from our app.
Creating a Simple Flask Application
Let's build a basic Flask app to instrument. Create a file called app.py and add this code:
from flask import Flask

app = Flask(__name__)

@app.route('/')
def home():
    return "Welcome to the Flask App!"

@app.route('/task')
def task():
    return "Task completed!"

if __name__ == "__main__":
    app.run(host='0.0.0.0', port=5000)
This app has two endpoints: one to greet users (http://localhost:5000) and another to simulate a task (http://localhost:5000/task). This gives us something simple yet practical to monitor.
Auto-Instrumenting the Flask App with OpenTelemetry
Auto-instrumentation lets OpenTelemetry automatically track your app's activity without changing much code. It's a beginner-friendly way to monitor and capture data like request times and errors.
Installing OpenTelemetry Packages
With your virtual environment active (run source otel-venv/bin/activate if it's not), install the necessary OpenTelemetry packages.
In your terminal, run:
pip install opentelemetry-distro \
opentelemetry-exporter-otlp \
flask \
opentelemetry-instrumentation-flask \
opentelemetry-instrumentation-logging
Then run:
opentelemetry-bootstrap --action=install
-
opentelemetry-distro: Provides auto-instrumentation for Python apps. -
opentelemetry-exporter-otlp: Sends data to SigNoz using the OTLP protocol. -
flask: Ensures Flask is installed for our app. -
opentelemetry-instrumentation-flask: Instruments Flask applications to automatically capture traces. -
opentelemetry-instrumentation-logging: Hooks into Python's built-in logging module to enrich log messages with trace and span context. -
opentelemetry-bootstrap --action=install: Automatically installs required dependencies for OpenTelemetry instrumentation based on detected libraries in your environment.
Configuring Auto-Instrumentation
We'll use a command that wraps our app with OpenTelemetry to enable auto-instrumentation. Update your terminal command to run the app like this:
opentelemetry-instrument --traces_exporter otlp --metrics_exporter otlp --logs_exporter otlp --service_name flask-app python3 app.py
This command tells OpenTelemetry to:
- Collect traces, metrics, and logs
- Send them to SigNoz (running locally at
localhost:4317by default). - Name our service
flask-appfor easy identification in SigNoz.
You've now auto-instrumented the app, and it's ready to send basic telemetry data to SigNoz.
Viewing Auto-Instrumented Traces
Hit http://localhost:5000 and http://localhost:5000/task a few times to generate data. In SigNoz, go to the “Traces” tab. You'll see traces for requests to / and /task, showing timing and endpoints automatically captured by OpenTelemetry:
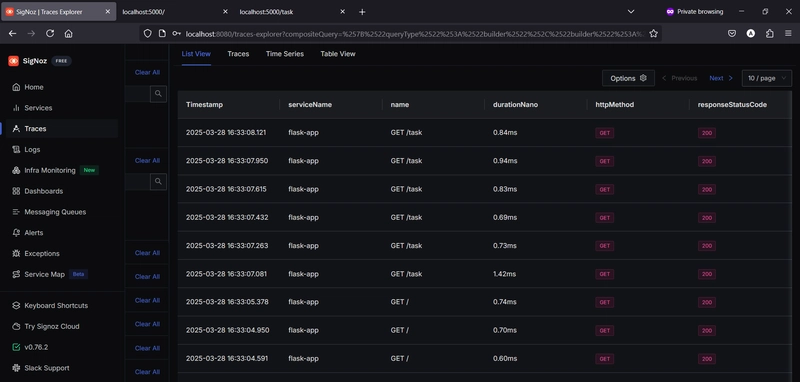
This shows how requests flow through your app.
Adding Custom Spans for Detailed Tracing
Auto-instrumentation is great, but custom spans let you track specific parts of your code, like a slow task. A span is a single unit of work in a trace, giving you detailed timing info.
Modifying the App to Include Custom Spans
Update app.py to add a custom span for the /task endpoint:
from flask import Flask
from opentelemetry import trace

app = Flask(__name__)
tracer = trace.get_tracer(__name__)

@app.route('/')
def home():
    return "Welcome to the Flask App!"

@app.route('/task')
def task():
    with tracer.start_as_current_span("process-task"):
        return "Task completed!"

if __name__ == "__main__":
    app.run(host='0.0.0.0', port=5000)
Here, tracer.start_as_current_span("process-task") creates a custom span around the task logic. Rerun the app with the same opentelemetry-instrument command we used above and generate data.
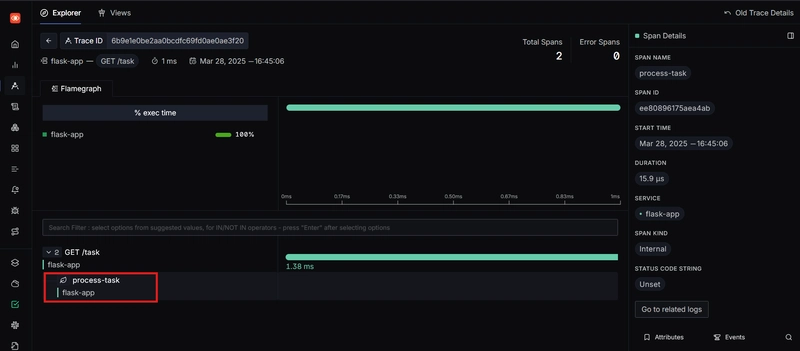
Analysing Custom Spans
In the same “Traces” tab, click a /task trace to see the “process-task” span with its duration:
Sending Custom Metrics to Track Performance
Metrics measure things over time, like how many requests your app handles. Custom metrics let you track what matters to you, beyond what auto-instrumentation provides.
Implementing Custom Metrics in the App
Add a custom metric to count requests to the /task endpoint. Update app.py:
from flask import Flask
from opentelemetry import trace, metrics

app = Flask(__name__)
tracer = trace.get_tracer(__name__)
meter = metrics.get_meter(__name__)
task_counter = meter.create_counter("task_requests", description="Number of task requests")

@app.route('/')
def home():
    return "Welcome to the Flask App!"

@app.route('/task')
def task():
    with tracer.start_as_current_span("process-task"):
        task_counter.add(1)
        return "Task completed!"

if __name__ == "__main__":
    app.run(host='0.0.0.0', port=5000)
The task_counter metric increments each time /task is called.
Rerun the app using the same auto instrument code we used above and generate new data.
Viewing custom metrics on Signoz
On Signoz, follow these steps to create a dashboard with the custom metric:
- Click “Dashboards” in the navigation
- Create a new dashboard
- Click “+ New Panel.”
- Choose “Time Series” as the Panel Type.
- In the Query Builder,
- select
task_requestsfrom the Metrics dropdown. - Set Aggregation to “Increase” (for counters).
- Save the panel and dashboard (e.g., name it “Flask Metrics”).
- select

Capturing Logs and Correlating with Traces
Logs are messages your app produces, like status updates or errors. Correlating them with traces links these messages to specific requests, making it easier to debug issues by seeing the full context of a request's journey.
In this section, we'll add logging to our Flask app, enable trace-log correlation using OpenTelemetry, and view the results in SigNoz.
Adding Logging to the Flask App
We'll update app.py to include logging with trace context, using OpenTelemetry to capture and correlate logs with traces. We'll also use auto-instrumentation for Flask traces and metrics.
Update app.py with the following code:
import logging
from flask import Flask, request
from opentelemetry import trace
from opentelemetry import metrics
from opentelemetry.instrumentation.flask import FlaskInstrumentor
from opentelemetry.instrumentation.logging import LoggingInstrumentor
import time

# Configure logging with OpenTelemetry
class OpenTelemetryLogFormatter(logging.Formatter):
    def format(self, record):
        # Add trace and span context to log record
        current_span = trace.get_current_span()
        if current_span:
            span_context = current_span.get_span_context()
            if span_context and span_context.is_valid:
                record.trace_id = f"{span_context.trace_id:032x}"
                record.span_id = f"{span_context.span_id:016x}"
            else:
                record.trace_id = "00000000000000000000000000000000"
                record.span_id = "0000000000000000"
        else:
            record.trace_id = "00000000000000000000000000000000"
            record.span_id = "0000000000000000"
        return super().format(record)

# Create formatter
formatter = OpenTelemetryLogFormatter(
    '%(asctime)s - %(name)s - %(levelname)s - trace_id=%(trace_id)s span_id=%(span_id)s - %(message)s'
)

# Set up root logger
root_logger = logging.getLogger()
root_logger.setLevel(logging.INFO)
handler = logging.StreamHandler()
handler.setFormatter(formatter)
root_logger.addHandler(handler)

# Create Flask app
app = Flask(__name__)

# Disable Werkzeug's default logger
app.logger.handlers = []
werkzeug_logger = logging.getLogger('werkzeug')
werkzeug_logger.disabled = True

# Create a custom logger for HTTP access
http_logger = logging.getLogger('http.access')
http_logger.setLevel(logging.INFO)
http_logger.addHandler(handler)

# Custom logging middleware
@app.before_request
def before_request():
    # Store request start time
    request.start_time = time.time()

@app.after_request
def after_request(response):
    # Calculate request duration
    duration_ms = (time.time() - request.start_time) * 1000

    # Log the request with the current trace context
    http_logger.info(
        '%s - - [%s] "%s %s %s" %s %s (%.2fms)',
        request.remote_addr,
        time.strftime('%d/%b/%Y %H:%M:%S'),
        request.method,
        request.path,
        request.environ.get('SERVER_PROTOCOL', ''),
        response.status_code,
        response.content_length or '-',
        duration_ms
    )

    return response

# Instrument Flask for traces and logs
FlaskInstrumentor().instrument_app(app)
LoggingInstrumentor().instrument()

# Custom metric
meter = metrics.get_meter(__name__)
task_counter = meter.create_counter(
    "task_requests",
    description="Number of task requests"
)

# Tracer for custom spans
tracer = trace.get_tracer(__name__)

@app.route('/')
def home():
    logging.info("Home endpoint accessed")
    return "Welcome to the Flask App!"

@app.route('/task')
def task():
    with tracer.start_as_current_span("task_processing"):
        task_counter.add(1)
        logging.info("Task endpoint accessed")
        return "Task completed!"

if __name__ == "__main__":
    app.run(host='0.0.0.0', port=5000)
-
Custom Log Formatter:
-
OpenTelemetryLogFormatterextracts trace and span IDs from the current span context - Correctly handles the span context properties to avoid errors
- Formats IDs as hexadecimal strings with proper padding
-
-
HTTP Request Logging:
- Disables Werkzeug's default logger, which doesn't capture trace context
- Implements custom request hooks with
before_requestandafter_request - Logs HTTP requests within the trace context to ensure correlation
- Includes request duration similar to standard web server logs
-
Auto-Instrumentation:
-
FlaskInstrumentor().instrument_app(app)automatically generates traces for Flask HTTP requests -
LoggingInstrumentor().instrument()enables log collection with trace context
-
Enabling Log-Trace Correlation
To correlate logs with traces, we'll use OpenTelemetry's auto-instrumentation to capture traces, metrics, and logs and send them to SigNoz.
Run the app with the following commands:
export OTEL_PYTHON_LOGGING_AUTO_INSTRUMENTATION_ENABLED=true
opentelemetry-instrument --traces_exporter otlp --metrics_exporter otlp --logs_exporter otlp --service_name flask-app python3 app.py
-
OTEL_PYTHON_LOGGING_AUTO_INSTRUMENTATION_ENABLED=trueenables OpenTelemetry to capture logs and include trace context. -
opentelemetry-instrumentruns the app with auto-instrumentation, exporting traces, metrics, and logs to SigNoz.
This setup links log messages to their corresponding traces using trace IDs.
Analyzing correlated logs with traces
Follow the given steps:
- Visit
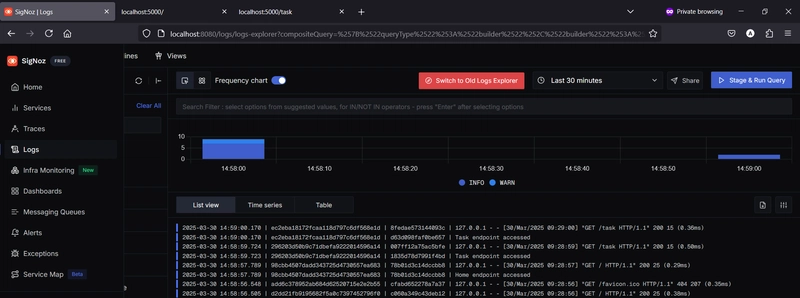
http://localhost:5000/andhttp://localhost:5000/taskto generate some requests - Go to the “Logs” tab on Signoz
- Add
otelTraceIDandotelSpanIDin the column settings
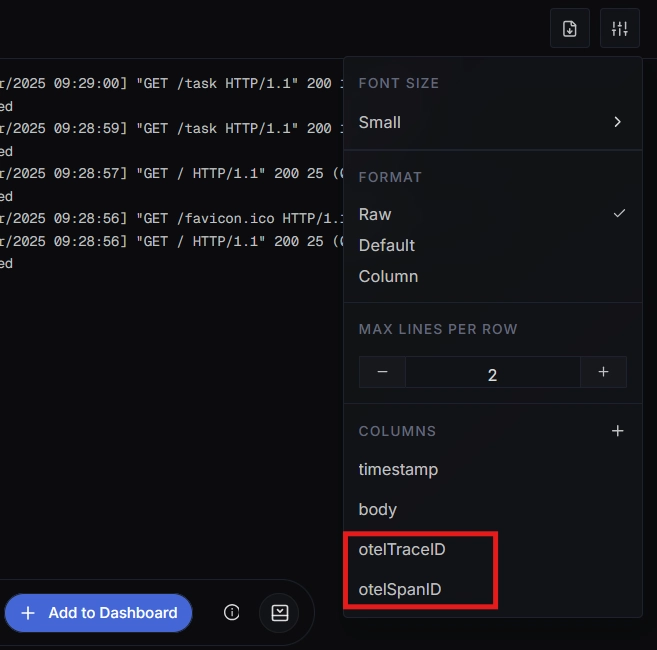
Now you can see correlated logs with traces:
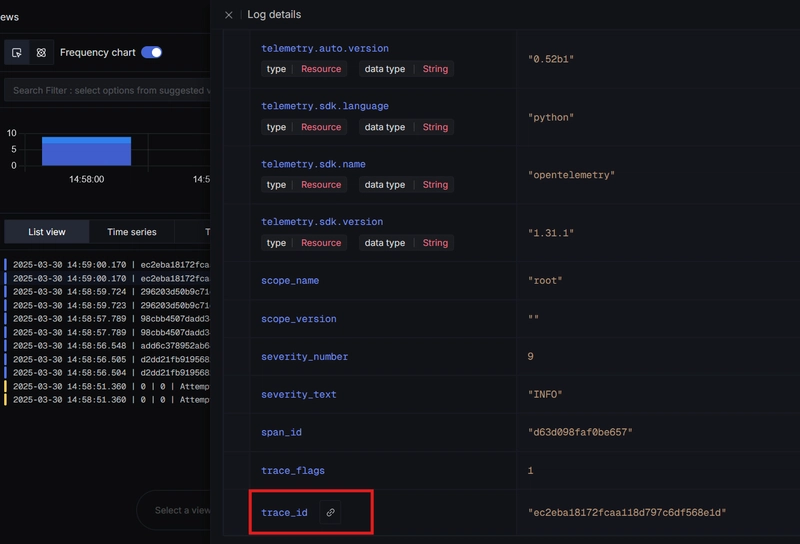
You can also click on a log entry to see its details. You'll see a trace_id field, which you can click to jump to the matching trace in the “Traces” tab:
Alternatively, go to the “Traces” tab, select a trace, and click “Go to related logs” to see the logs associated with that trace:
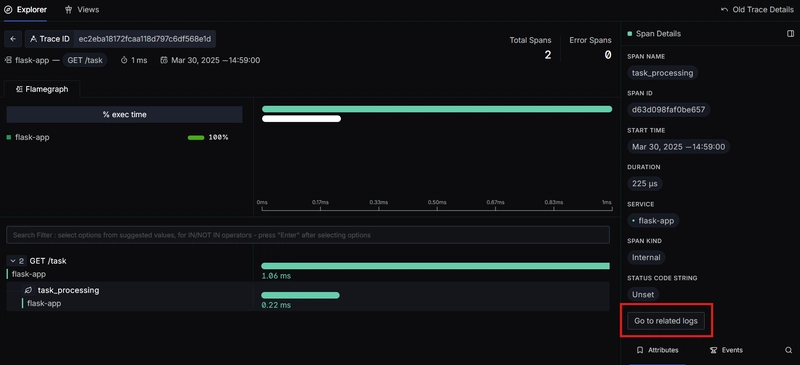
The correlation links each log to its request's journey, helping you debug issues by seeing both the log messages and the trace details together.
Keep digging
Observability opens a window into your application's inner workings. It isn’t just for fixing things when they break. It’s how you learn from your systems. And the more you see, the better you build. This is just the start. Keep digging.