


![[The AI Show Episode 143]: ChatGPT Revenue Surge, New AGI Timelines, Amazon’s AI Agent, Claude for Education, Model Context Protocol & LLMs Pass the Turing Test](https://www.marketingaiinstitute.com/hubfs/ep%20143%20cover.png)


.png?#)


.webp?#)
.webp?#)


![[Fixed] Gemini app is failing to generate Audio Overviews](https://i0.wp.com/9to5google.com/wp-content/uploads/sites/4/2025/03/Gemini-Audio-Overview-cover.jpg?resize=1200%2C628&quality=82&strip=all&ssl=1)

![What’s new in Android’s April 2025 Google System Updates [U: 4/14]](https://i0.wp.com/9to5google.com/wp-content/uploads/sites/4/2025/01/google-play-services-3.jpg?resize=1200%2C628&quality=82&strip=all&ssl=1)


![Apple Seeds tvOS 18.5 Beta 2 to Developers [Download]](https://www.iclarified.com/images/news/97011/97011/97011-640.jpg)
![Apple Releases macOS Sequoia 15.5 Beta 2 to Developers [Download]](https://www.iclarified.com/images/news/97014/97014/97014-640.jpg)


Data Analysis of a Model Car Database Using MySQL Workbench
I’m on a journey to mastering data analysis. I began this path nearly a year ago. Looking back, it feels like time has flown by, but working on this project made me realize just how much I’ve learned along the way. I genuinely enjoy working with datasets and uncovering useful insights from raw data. Now, you might be wondering-what is this project about? I conducted an exploratory data analysis (EDA) for a fictional company called Mint Classics, a retailer specializing in classic model cars and other vehicles. The project revolves around a business challenge: the company is considering closing one of its storage facilities and needs data-driven recommendations. However, in this article, I will focus on the preliminary analysis I conducted before tackling the business problem. This initial exploration helped me familiarize myself with the dataset, understand relationships between tables, and answer key questions that might arise from the available data. Without further ado, let’s dive into the project! Step 1: Understanding the Database Before diving into analysis, it’s crucial to understand the data we’re working with. This process involves asking the right questions—something I find invaluable. Because questions help me explore data more deeply. Our database is quite extensive, consisting of nine interconnected tables, each containing valuable information. Since we’re working with multiple tables rather than a single one, understanding their relationships is essential. These connections are represented using an EER (Extended Entity-Relationship) diagram. Below is a snapshot of the diagram in Power BI, which models the structure of the Mint Classics database: Step 2: Configuring MySQL & Importing Data into Power BI In this section, I provide a brief guide on setting up MySQL and importing data into Power BI for those who may find it helpful. If you're already familiar with these steps or prefer to skip them, feel free to move on to the next step - Step 3. a. MySQL Setup Our dataset needs to be imported into the MySQL Workbench so that we can use SQL queries to extract the data we need. The initial step was installing MySQL Workbench to establish a suitable working environment. Once installed, configured, and connected to a local MySQL server instance, I downloaded the provided mintclassicsDB.sql file, which contains the Mint Classics relational database. Using the script included in this file (which contains commands to create the schema), I imported the database into MySQL Workbench, making it ready for further analysis. Snapshot of the database after importing the workbench: A snapshot showcasing a preview of one of the tables (customers table) in MySQL Workbench: b. Importing the Database into Power BI To uncover meaningful insights through visualizations, the first step is to import the dataset into a visualization tool. For this project, I used Power BI. During this step, you might encounter a message stating, "This connector requires one or more additional components to be installed before it can be used." This means an extra component is needed for the connection. Simply follow the provided link, which will likely direct you to: MySQL Connector Download Download the required component and, before attempting to import the database again, try refreshing Power BI or restarting the application. Once that’s done, you can follow the detailed instructions in this video on How to Connect MySQL Database to Power BI, where the process is explained thoroughly: YouTube Tutorial Step 3: Exploratory Data Analysis After we are done, now it's time to move into getting to know our dataset by asking some important questions. Raw data alone doesn’t reveal much at first glance-it requires analysis to extract meaningful patterns. Take the orders table, for example; it stores details about customer orders, including order dates, customer information, etc.: However, simply viewing this table doesn’t provide actionable insights. That’s where analysis comes in. Throughout this analysis, I used SQL queries for extracting relevant information, while Power BI helped me visualize the findings effectively. How many products were purchased in each order? The first thing I wanted to analyze was to check whether a single order can contain more than one product, and determine the number of products purchased per order: Note that in this analysis I focused only on one table (orderdetails) of the mintclassics dataset. The query shows that there are indeed multiple products under a single transaction (i.e. order). For example, order number 10106 contains 18 products. The key takeaway here is that when a customer places an order, they can buy one or more products. Customers with multiple orders on the same day To analyze the order-customer relationship, I wanted to check the number of orders placed by each customer on each day and, more precisely, if any customers placed
I’m on a journey to mastering data analysis. I began this path nearly a year ago. Looking back, it feels like time has flown by, but working on this project made me realize just how much I’ve learned along the way. I genuinely enjoy working with datasets and uncovering useful insights from raw data.
Now, you might be wondering-what is this project about? I conducted an exploratory data analysis (EDA) for a fictional company called Mint Classics, a retailer specializing in classic model cars and other vehicles. The project revolves around a business challenge: the company is considering closing one of its storage facilities and needs data-driven recommendations. However, in this article, I will focus on the preliminary analysis I conducted before tackling the business problem. This initial exploration helped me familiarize myself with the dataset, understand relationships between tables, and answer key questions that might arise from the available data.
Without further ado, let’s dive into the project!
Step 1: Understanding the Database
Before diving into analysis, it’s crucial to understand the data we’re working with. This process involves asking the right questions—something I find invaluable. Because questions help me explore data more deeply.
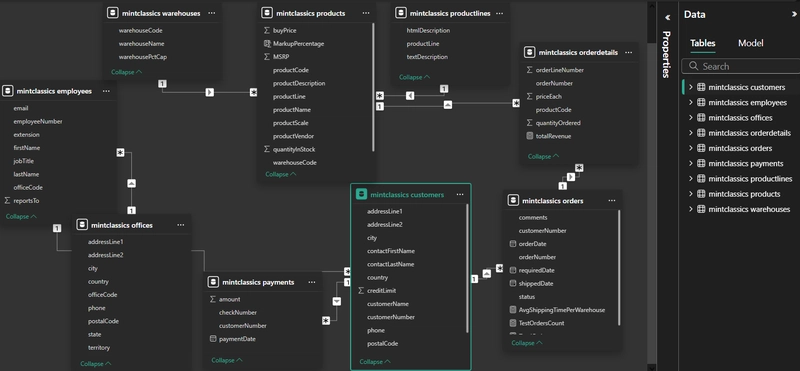
Our database is quite extensive, consisting of nine interconnected tables, each containing valuable information. Since we’re working with multiple tables rather than a single one, understanding their relationships is essential. These connections are represented using an EER (Extended Entity-Relationship) diagram. Below is a snapshot of the diagram in Power BI, which models the structure of the Mint Classics database:
Step 2: Configuring MySQL & Importing Data into Power BI
In this section, I provide a brief guide on setting up MySQL and importing data into Power BI for those who may find it helpful. If you're already familiar with these steps or prefer to skip them, feel free to move on to the next step - Step 3.
a. MySQL Setup
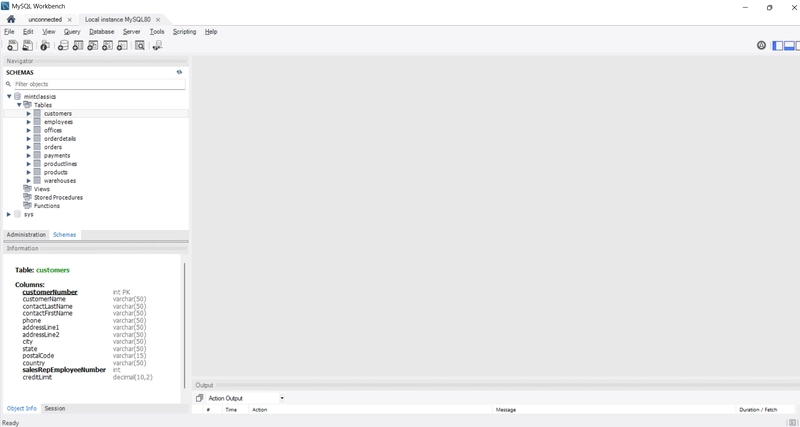
Our dataset needs to be imported into the MySQL Workbench so that we can use SQL queries to extract the data we need. The initial step was installing MySQL Workbench to establish a suitable working environment. Once installed, configured, and connected to a local MySQL server instance, I downloaded the provided mintclassicsDB.sql file, which contains the Mint Classics relational database. Using the script included in this file (which contains commands to create the schema), I imported the database into MySQL Workbench, making it ready for further analysis. Snapshot of the database after importing the workbench:
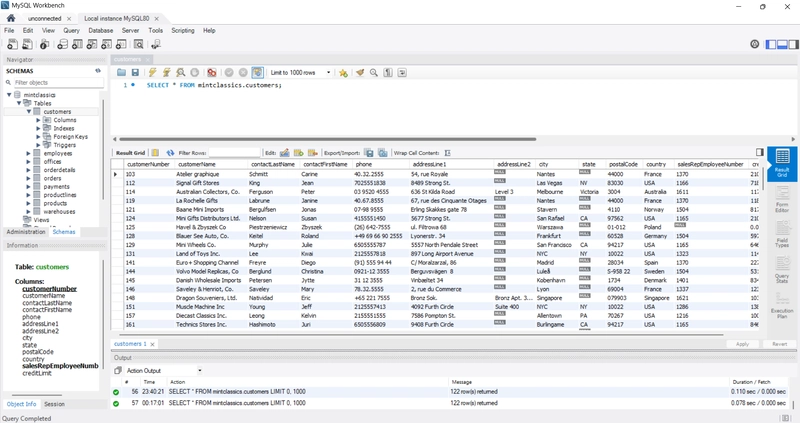
A snapshot showcasing a preview of one of the tables (customers table) in MySQL Workbench:
b. Importing the Database into Power BI
To uncover meaningful insights through visualizations, the first step is to import the dataset into a visualization tool. For this project, I used Power BI.
During this step, you might encounter a message stating, "This connector requires one or more additional components to be installed before it can be used." This means an extra component is needed for the connection. Simply follow the provided link, which will likely direct you to: MySQL Connector Download
Download the required component and, before attempting to import the database again, try refreshing Power BI or restarting the application. Once that’s done, you can follow the detailed instructions in this video on How to Connect MySQL Database to Power BI, where the process is explained thoroughly: YouTube Tutorial
Step 3: Exploratory Data Analysis
After we are done, now it's time to move into getting to know our dataset by asking some important questions.
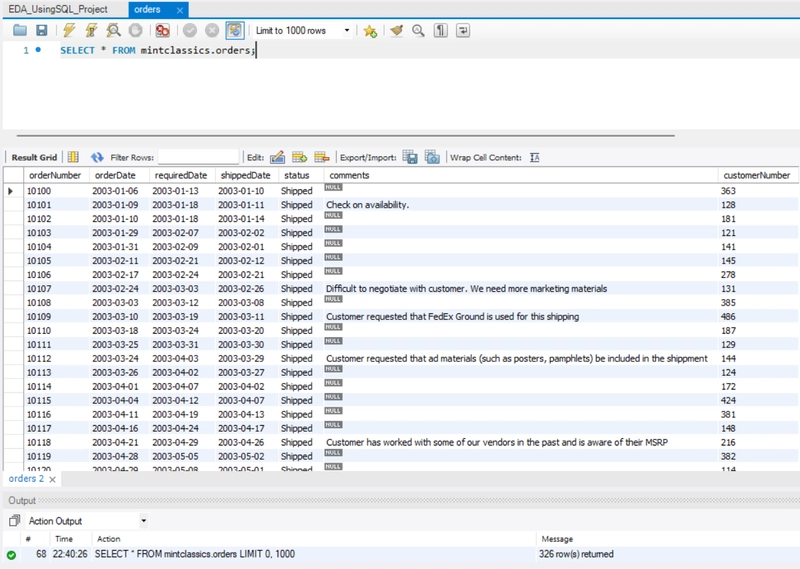
Raw data alone doesn’t reveal much at first glance-it requires analysis to extract meaningful patterns. Take the orders table, for example; it stores details about customer orders, including order dates, customer information, etc.:
However, simply viewing this table doesn’t provide actionable insights. That’s where analysis comes in.
Throughout this analysis, I used SQL queries for extracting relevant information, while Power BI helped me visualize the findings effectively.
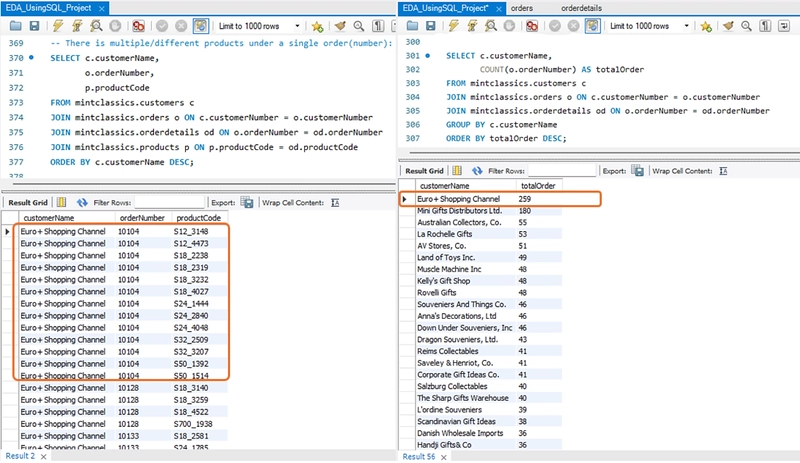
- How many products were purchased in each order?
The first thing I wanted to analyze was to check whether a single order can contain more than one product, and determine the number of products purchased per order:
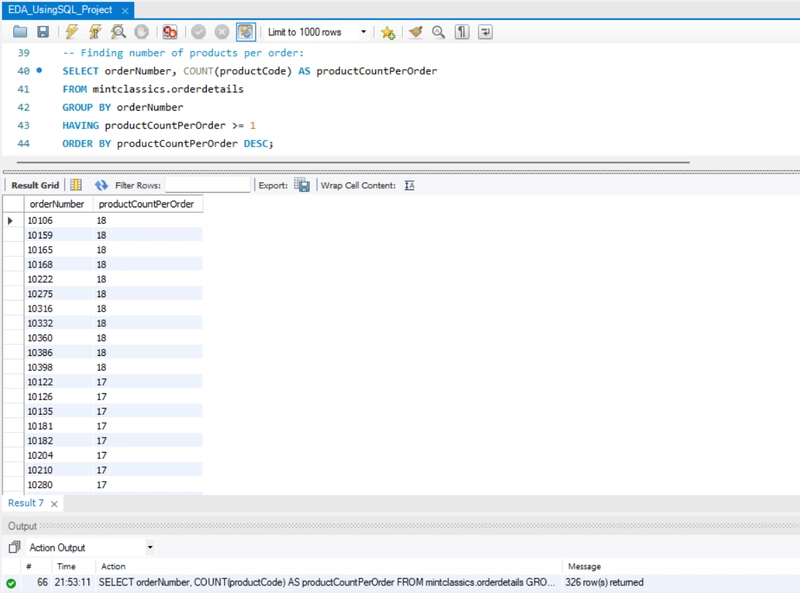
Note that in this analysis I focused only on one table (orderdetails) of the mintclassics dataset.
The query shows that there are indeed multiple products under a single transaction (i.e. order). For example, order number 10106 contains 18 products.
The key takeaway here is that when a customer places an order, they can buy one or more products.
- Customers with multiple orders on the same day
To analyze the order-customer relationship, I wanted to check the number of orders placed by each customer on each day and, more precisely, if any customers placed multiple orders on the same day:
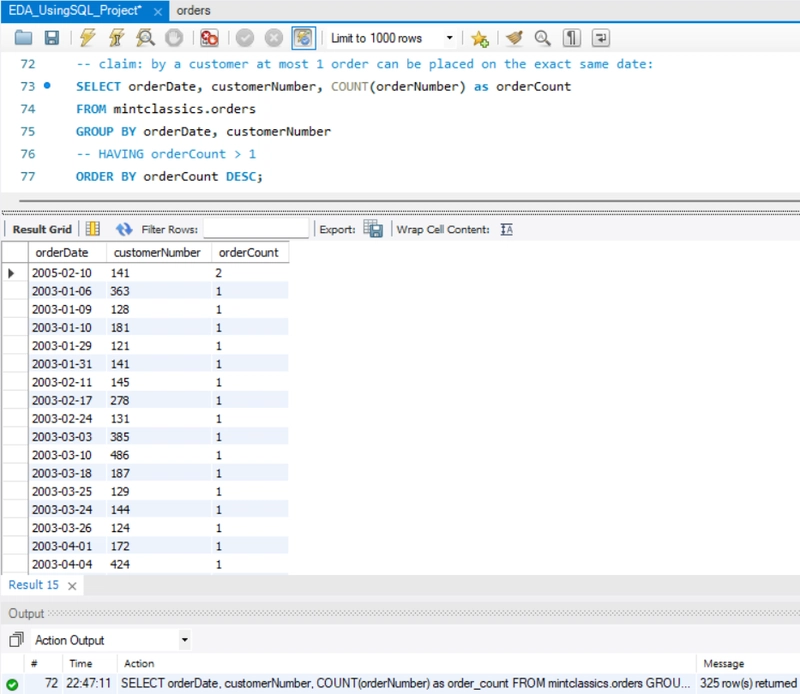
Note: To filter the results only to include the customers with order count being more than two on the same day, simply uncomment the HAVING clause in the query above.
The analysis reveals that a single customer (141) placed two separate orders on February 10, 2005. There could be several reasons for this; though I won’t list them all here, I'll explore one possible explanation in the next analysis.
- Products purchased in multiple orders by the same customer
Following the above analysis, this analysis identifies how many products were bought by the customer (141) in both orders separately on the same day. The goal is to gain insight into the possible reasons behind placing multiple orders rather than a single one:
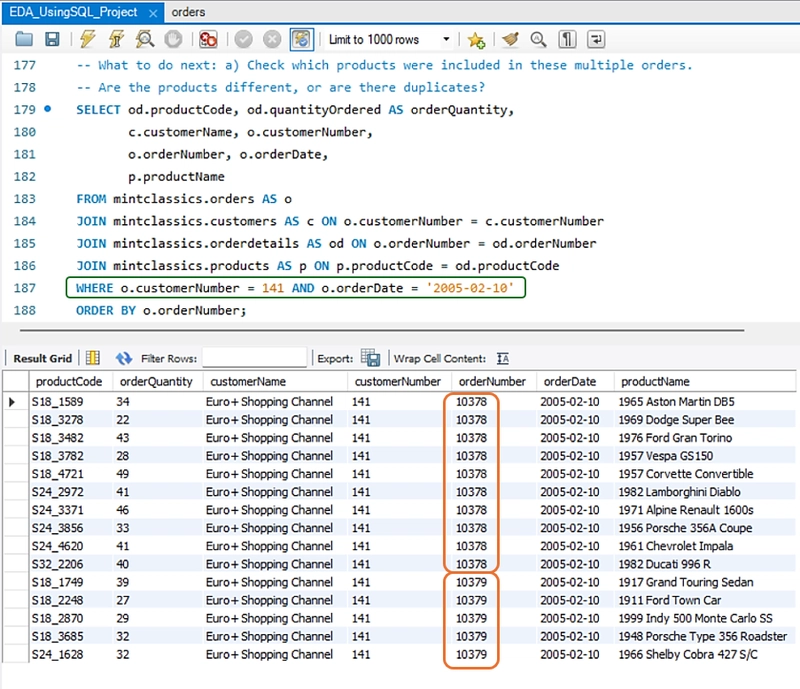
Observations: Customer Euro + Shopping Channel (141) placed two orders on February 10, 2005. A total of 15 distinct products were ordered. Of these, 10 were included in order #10378, while the remaining 5 were part of order #10379. There appears to be a limit on the number of products per order, which may explain why a second order (#10379) was necessary once that limit was exceeded. Large or bulk orders might be split into multiple transcanctions.
Key Takeaway: While most customers typically place only one order per day, multiple orders on the same day can also occur, likely influenced by the company's internal policies or specific circumstances.
- Total number of different orders placed by each customer
Considering insights from previous analysis, it can be natural to claim that Euro + Shopping Channel is the customer that has purchased the highest number of products. Check the result in the snapshot below:
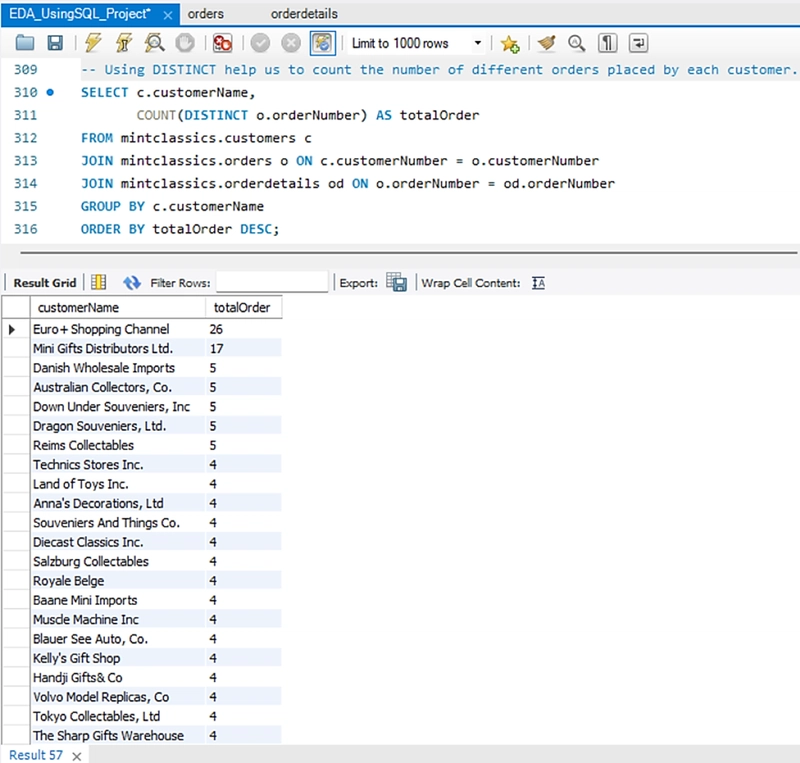
It turned out the number of different orders placed by Euro + Shopping Channel in total is 26, and it is the highest number.
Challenge encountered: An order containing multiple products results in its order number appearing multiple times in the table-once for each product. As a result, the same order is counted multiple times:
Solution: Applying DISTINCT ensures that each order is counted only once, allowing us to accurately determine the number of unique orders placed by each customer.
- Top 5 customers with the highest number of orders
I also analyzed the top 5 customers with the highest number of orders, including their customer numbers:
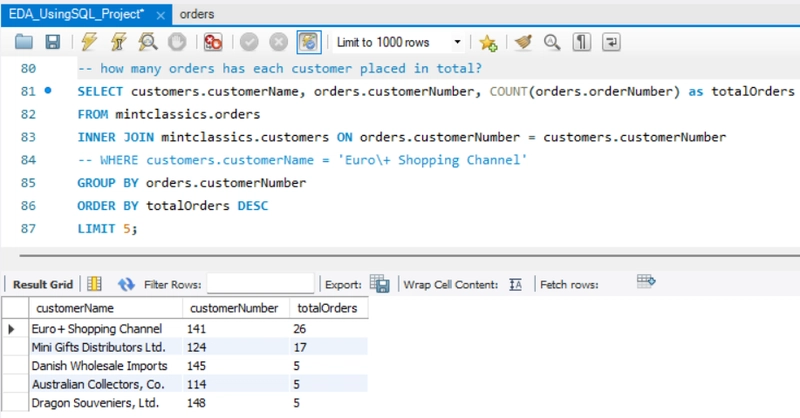
Note: To know the number of orders by a specific customer, uncomment the line with the WHERE clause and replace the customer name in the above query.
See the snapshot below for the visualization of the top five customers in Power BI sorted in descending order:
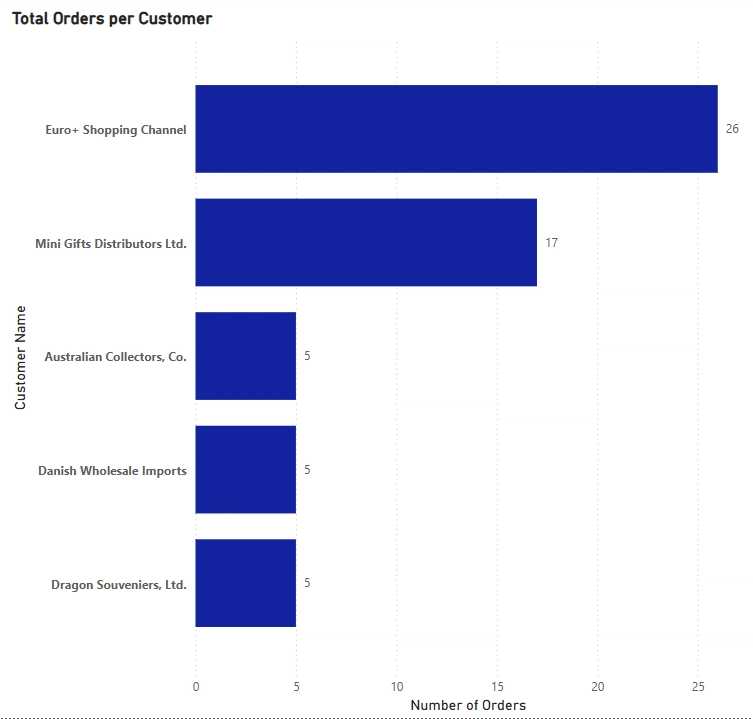
This analysis highlights the top five customers with the highest number of orders. Notably, there is a significant gap between the top two customers and the remaining three. The first two customers placed 26 and 17 orders, respectively, whereas the last three placed only five orders each.
Possible insights from this result:
- these high-order customers might be loyal or bulk buyers, making them valuable to the business.
- the low order count from the other three customers could indicate occasional buyers.
- How many products are purchased by a specific customer in each order?
To find the number of products that are bought by a customer per order, I needed to join orders, orderdetails, and customers tables. In the query, I sorted the number of products per order in ascending order to identify the minimum number of products purchased by a specific customer:
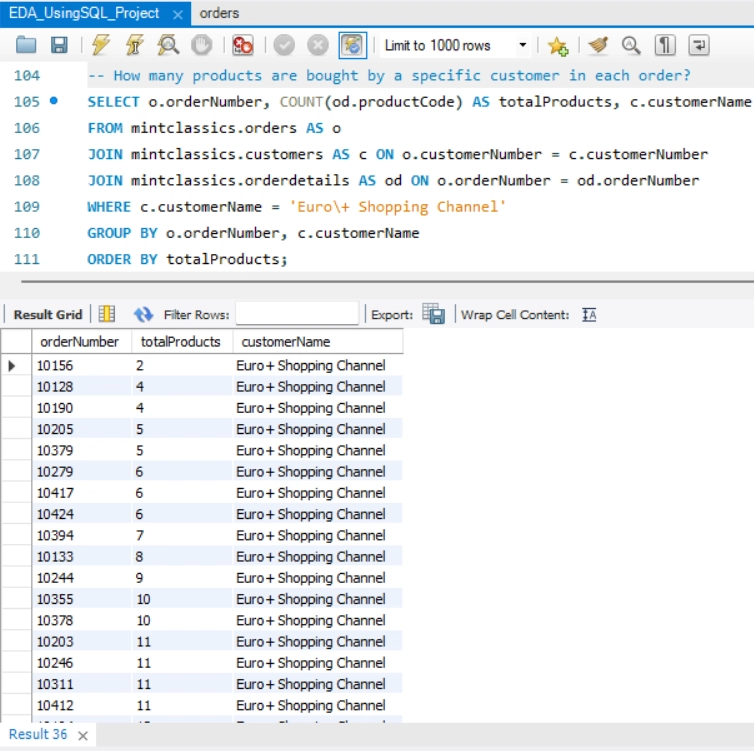
As shown in the snapshot above, Euro + Shopping Channel has purchased at least 2 products in each order. This means that for every order placed by this customer, the minimum quantity of products bought was 2.
- Price of each product in each order
I wanted to check the product with the highest price, and analyze whether the prices change due to some factors.
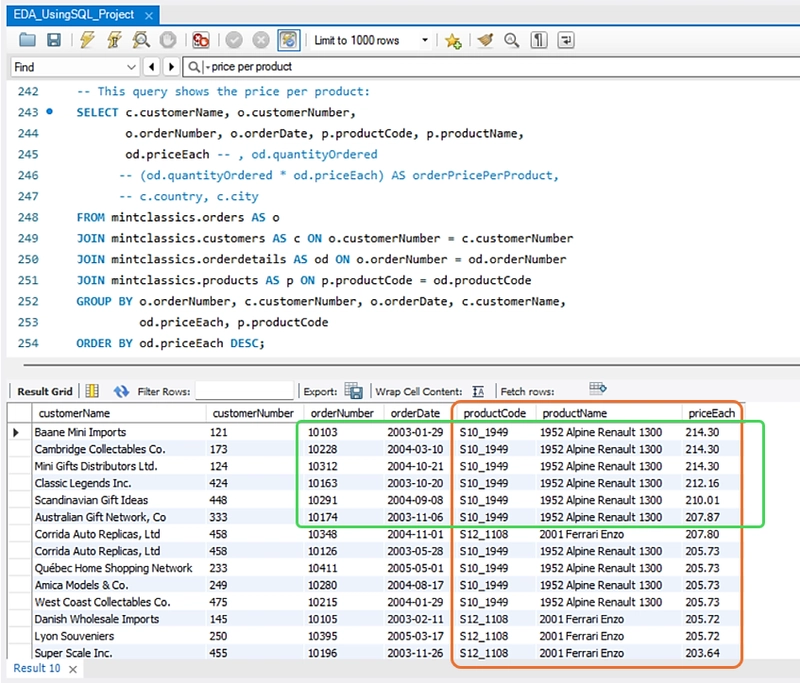
Observation:
- The product with the highest price of $214.30 is '1952 Alpine Renault 1300'.
- The price of each product fluctuates across different orders. The customer's location/country and the order date are potential factors influencing these variations. For instance, the product '1952 Alpine Renault 1300' was priced at $212.16 on 2003-10-20, but by 2003-11-06, its price had decreased by approximately $5, reaching $207.87.
While different customers placed these orders, the most likely factors affecting the price are time-based price adjustments or regional pricing differences.
- Most ordered products
I wanted to check which products are frequently purchased by customers. This could reveal if they focus on specific items.
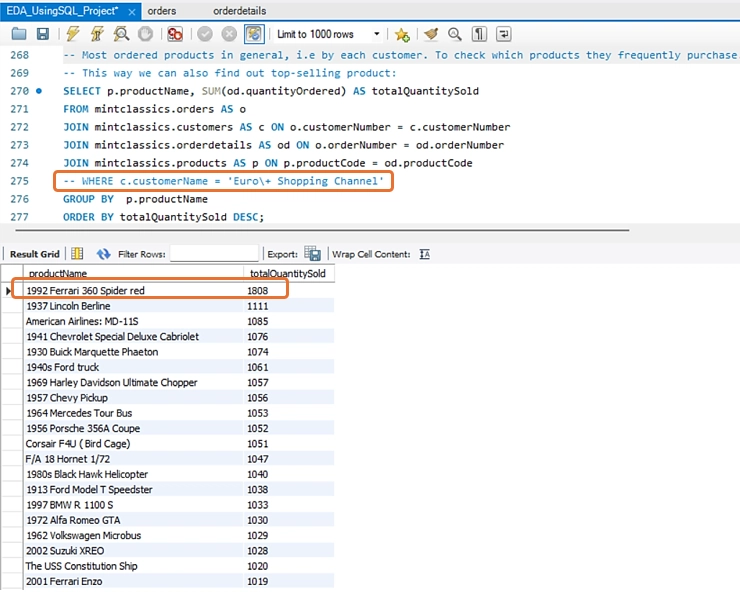
Customers indeed focus on a specific product: 1992 Ferrari 360 Spider red.
So, we can tell this product is the most in-demand product among all customers.
Note: To see the most ordered products by the specific customer, simply uncomment the WHERE clause in the query.
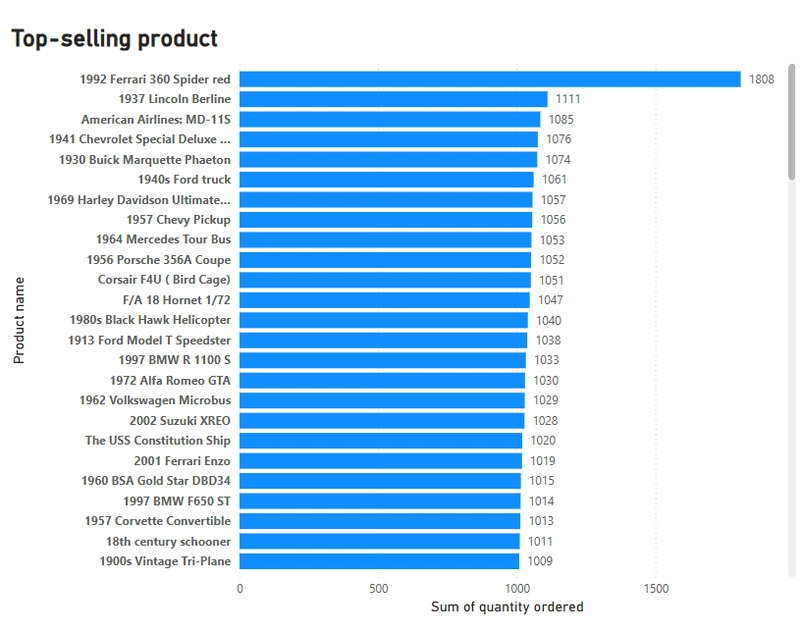
In the following, I provide the visualization of the same analysis in Power BI:
- Which customers are a wholesaler or retailer?
I would also like to check whether any of the customers—specifically Euro + Shopping Channel (141)— can be categorized as a wholesaler. We don’t have a specific column that tells us whether a customer is a wholesaler, but we can check:
- if their total order volume is much higher than other customers
- if they frequently place large orders (high quantityOrdered)
- if they have a high credit limit (usually assigned to big buyers)
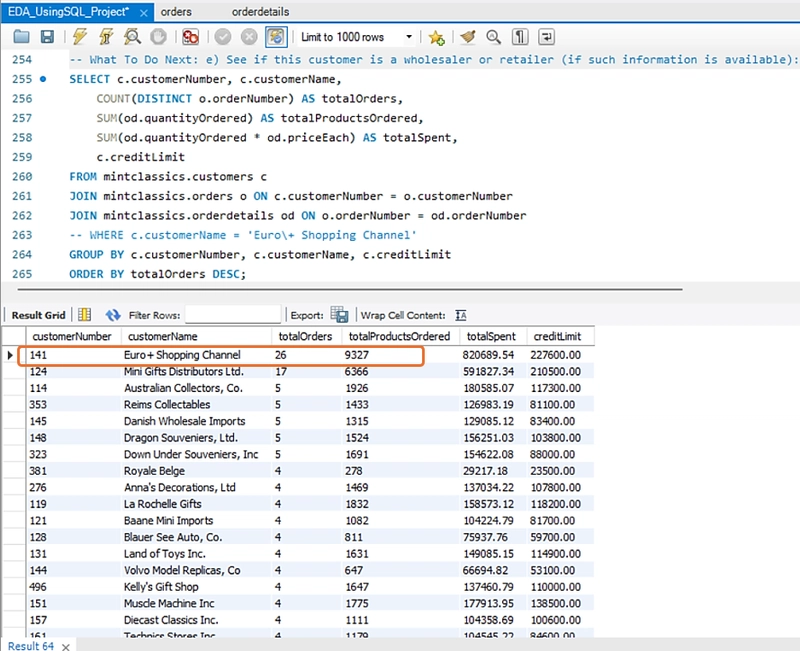
Observation:
Interestingly, the customer with the highest credit limit is Euro + Shopping Channel.
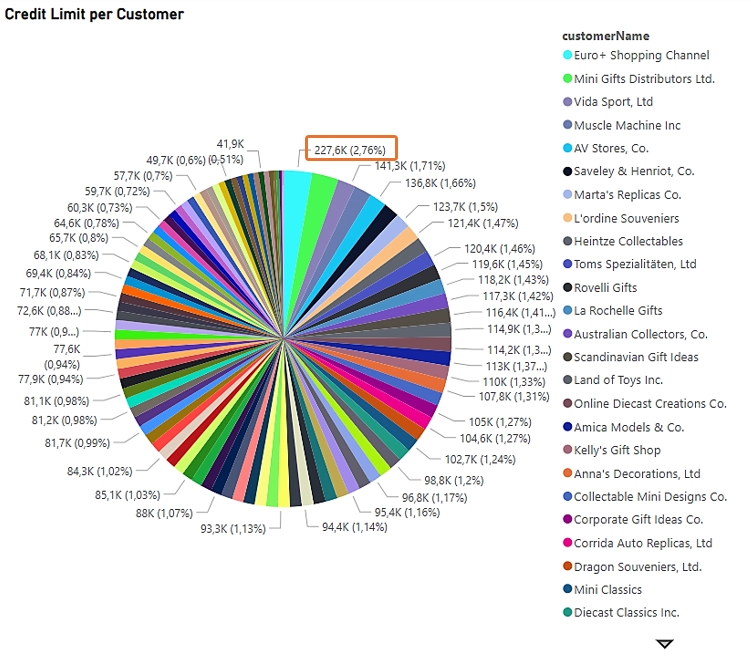
- Customer Credit Limit vs. Total Orders
This will show whether customers with higher credit limits tend to order more:
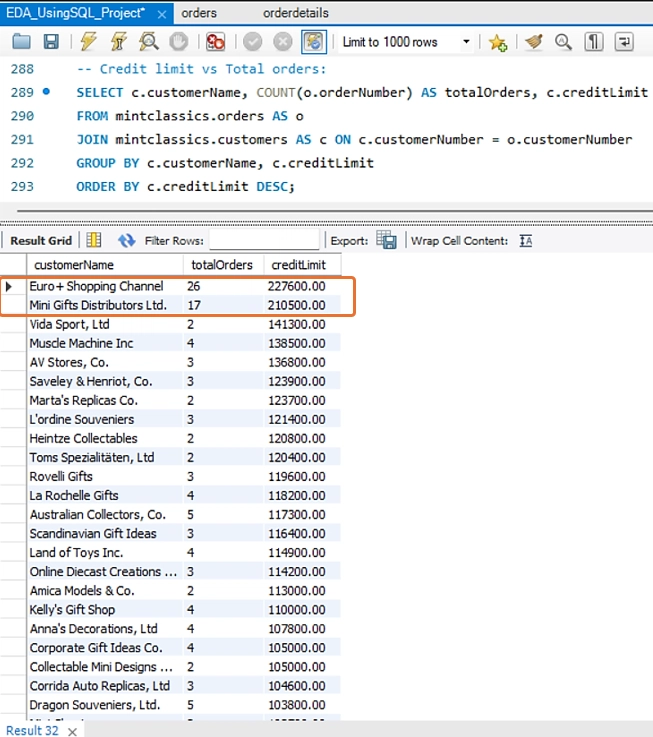
Two customers with the highest credit limit tend to place more orders than those with less credit limit. See also the pie chart:
This concludes a part of the exploratory data analysis I conducted in this project.
Thank you for taking the time to read through!