


![[The AI Show Episode 146]: Rise of “AI-First” Companies, AI Job Disruption, GPT-4o Update Gets Rolled Back, How Big Consulting Firms Use AI, and Meta AI App](https://www.marketingaiinstitute.com/hubfs/ep%20146%20cover.png)


![Ditching a Microsoft Job to Enter Startup Purgatory with Lonewolf Engineer Sam Crombie [Podcast #171]](https://cdn.hashnode.com/res/hashnode/image/upload/v1746753508177/0cd57f66-fdb0-4972-b285-1443a7db39fc.png?#)


![[Fixed] Gemini 2.5 Flash missing file upload for free app users](https://i0.wp.com/9to5google.com/wp-content/uploads/sites/4/2025/03/google-gemini-workspace-1.jpg?resize=1200%2C628&quality=82&strip=all&ssl=1)


![As Galaxy Watch prepares a major change, which smartwatch design to you prefer? [Poll]](https://i0.wp.com/9to5google.com/wp-content/uploads/sites/4/2024/07/Galaxy-Watch-Ultra-and-Apple-Watch-Ultra-1.jpg?resize=1200%2C628&quality=82&strip=all&ssl=1)


![Apple M4 MacBook Air Hits New All-Time Low of $824 [Deal]](https://www.iclarified.com/images/news/97288/97288/97288-640.jpg)
![An Apple Product Renaissance Is on the Way [Gurman]](https://www.iclarified.com/images/news/97286/97286/97286-640.jpg)
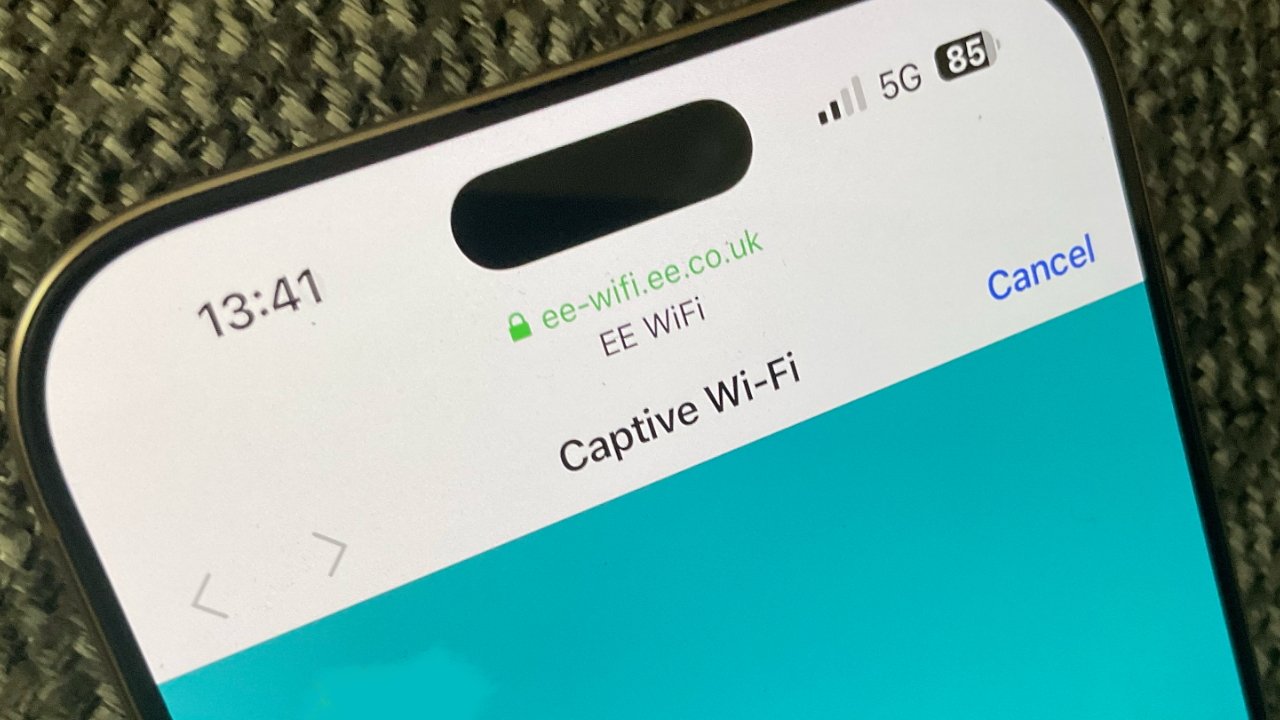
![Apple to Sync Captive Wi-Fi Logins Across iPhone, iPad, and Mac [Report]](https://www.iclarified.com/images/news/97284/97284/97284-640.jpg)
![Apple M4 iMac Drops to New All-Time Low Price of $1059 [Deal]](https://www.iclarified.com/images/news/97281/97281/97281-640.jpg)


![Apple's 11th Gen iPad Drops to New Low Price of $277.78 on Amazon [Updated]](https://images.macrumors.com/t/yQCVe42SNCzUyF04yj1XYLHG5FM=/2500x/article-new/2025/03/11th-gen-ipad-orange.jpeg)


Building a Live Interactive Data Visualization with Phoenix LiveView
Phoenix LiveView is an incredibly versatile tool, and while it’s often used for building real-time applications like chat and notifications, it’s also perfect for creating interactive data visualizations. In this tutorial, we’ll use Phoenix LiveView to create a real-time interactive graph that updates dynamically based on user input—without writing any JavaScript. Step 1: Set Up Your Phoenix Project Start by creating a new Phoenix project: mix phx.new live_graph --live cd live_graph mix phx.server Make sure Phoenix LiveView is included in your mix.exs: defp deps do [ {:phoenix_live_view, "~> 0.17.5"} ] end Run mix deps.get to install the dependencies. Step 2: Create the LiveView for the Graph Next, let’s create a LiveView that will handle the graph and allow users to manipulate data points interactively. Create a new file called graph_live.ex: # lib/live_graph_web/live/graph_live.ex defmodule LiveGraphWeb.GraphLive do use Phoenix.LiveView def mount(_params, _session, socket) do {:ok, assign(socket, data: generate_random_data(), x_axis: 1, y_axis: 10)} end def handle_event("update_data", %{"x" => x, "y" => y}, socket) do data = update_data(socket.assigns.data, String.to_integer(x), String.to_integer(y)) {:noreply, assign(socket, data: data)} end defp generate_random_data do Enum.map(1..10, fn _ -> {rand() * 10, rand() * 10} end) end defp update_data(data, x, y) do data |> List.delete_at(0) |> Enum.concat([{x, y}]) end def render(assigns) do ~L""" Live Interactive Graph

Phoenix LiveView is an incredibly versatile tool, and while it’s often used for building real-time applications like chat and notifications, it’s also perfect for creating interactive data visualizations. In this tutorial, we’ll use Phoenix LiveView to create a real-time interactive graph that updates dynamically based on user input—without writing any JavaScript.
Step 1: Set Up Your Phoenix Project
Start by creating a new Phoenix project:
mix phx.new live_graph --live
cd live_graph
mix phx.server
Make sure Phoenix LiveView is included in your mix.exs:
defp deps do
  [
    {:phoenix_live_view, "~> 0.17.5"}
  ]
end
Run mix deps.get to install the dependencies.
Step 2: Create the LiveView for the Graph
Next, let’s create a LiveView that will handle the graph and allow users to manipulate data points interactively.
Create a new file called graph_live.ex:
# lib/live_graph_web/live/graph_live.ex
defmodule LiveGraphWeb.GraphLive do
  use Phoenix.LiveView

  def mount(_params, _session, socket) do
    {:ok, assign(socket, data: generate_random_data(), x_axis: 1, y_axis: 10)}
  end

  def handle_event("update_data", %{"x" => x, "y" => y}, socket) do
    data = update_data(socket.assigns.data, String.to_integer(x), String.to_integer(y))
    {:noreply, assign(socket, data: data)}
  end

  defp generate_random_data do
    Enum.map(1..10, fn _ -> {rand() * 10, rand() * 10} end)
  end

  defp update_data(data, x, y) do
    data |> List.delete_at(0) |> Enum.concat([{x, y}])
  end

  def render(assigns) do
    ~L"""

      Live Interactive Graph

        <%= for {x, y} <- @data do %>

        <% end %>


        Update Graph


    """
  end
end
This code creates a LiveView that renders a simple graph where each data point is represented by a square. When the user submits new data points, the graph updates in real-time.
Step 3: Set Up the Route for the Graph
Now, we need to configure the route for the LiveView in router.ex:
# lib/live_graph_web/router.ex
defmodule LiveGraphWeb.Router do
  use LiveGraphWeb, :router

  live "/graph", LiveGraphWeb.GraphLive
end
Step 4: Run the Application
You can now start the Phoenix server:
mix phx.server
Navigate to http://localhost:4000/graph in your browser, and you’ll see the interactive graph. You can add new data points by typing values into the input fields and submitting the form. The graph will update in real-time as you enter new data.
✅ Pros and ❌ Cons of Building an Interactive Data Visualization with Phoenix LiveView
✅ Pros: