


![[The AI Show Episode 146]: Rise of “AI-First” Companies, AI Job Disruption, GPT-4o Update Gets Rolled Back, How Big Consulting Firms Use AI, and Meta AI App](https://www.marketingaiinstitute.com/hubfs/ep%20146%20cover.png)


![Honor 400 series officially launching on May 22 as design is revealed [Video]](https://i0.wp.com/9to5google.com/wp-content/uploads/sites/4/2025/05/honor-400-series-announcement-1.png?resize=1200%2C628&quality=82&strip=all&ssl=1)


![Beats Studio Pro Wireless Headphones Now Just $169.95 - Save 51%! [Deal]](https://www.iclarified.com/images/news/97258/97258/97258-640.jpg)


Why Tech Decision Makers Need to Stop Taking ChatGPT at Face Value
In recent years, a curious change has taken place in the way technical decisions are made — not just among hobbyists or startups, but even within large companies. When faced with a new technical challenge or architectural decision, more and more professionals are asking a chatbot what to do: "I need to display scrolling line chart with JavaScript, React -what's the best library?" "Which library should I use for frontend animations?" "What is a suitable data base for time series data?" Then comes the magic. ChatGPT (or equivalent) responds almost instantly with a polished list, often with confident-sounding justifications, pros and cons, and a summary that resembles a consultant’s executive briefing. Now you might be telling yourself - "yes, I do that, but I, of course, test and validate the claims. This is fine, right?" Yes, but I wonder if we are really aware of how much this initial bias affects our ultimate decision making process. Personally, I often find myself spending hours of work chasing the so called best approaches, only to find that it is completely invalid - often due to hallucination or false data. Even this, is the "good outcome", compared to a scenario where you proceed with a non-fitting approach when the LLM might have missed the existence of a much better alternative approach. Chat-based AI tools are fast, frictionless, and persuasive. They reduce the perceived cost of research to nearly zero. This is a dangerous thing considering basic human tendency to take the easy way. A practical example I was looking to compare chart options for my React application that would display scrolling time window line charts with data coming over a websocket. Here's my prompt to ChatGPT: Recommend options for JS chart library to display data that is arriving every 1 second, around 10 data points per channel. I need several charts in same view, displaying different data channels with a scrolling time view. Chart style needs to fit into my user interface. I received a list of options, all being promoted as completely viable. According to ChatGPT, the differences very quite small. Here's the first two to show an example: 1) Chart.js + chartjs-plugin-streaming Good for simpler needs with real-time updates. ✅ Easy to use and integrate. ✅ Plugin handles real-time streaming with a scrolling time axis. ✅ Theming via CSS variables and config. ✅ Popular and well-supported. ⚠️ Not optimized for very high-frequency data or many charts on one page. Why it fits: If your performance needs are moderate and you want simplicity with good customization. 2) Plotly.js Feature-rich and highly customizable. ✅ Great theming, interactions, and annotations. ✅ Real-time updates possible (though you manage the time axis). ✅ Built-in multi-trace support. ⚠️ Heavier and slower with large or fast-updating datasets. Why it fits: Excellent if visuals and interactivity are a high priority, but may struggle with very fast updates. If you really think about this information, it tells very little. To me it just seems like a list of impressions without any comparable quality. For example, "Chart.js is easy to use and integrate". This is either directly from the creator's mouth, or some candy text written blindly by ChatGPT. i.e. I'm quite certain there is no deep comparison of integration ease between the Chart.js and the other four options, that is referenced by this mention. In my case, I was really just experimenting so I started from the first pick (again, according to ChatGPT, all of the options were feasible). Chart.js I hope no one interprets this as any kind of bad review of Chart.js or any other library. I do not know much about the library or its intended use cases - I only wish to tell my first experience and how it aligned against the suggestions of ChatGPT. Before looking into charting options, I had created a React application + test data server that generates new measurements across a number of channels and emits them over WebSocket. I had a ready template where to plug in a chart. My starting experience with Chart.js was challenging. Apart from the basic expectation of A) installing a dependency and B) copying a basic use template, after several rounds of trial and error, I ultimately needed to: Install a separate plugin-style dependency to use Chart.js in React. Install another separate dependency to display streaming data. This felt painful, because it officially only supported some 3 years old Chart.js main library version. Apparently the approach chosen by the community is to disable dependency warnings in their project. Install yet one more separate dependency (chartjs-adapter-date-fns) which I don't really even know what it does, but without it application was crashing. Specify colors for each line trend. I was puzzled by this for a long time, I guess the default color for background and lines is both black? It turned out that data was visualized correctly but nothing wa

In recent years, a curious change has taken place in the way technical decisions are made — not just among hobbyists or startups, but even within large companies. When faced with a new technical challenge or architectural decision, more and more professionals are asking a chatbot what to do:
"I need to display scrolling line chart with JavaScript, React -what's the best library?"
"Which library should I use for frontend animations?"
"What is a suitable data base for time series data?"
Then comes the magic. ChatGPT (or equivalent) responds almost instantly with a polished list, often with confident-sounding justifications, pros and cons, and a summary that resembles a consultant’s executive briefing.
Now you might be telling yourself - "yes, I do that, but I, of course, test and validate the claims. This is fine, right?" Yes, but I wonder if we are really aware of how much this initial bias affects our ultimate decision making process.
Personally, I often find myself spending hours of work chasing the so called best approaches, only to find that it is completely invalid - often due to hallucination or false data. Even this, is the "good outcome", compared to a scenario where you proceed with a non-fitting approach when the LLM might have missed the existence of a much better alternative approach.
Chat-based AI tools are fast, frictionless, and persuasive. They reduce the perceived cost of research to nearly zero. This is a dangerous thing considering basic human tendency to take the easy way.
A practical example
I was looking to compare chart options for my React application that would display scrolling time window line charts with data coming over a websocket. Here's my prompt to ChatGPT:
Recommend options for JS chart library to display data that is arriving every 1 second, around 10 data points per channel. I need several charts in same view, displaying different data channels with a scrolling time view. Chart style needs to fit into my user interface.
I received a list of options, all being promoted as completely viable. According to ChatGPT, the differences very quite small.
Here's the first two to show an example:
1) Chart.js + chartjs-plugin-streaming
Good for simpler needs with real-time updates.
✅ Easy to use and integrate.
✅ Plugin handles real-time streaming with a scrolling time axis.
✅ Theming via CSS variables and config.
✅ Popular and well-supported.
⚠️ Not optimized for very high-frequency data or many charts on one page.
Why it fits: If your performance needs are moderate and you want simplicity with good customization.
2) Plotly.js
Feature-rich and highly customizable.
✅ Great theming, interactions, and annotations.
✅ Real-time updates possible (though you manage the time axis).
✅ Built-in multi-trace support.
⚠️ Heavier and slower with large or fast-updating datasets.
Why it fits: Excellent if visuals and interactivity are a high priority, but may struggle with very fast updates.
If you really think about this information, it tells very little. To me it just seems like a list of impressions without any comparable quality. For example, "Chart.js is easy to use and integrate". This is either directly from the creator's mouth, or some candy text written blindly by ChatGPT. i.e. I'm quite certain there is no deep comparison of integration ease between the Chart.js and the other four options, that is referenced by this mention.
In my case, I was really just experimenting so I started from the first pick (again, according to ChatGPT, all of the options were feasible).
Chart.js
I hope no one interprets this as any kind of bad review of Chart.js or any other library. I do not know much about the library or its intended use cases - I only wish to tell my first experience and how it aligned against the suggestions of ChatGPT.
Before looking into charting options, I had created a React application + test data server that generates new measurements across a number of channels and emits them over WebSocket. I had a ready template where to plug in a chart.
My starting experience with Chart.js was challenging. Apart from the basic expectation of A) installing a dependency and B) copying a basic use template, after several rounds of trial and error, I ultimately needed to:
- Install a separate plugin-style dependency to use Chart.js in React.
- Install another separate dependency to display streaming data. This felt painful, because it officially only supported some 3 years old Chart.js main library version. Apparently the approach chosen by the community is to disable dependency warnings in their project.
- Install yet one more separate dependency (
chartjs-adapter-date-fns) which I don't really even know what it does, but without it application was crashing. - Specify colors for each line trend. I was puzzled by this for a long time, I guess the default color for background and lines is both black? It turned out that data was visualized correctly but nothing was visible.
- To get the charts positioned according to the container , I had to set both
responsive: trueandmaintainAspectRatio: false- sounds like no problem, but again, finding these magic flags took some time.Afterwards, I had the basic streaming chart component working, which looks like this:
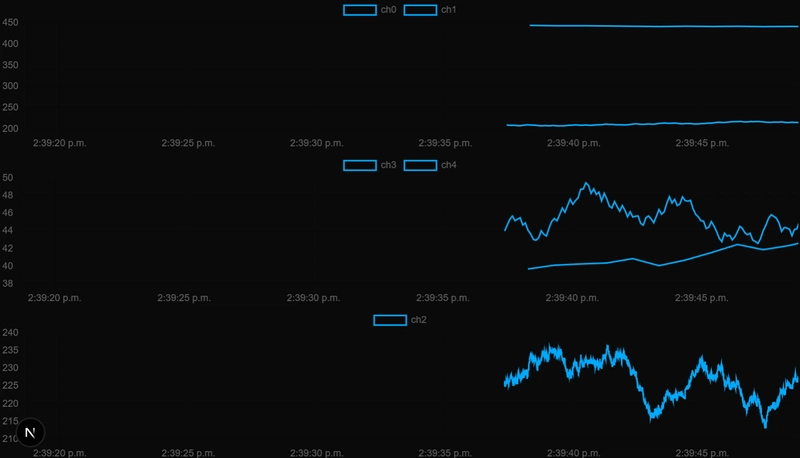
Everything is relative of course, but to me this certainly didn't feel like "Easy to use and integrate" or "Simplicity with good customization". So I proceeded to test next option.
Plotly.js
With Plotly, I didn't have such challenges in terms of dependency installation or getting charts visible. It was really as easy as one would expect to install the dependency and place a basic starter configuration in a React component. I was still not free of challenges though:
- I had to manually control the time axis. i.e. programmed logic that each time specifies which time range should be displayed, so it scrolls with time. This was mentioned by ChatGPT, but it makes me wonder if Plotly really is a good option for my question in this case. While this logic is easy to write it eliminates any chance of user interaction working on the charts. Users can't pan or zoom the charts because the time window logic overwrites the time axis all the time.
- In addition to above, I also had to manually control dropping of old data points. In this kind of streaming data application, the charts would eventually crash if the data only ever expands.
- There was also some conflict between Plotly and Next.js which crashed the whole development environment, but I didn't specify to ChatGPT that I was using Next.js or even React.
- However, the biggest problem was the choppiness of data updates. Every second when a new data point arrives, the time window moves by 1 second. This kind of choppy scrolling really wasn't what I was expecting.

LightningChart JS
I am one of the developers behind another charting library, LightningChart JS. Hence it was my goal to compare the practical experiences between the options which ChatGPT suggests as equivalently feasible.
Here's what ChatGPT said about this option:LightningChart JS
Best for high-frequency, high-performance real-time data.✅ Professional-grade performance, hardware acceleration.
✅ Many customization and chart layout options.
✅ GPU-accelerated rendering (WebGL).
⚠️ Commercial license (free for non-commercial use with limitations).Why it fits: Best if you're building a high-performance professional UI and need smooth charts with large data throughput.
I suppose it would be too much to expect ChatGPT to know such practical details, but this certainly doesn't begin to describe the difference in user experience. Let me explain by showing how the charts behave:

- No plugins or magic flags needed.
- Don't have to manually control time axis.
- User can actually zoom/pan/stop the scrolling axis.
- Don't have to manually drop data points (can just specify how long history should be kept)
Conclusion
I've also noticed that ChatGPT produces different results almost every time I ask the same question. So it really feels like another chapter to book "chatbots are unable to say that they really don't have sufficient knowledge to answer the question".
If every "JavaScript data visualization library" fits the bill and 5 random options are given as the answer to "what is the best option", then at least in this context chatbot was not a very helpful tool.
Maybe they'll learn to be better? Or maybe we need to return to good old search engines when searching for suitable libraries to use.
What do you think?