


![[The AI Show Episode 148]: Microsoft’s Quiet AI Layoffs, US Copyright Office’s Bombshell AI Guidance, 2025 State of Marketing AI Report, and OpenAI Codex](https://www.marketingaiinstitute.com/hubfs/ep%20148%20cover%20%281%29.png)

![[The AI Show Episode 146]: Rise of “AI-First” Companies, AI Job Disruption, GPT-4o Update Gets Rolled Back, How Big Consulting Firms Use AI, and Meta AI App](https://www.marketingaiinstitute.com/hubfs/ep%20146%20cover.png)


![Borderlands 4 Boss Says 'A Real Fan' Will Pay $80 For Games [Update]](https://i.kinja-img.com/image/upload/c_fill,h_675,pg_1,q_80,w_1200/086e4654c281e40d12b833591d2c6fdc.jpg)


_Olekcii_Mach_Alamy.jpg?width=1280&auto=webp&quality=80&disable=upscale#)


![Nomad levels up its best-selling charger with new 100W slim adapter [Hands-on]](https://i0.wp.com/9to5mac.com/wp-content/uploads/sites/6/2025/05/100w-FI.jpg.jpg?resize=1200%2C628&quality=82&strip=all&ssl=1)


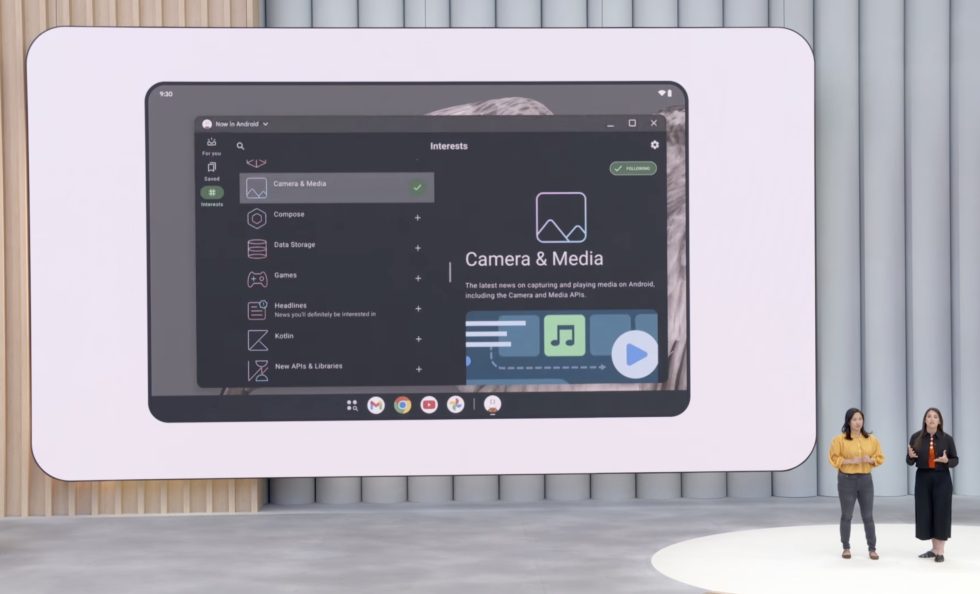
![Google just showed off Android Auto’s upcoming light theme [Gallery]](https://i0.wp.com/9to5google.com/wp-content/uploads/sites/4/2025/05/android-auto-light-theme-documentation-2.jpg?resize=1200%2C628&quality=82&strip=all&ssl=1)


![Apple Accelerates Smart Glasses for 2026, Cancels Watch With Camera [Report]](https://www.iclarified.com/images/news/97408/97408/97408-640.jpg)
![Jony Ive and OpenAI Working on AI Device With No Screen [Kuo]](https://www.iclarified.com/images/news/97401/97401/97401-640.jpg)

![Anthropic Unveils Claude 4 Models That Could Power Apple Xcode AI Assistant [Video]](https://www.iclarified.com/images/news/97407/97407/97407-640.jpg)


Is this diagram a generalization of monitoring in DevOps?
Look at this diagram: Ignoring any specific tech stacks or tools used (i.e., tech stack agnostic), is my general understanding of the monitoring pipeline in DevOps correct? In DevOps monitoring, there are three core pillars of observability: Metrics – Aggregatable numerical data (e.g., the average CPU usage over the past 3 days for all web server nodes). Logs – Timestamped records of discrete events (e.g., WARNING: Deprecated feature used). Traces – Application performance tracking (e.g., the time taken for communication between the web server and the database, and then back to the end user). Profiling – (Sometimes considered a fourth pillar) Detailed performance insights at the code level (e.g., how long a function takes to execute). Based on the diagram, each node contains agents that collect observability data (metrics, logs, traces, profiling) and forward it to a centralized monitoring service (a central hub that processes the data before passing it to a visualizer). For example, Prometheus (metrics monitoring) sends data to Grafana (visualization). Each node—whether a database or web server—can be a virtual machine, physical server, or more commonly, a container. CMIIW (Correct Me If I'm Wrong).

Look at this diagram:
Ignoring any specific tech stacks or tools used (i.e., tech stack agnostic), is my general understanding of the monitoring pipeline in DevOps correct?
In DevOps monitoring, there are three core pillars of observability:
- Metrics – Aggregatable numerical data (e.g., the average CPU usage over the past 3 days for all web server nodes).
- Logs – Timestamped records of discrete events (e.g., WARNING: Deprecated feature used).
- Traces – Application performance tracking (e.g., the time taken for communication between the web server and the database, and then back to the end user).
- Profiling – (Sometimes considered a fourth pillar) Detailed performance insights at the code level (e.g., how long a function takes to execute).
Based on the diagram, each node contains agents that collect observability data (metrics, logs, traces, profiling) and forward it to a centralized monitoring service (a central hub that processes the data before passing it to a visualizer). For example, Prometheus (metrics monitoring) sends data to Grafana (visualization).
Each node—whether a database or web server—can be a virtual machine, physical server, or more commonly, a container. CMIIW (Correct Me If I'm Wrong).
