


![[The AI Show Episode 147]: OpenAI Abandons For-Profit Plan, AI College Cheating Epidemic, Apple Says AI Will Replace Search Engines & HubSpot’s AI-First Scorecard](https://www.marketingaiinstitute.com/hubfs/ep%20147%20cover.png)


_Gang_Liu_Alamy.jpg?width=1280&auto=webp&quality=80&disable=upscale#)


![Review: Sonnet Echo 13 Thunderbolt 5 SSD Dock – 140W MacBook charging, 2.5GbE, up to 6000 MB/s SSD speed [Video]](https://i0.wp.com/9to5mac.com/wp-content/uploads/sites/6/2025/05/Sonnet-Echo-13-Thunderbolt-5-SSD-Dock-Review-1.jpg?resize=1200%2C628&quality=82&strip=all&ssl=1)


![Apple Planning Bezel-Free iPhone With 'Four-Sided Bending' Display [Report]](https://www.iclarified.com/images/news/97321/97321/97321-640.jpg)

![Apple Working on Brain-Controlled iPhone With Synchron [Report]](https://www.iclarified.com/images/news/97312/97312/97312-640.jpg)


Data Engineering Concepts: A project based introduction
I recently finished the Data Engineering Zoomcamp by DataTalks Club. For my certification, I was required to undertake a capstone project that would culminate in a dashboard showing insights from the data I had processed in my pipeline. Instead of a step-by-step guide (which can be easily found in the project’s README), this article explores data engineering concepts from a high-level view, explaining the decisions I made and the trade-offs I considered. Table of Contents Data Sourcing and Problem Definition Containerization Infrastructure-as-Code (IaC) Orchestration vs Automation Data Lake and Data Warehouse Analytics Engineering and Data Modeling Batch vs Streaming Exposure: Visualization and Predictions Conclusion 1. Data Sourcing and Problem Definition Before coding, I sourced the data and defined the problem. I chose the LinkedIn Job Postings dataset from Kaggle due to its richness and descriptive documentation. Problem Statement: How can data from LinkedIn job posts (2023–2024) help us make informed decisions on a career path? I then went ahead to break it down into the following issues, each of which would be addressed by a chart in my dashboard: Which job titles offer the highest salaries? Which companies, industries, and skills are the most lucrative? What percentage of companies offer remote work? What are the highest salaries and average experience levels? Which countries have the most job postings? These were, of course, not MECE-compliant. (MECE - mutually exclusive and collectively exhaustive) 2. Containerization Before I could think of extracting my data, I took a high level and long term view of my project and considered aspects such as collaboration and reproducibility. Whereas it is true that I could easily just create the pipelines and files needed on my local machine with no packaging whatsoever, this would pose a challenge to anyone who would be looking to evaluate or reproduce my project. I, hence, decided to use docker containers to package my project for replication either locally or even in the cloud. Docker containers also have other advantages such as being lightweight, easily replicable thus allowing scalability via horizontal scaling and load balancing, increases project maintainability since Dockerfiles simplify environment management, isolation between the containers prevents dependency conflicts and it supports version control via versioned images. 3. Infrastructure as Code (IaC) I would be using GCP (Google’s cloud wing) for my data lake, data warehouse and dashboard hosting and so I needed a reliable way to interact with the cloud. Infrastructure-as-Code (IaC) is the practice of managing and provisioning computing infrastructure—such as servers, networks, databases, and other resources—through machine-readable configuration files rather than through manual processes. The use of IaC tools simplifies the process of cloud infrastructure management and allows for scalability, version control, testability and automation. Apart from provisioning infrastructure, IaC tools can be used for other management activities such as enabling APIs in GCP and many more. It also allows reusability of resources since it avoids creating new resources if the defined ones already exist. Terraform is the IaC tool that I used due to how simple it is. I made it modular and included the use of variables and outputs to integrate terraform into my project’s workflow. An alternative to terraform is AWS Cloudformation which is used in AWS setups. 4. Orchestration vs Automation A data workflow is a sequence of automated data processing steps that specifies what are the steps, inputs, outputs, and dependencies in a data processing pipeline. Data workflows are also called DAGs (Directed Acyclic Graphs). Directed means they have direction, Acyclic means there are no cycles. There may be loops but no cycles are allowed. The difference between a loop and a cycle in this case is that in a loop, we know the starting and ending point. The loop ends based on whether a certain condition is met but a cycle has none. DAGs are run using tools / engines for orchestration like Apache Airflow, Luigi, Prefect, Dagster, Kestra, etc. Smaller workflows can be run using make and or cron jobs but this is usually done locally. In software engineering and data management, an orchestrator is a tool that automates, manages, and coordinates various workflows and tasks across different services, systems, or applications. Because an orchestrator allows everything to run smoothly without the need for manual intervention, it is easy to confuse orchestration with automation. Whereas automation refers to the execution of individual tasks or actions without manual intervention, orchestration goes beyond automation by managing the flow of multiple interconnected tasks or processes. Orchestration defines not only what happens but also when and

I recently finished the Data Engineering Zoomcamp by DataTalks Club. For my certification, I was required to undertake a capstone project that would culminate in a dashboard showing insights from the data I had processed in my pipeline.
Instead of a step-by-step guide (which can be easily found in the project’s README), this article explores data engineering concepts from a high-level view, explaining the decisions I made and the trade-offs I considered.
Table of Contents
- Data Sourcing and Problem Definition
- Containerization
- Infrastructure-as-Code (IaC)
- Orchestration vs Automation
- Data Lake and Data Warehouse
- Analytics Engineering and Data Modeling
- Batch vs Streaming
- Exposure: Visualization and Predictions
- Conclusion
1. Data Sourcing and Problem Definition
Before coding, I sourced the data and defined the problem. I chose the LinkedIn Job Postings dataset from Kaggle due to its richness and descriptive documentation.
Problem Statement:
How can data from LinkedIn job posts (2023–2024) help us make informed decisions on a career path?
I then went ahead to break it down into the following issues, each of which would be addressed by a chart in my dashboard:
- Which job titles offer the highest salaries?
- Which companies, industries, and skills are the most lucrative?
- What percentage of companies offer remote work?
- What are the highest salaries and average experience levels?
- Which countries have the most job postings?
These were, of course, not MECE-compliant. (MECE - mutually exclusive and collectively exhaustive)
2. Containerization
Before I could think of extracting my data, I took a high level and long term view of my project and considered aspects such as collaboration and reproducibility. Whereas it is true that I could easily just create the pipelines and files needed on my local machine with no packaging whatsoever, this would pose a challenge to anyone who would be looking to evaluate or reproduce my project. I, hence, decided to use docker containers to package my project for replication either locally or even in the cloud.
Docker containers also have other advantages such as being lightweight, easily replicable thus allowing scalability via horizontal scaling and load balancing, increases project maintainability since Dockerfiles simplify environment management, isolation between the containers prevents dependency conflicts and it supports version control via versioned images.
3. Infrastructure as Code (IaC)
I would be using GCP (Google’s cloud wing) for my data lake, data warehouse and dashboard hosting and so I needed a reliable way to interact with the cloud. Infrastructure-as-Code (IaC) is the practice of managing and provisioning computing infrastructure—such as servers, networks, databases, and other resources—through machine-readable configuration files rather than through manual processes.
The use of IaC tools simplifies the process of cloud infrastructure management and allows for scalability, version control, testability and automation. Apart from provisioning infrastructure, IaC tools can be used for other management activities such as enabling APIs in GCP and many more. It also allows reusability of resources since it avoids creating new resources if the defined ones already exist.
Terraform is the IaC tool that I used due to how simple it is. I made it modular and included the use of variables and outputs to integrate terraform into my project’s workflow. An alternative to terraform is AWS Cloudformation which is used in AWS setups.
4. Orchestration vs Automation
A data workflow is a sequence of automated data processing steps that specifies what are the steps, inputs, outputs, and dependencies in a data processing pipeline. Data workflows are also called DAGs (Directed Acyclic Graphs). Directed means they have direction, Acyclic means there are no cycles. There may be loops but no cycles are allowed. The difference between a loop and a cycle in this case is that in a loop, we know the starting and ending point. The loop ends based on whether a certain condition is met but a cycle has none. DAGs are run using tools / engines for orchestration like Apache Airflow, Luigi, Prefect, Dagster, Kestra, etc. Smaller workflows can be run using make and or cron jobs but this is usually done locally.
In software engineering and data management, an orchestrator is a tool that automates, manages, and coordinates various workflows and tasks across different services, systems, or applications. Because an orchestrator allows everything to run smoothly without the need for manual intervention, it is easy to confuse orchestration with automation.
Whereas automation refers to the execution of individual tasks or actions without manual intervention, orchestration goes beyond automation by managing the flow of multiple interconnected tasks or processes. Orchestration defines not only what happens but also when and how things happen, ensuring that all tasks (whether automated or not) are executed in the correct order, with the right dependencies and error handling in place. While automation focuses on individual tasks, orchestration ensures all those tasks are arranged and managed within a broader, cohesive system. This matters if you need to reliably handle complex processes with many interdependent steps.
Use cases for automation include automated testing after code commits, automated backups and automated email notifications. Use cases for orchestration include data pipeline orchestration, CI/CD pipeline orchestration and cloud infrastructure orchestration.
Advantages of workflow orchestration include:
- Scalability
- Error handling and resilience
- Improved monitoring and control
- Process standardization
- Faster time to value since no need to reinvent the wheel
What’s the Difference?
| Category | Automation | Orchestration |
|---|---|---|
| Scope | Single task execution | Coordination of multiple tasks |
| Focus | Efficiency of individual actions | Dependency management, error handling |
| Example | Automated backups | CI/CD pipelines, data pipeline scheduling |
For my workflow orchestration tool, I chose Apache Airflow because it is the most common in the industry. I built Airflow using a docker-compose.yml file and Dockerfile which installs google sdk (a way to interact with GCP). I then created a dag that had multiple steps which include downloading, unzipping and uploading the data to the created gcs bucket.

Why I Used Apache Airflow
- Industry standard for DAG orchestration
- Allows complex workflows
- Supports retries, alerts, and dependency management
- Easily containerized using
docker-compose.ymland customDockerfile
5. Data Lake vs Data Warehouse
Data Lake
A data lake is a centralized repository that allows you to store structured, semi-structured, and unstructured data at any scale, in its raw, native format until it's needed for analysis.
Features of a data lake:
- Allows ingestion of structured and unstructured data
- Catalogs and indexes data for analysis without data movement
- Stores, secures and protects data at an unlimited scale
- Connects data with analytics and ML tools
Why do we need a data lake:
- Companies realized the value of data
- Allows for quick storage and access of data (contingent on tier if S3)
- It is hard to always be able to define the structure of data at the onset
- Data usefulness is sometimes realized later in the project lifecycle
- R&D on data products requires huge amounts of data
- The need for cheap storage of Big Data
Cloud providers of data lakes include Google Cloud Storage by GCP, S3 by AWS and Azure Blob by Azure.
Dangers in a data lake:
- Conversion into a data swamp (disorganized, inaccessible, and untrustworthy data lake)
- No versioning
- Incompatible schemas for same data without versioning
- No metadata associated
- Joins not possible
Data Warehouse
A data warehouse is a centralized, structured repository designed to store, manage, and analyze large volumes of cleaned and organized data from multiple sources to support business intelligence (BI), reporting, and decision-making. This is where we have the partitioning and clustering capabilities.
| Feature | Data Lake | Data Warehouse |
|---|---|---|
| Data Type | Raw (structured + unstructured) | Refined (structured only) |
| Purpose | Storage for future use | Fast analytics & reporting |
| Design | Schema-on-read | Schema-on-write |
| Example Tool | Google Cloud Storage | BigQuery, Redshift, Snowflake |
Data warehouse cloud providers include GCP BigQuery, Amazon Redshift and Snowflake by Azure.
Additional Topics about Data Warehousing
Unbundling
Data warehouse unbundling is the process of breaking apart a traditional, monolithic data warehouse into distinct, independently scalable components. In practice, this involves decoupling ingestion, storage, processing and compute allowing the following:
- Scale the the two independently
- Adopt best-of-breed tools because of modularity leading to better performance, agility and innovation.
- Improve agility and maintenance
Not all data warehouses are unbundled so be sure to check out if the one you want to use is.
OLAP vs OLTP:
Online analytical processing (OLAP) and online transaction processing (OLTP) are data processing systems that help you store and analyze business data. You can collect and store data from multiple sources—such as websites, applications, smart meters, and internal systems. OLAP combines and groups the data so you can analyze it from different points of view. Conversely, OLTP stores and updates transactional data reliably and efficiently in high volumes. OLTP databases can be one among several data sources for an OLAP system. Both online analytical processing (OLAP) and online transaction processing (OLTP) are database management systems for storing and processing data in large volumes.
The primary purpose of online analytical processing (OLAP) is to analyze aggregated data, while the primary purpose of online transaction processing (OLTP) is to process database transactions. You use OLAP systems to generate reports, perform complex data analysis, and identify trends. In contrast, you use OLTP systems to process orders, update inventory, and manage customer accounts. A data warehouse is an OLAP solution.
| Feature | OLTP | OLAP |
|---|---|---|
| Purpose | Manage and process real-time transactions/business operations | Analyze large volumes of data to support decision-making |
| Data Updates | Short, fast updates initiated by users | Data periodically refreshed with scheduled, long-running batch jobs |
| Database Design | Normalized databases for efficiency and consistency | Denormalized databases using star/snowflake schemas for analytical queries |
| Space Requirements | Generally small (if historical data is archived) | Generally large due to aggregating large datasets |
| Response Time | Milliseconds – optimized for speed | Seconds or minutes – optimized for complex queries |
| Backup and Recovery | Frequent backups required for business continuity | Data can be reloaded from OLTP systems in lieu of regular backups |
| Productivity | Increases productivity of end-users and transaction handlers | Increases productivity of analysts, executives, and decision-makers |
| Data View | Detailed, day-to-day business transactions | Aggregated, multi-dimensional view of enterprise data |
| Example Applications | Order processing, payments, inventory updates | Trend analysis, forecasting, executive dashboards |
| User Examples | Customer-facing staff, clerks, online shoppers | Business analysts, data scientists, senior management |
| Data Structure | Row-based storage | Columnar storage (in most modern OLAP systems like BigQuery, Redshift, etc.) |
| Examples by Provider | Google Cloud SQL, Amazon Aurora, Cloud Spanner | BigQuery, Amazon Redshift, Snowflake |
6. Analytics Engineering and Data Modeling
What Is Analytics Engineering?
Analytics engineering is a field that seeks to bridge the gap between data engineering and data analysis. It introduces good software engineering practices (such as modularity, version control, testing, documentation and DRY) to the efforts of data analysts and data scientists. This is done by the use of tools such as dbt, dataform, aws glue and sqlmesh.
Data Modeling:
Data modelling is the process of defining and organizing the structure of data within a system or database to ensure consistency, clarity, and usability. It involves creating abstract representations (models) of how data is stored, connected, and processed. There are three levels of data models:
- Conceptual - High-level view of business entities and relationships (dimensions tables)
- Logical - Defines the structure and attributes of data without database-specific constraints. Measurements, metrics or facts (Facts tables)
- Physical - Maps the logical model to actual database schemas, tables, indexes, and storage.
ETL vs ELT
We can either use ELT or ETL when transforming data. The letters represent the same words (Extract, Load, Transform) but the order matters.
| Feature | ETL | ELT |
|---|---|---|
| Data Volume | Small | Large |
| Transformation Time | Before loading | After loading |
| Flexibility | Lower | Higher |
| Cost | Higher compute | Lower overall |
In terms of data modelling, I used cloud dbt because it is easy to use and allows for integration with Github. It does have a limit of one dbt project for the non-premium account so I did have to delete a previous project.
Instead of having data duplication by uploading all my data from the GCS bucket into BigQuery, I used dbt to create external tables which reference data without having to load it into BigQuery’s native storage. The trade off here is that performance in areas such as access and querying may be a little slow due to on-the-fly reading.
I also used dbt to partition and cluster my tables in bigQuery. Partitioning splits a table into segments (partitions) based on the values of a specific column (usually date/time or integer range). Each partition stores a subset of the table’s data, and queries can skip entire partitions that aren’t relevant. The same query processes less data for a partitioned table than for a non-partitioned table thus saving both time and money for queries that are frequently run. You can have a maximum of 4000 partitions in a table.
Clustering, on the other hand, organizes rows within a partition (or unpartitioned table) based on the values in one or more columns. It enables fine-grained pruning of data during query execution and optimizes filter operations, joins and aggregations by organizing data on disk. You can specify up to 4 columns to cluster by; They must be top level and non-repeated fields. Big query performs automatic reclustering for newly added data at no cost.
| Feature | Partitioning | Clustering |
|---|---|---|
| Granularity | Coarse (splits table into partitions) | Fine (organizes rows within partitions/tables) |
| Basis | One column (DATE/TIMESTAMP/INTEGER) | Up to 4 columns (any type) |
| Performance | Skips entire partitions | Skips blocks of rows within a table |
| Cost Efficiency | Reduces scan by entire partitions. Cost is predictable | Reduces scan via pruning but cost benefit varies |
| Storage Layout | Logical partitioning (physically separated partitions) | Physical sorting within storage blocks |
| Best Used For | Time-series or log data | Frequently filtered or grouped columns with repetition |
| Limitations | Max 4000 partitions per table | Max 4 clustering columns; no nested/repeated fields |
7. Batch vs Streaming
In data engineering and big data, there is usually large amounts of data being generated all the time. A data engineer will thus need to decide whether to process the data as it comes (streaming) or batch it up and process it as intervals.
How to decide between streaming and batch
A good heuristic to follow is to only use streaming when there is an automated response to the data at the end of the pipeline instead of just a human analyst looking at the data (that'd be over engineering). As such, use cases for streaming include fraud detection, hacked account detection and surge pricing (uber).
Batch is best for use cases where data is generated in large volumes but not continuously and can be processed in intervals. You can even use micro batching (15 and 60 minute batches) in case you have a lot of data but not enough to justify streaming.
Streaming uses a pub-sub model where publishers publish data and subscribers read and process this data. Data is transmitted in packets known as topics and each topic stores it’s own timestamp.
The use cases for streaming in analytical data is low (which is the main data that data engineers mostly use). Streaming is more like owning a server, website or rest API rather than a batch pipeline or offline process. It is much more complex and some organizations even have different names for batch and streaming data engineers. (e.g., at Netflix, Data engineers handle batch processing whereas SWE, data handle stream data processing).
In terms of technology, Apache spark is used for batch processing, Apache Kafka is used for streaming and Apache Flink supports both batch and stream processing but it was built for stream processing.
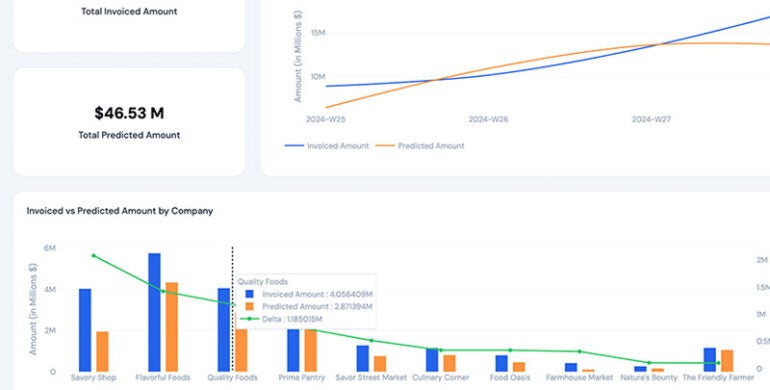
8. Exposure: Visualization and Predictions
In data engineering - especially in the context of modern data tooling like dbt - an exposure refers to the end-use or downstream dependency of data models that shows where and how the data is being used outside of the transformation layer. Example exposures can be assets such as dashboards, machine learning models, external reports and APIs.
My exposure was, of course, the Looker Studio dashboard (shown below).

I only used my final fact table in the dashboard as I had condensed all my previous staging and dimension tables into it using dbt.

Some of the insights I got were that:
- Software development is the highest paying industry.
- Top-paying skills: Sales, IT, Management, Manufacturing
- Average required experience: 6 years
Conclusion
I learned a lot during the Zoomcamp and capstone project. The hands-on nature, real-world tooling, and community support made the journey insightful and practical.
If you're interested in data engineering, I highly recommend joining a live cohort of the DataTalks Club Zoomcamp to get the full experience and earn certification.
This article was just a high-level tour of the data engineering landscape—feel free to dig deeper into any concept that intrigued you.
Bon voyage!