


![Epic Games: Fortnite is offline for Apple devices worldwide after app store rejection [updated]](https://helios-i.mashable.com/imagery/articles/00T6DmFkLaAeJiMZlCJ7eUs/hero-image.fill.size_1200x675.v1747407583.jpg)


![[The AI Show Episode 146]: Rise of “AI-First” Companies, AI Job Disruption, GPT-4o Update Gets Rolled Back, How Big Consulting Firms Use AI, and Meta AI App](https://www.marketingaiinstitute.com/hubfs/ep%20146%20cover.png)


.png?width=1920&height=1920&fit=bounds&quality=70&format=jpg&auto=webp#)


-xl-(1)-xl-xl.jpg)


![‘Apple in China’ book argues that the iPhone could be killed overnight [Updated]](https://i0.wp.com/9to5mac.com/wp-content/uploads/sites/6/2025/05/Apple-in-China-review.jpg?resize=1200%2C628&quality=82&strip=all&ssl=1)


![What’s new in Android’s May 2025 Google System Updates [U: 5/16]](https://i0.wp.com/9to5google.com/wp-content/uploads/sites/4/2025/01/google-play-services-1.jpg?resize=1200%2C628&quality=82&strip=all&ssl=1)


![iPhone 17 Air Could Get a Boost From TDK's New Silicon Battery Tech [Report]](https://www.iclarified.com/images/news/97344/97344/97344-640.jpg)
![Vision Pro Owners Say They Regret $3,500 Purchase [WSJ]](https://www.iclarified.com/images/news/97347/97347/97347-640.jpg)
![Apple Showcases 'Magnifier on Mac' and 'Music Haptics' Accessibility Features [Video]](https://www.iclarified.com/images/news/97343/97343/97343-640.jpg)
![Sony WH-1000XM6 Unveiled With Smarter Noise Canceling and Studio-Tuned Sound [Video]](https://www.iclarified.com/images/news/97341/97341/97341-640.jpg)


![Apple Stops Signing iPadOS 17.7.7 After Reports of App Login Issues [Updated]](https://images.macrumors.com/t/DoYicdwGvOHw-VKkuNvoxYs3pfo=/1920x/article-new/2023/06/ipados-17.jpg)

![Apple Pay, Apple Card, Wallet and Apple Cash Currently Experiencing Service Issues [Update: Fixed]](https://images.macrumors.com/t/RQPLZ_3_iMyj3evjsWnMLVwPdyA=/1600x/article-new/2023/11/apple-pay-feature-dynamic-island.jpg)


Replicating Grafana via Provisioning
This guide describes a simple way of exporting configuration from a running Grafana instance, baking provisioning scripts from the configuration, and setting up new Grafana instances based on the exported configuration via the provisioning feature. Only basic configuration is exported: dashboards and data sources. If you need to replicate also alerts, users, or other stuff, you should adjust the script in the guide. Export configuration from Grafana This section describes how you can export configuration from an existing Grafana instance Generate an API token If you do not have an API token, go to UI and generate it: Grafana dashboard -> Administration -> Users and Access -> Create Service Account -> Add token Shell script to export configurations The following shell script uses the API token to fetch configurations from Grafana, then it converts the data to a set of YAML and JSON files that can be used for provisioning a new Grafana instance further. The following parameters should be set in the script: - the URL of the existing Grafana instance, accessible to the script. Example: http://127.0.0.1:3000 - the service account API key you generated in the previous step. Example: glsa_xzWpKux0iIJXdhM123dQO0aHaoVS_fa5a - the directory where the results will be saved. Example: /home/admin/grafana-exported-data #!/bin/bash set -e # CONFIG GRAFANA_URL="" API_KEY="" EXPORT_DIR="" DASHBOARDS_DIR="$EXPORT_DIR/dashboards" DATASOURCE_YAML="$EXPORT_DIR/datasource.yaml" DASHBOARD_LOADER_YAML="$EXPORT_DIR/dashboards.yaml" # Prepare directories mkdir -p "$DASHBOARDS_DIR" rm -f "$DATASOURCE_YAML" "$DASHBOARD_LOADER_YAML" echo "[*] Exporting dashboards..." # Get all dashboards DASHBOARDS=$(curl -s -H "Authorization: Bearer $API_KEY" "$GRAFANA_URL/api/search?type=dash-db") echo "$DASHBOARDS" | jq -c '.[]' | while read -r row; do DASH_UID=$(echo "$row" | jq -r '.uid') TITLE=$(echo "$row" | jq -r '.title' | tr ' ' '_' | tr -dc '[:alnum:]_') echo " -> $TITLE (uid: $DASH_UID)" curl -s -H "Authorization: Bearer $API_KEY" "$GRAFANA_URL/api/dashboards/uid/$DASH_UID" \ | jq '.dashboard' \ > "$DASHBOARDS_DIR/$TITLE.json" done echo "[*] Exporting data sources..." # Get data sources DATASOURCES=$(curl -s -H "Authorization: Bearer $API_KEY" "$GRAFANA_URL/api/datasources") # Convert to provisioning YAML echo "apiVersion: 1" > "$DATASOURCE_YAML" echo "datasources:" >> "$DATASOURCE_YAML" echo "$DATASOURCES" | jq -c '.[]' | while read -r ds; do NAME=$(echo "$ds" | jq -r '.name') TYPE=$(echo "$ds" | jq -r '.type') URL=$(echo "$ds" | jq -r '.url') ACCESS=$(echo "$ds" | jq -r '.access') IS_DEFAULT=$(echo "$ds" | jq -r '.isDefault') echo " - name: \"$NAME\"" >> "$DATASOURCE_YAML" echo " type: \"$TYPE\"" >> "$DATASOURCE_YAML" echo " access: \"$ACCESS\"" >> "$DATASOURCE_YAML" echo " url: \"$URL\"" >> "$DATASOURCE_YAML" echo " isDefault: $IS_DEFAULT" >> "$DATASOURCE_YAML" done echo "[*] Writing dashboards loader YAML..." cat GuiMiddleware (uid: dewer) -> HW_Monitoring (uid: tbgfdvsda) -> Loki_stack_monitoring_Promtail_Loki (uid: loki_limpopo) -> Sales_Monitor (uid: ilokutyuj) -> System_overview (uid: ertgfyj) [*] Exporting data sources... [*] Writing dashboards loader YAML... [✔] Export complete. Files saved to: /home/admin/grafana-exported-data Spin up a new Grafana instance with provisioning This section describes how to spin up a new Grafana instance using the data exported in the previous section for provisioning the new instance. Create a new folder structure mkdir -p ~/grafana/provisioning/dashboards mkdir -p ~/grafana/provisioning/datasources mkdir -p ~/grafana/data Copy exported data to the new folders cp /home/admin/grafana-exported-data/dashboards/* ~/grafana/provisioning/dashboards/ cp /home/admin/grafana-exported-data/dashboards.yaml ~/grafana/provisioning/dashboards/dashboards.yaml cp /home/admin/grafana-exported-data/datasource.yaml ~/grafana/provisioning/datasources/datasource.yaml Start the docker container podman run -d \ --name grafana-alt \ -p 4000:3000 \ -v ~/grafana/data:/var/lib/grafana:z \ -v ~/grafana/provisioning/dashboards:/etc/grafana/provisioning/dashboards:z \ -v ~/grafana/provisioning/datasources:/etc/grafana/provisioning/datasources:z \ -v ~/grafana/provisioning/dashboards/dashboards.yaml:/etc/grafana/provisioning/dashboards/dashboards.yaml:z \ -e GF_SECURITY_ADMIN_USER=admin \ -e GF_SECURITY_ADMIN_PASSWORD=admin \ grafana/grafana-oss:latest Navigate to Grafana UI and check Go to the new Grafana UI (port 4000 in our example). The default password/username combination is admin/admin, it will ask you to set up a new password right after login. Now go check the dashboards and data sources, they should be all in place, the same as in the original Grafana inst
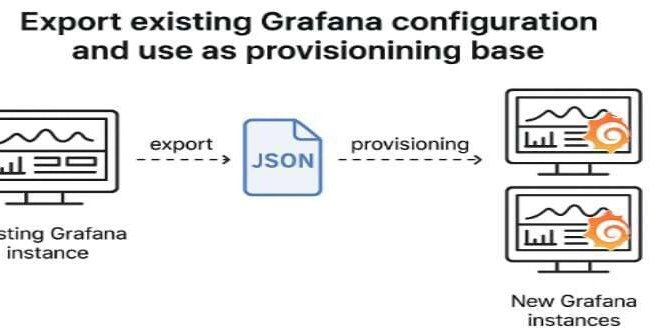
This guide describes a simple way of exporting configuration from a running Grafana instance, baking provisioning scripts from the configuration, and setting up new Grafana instances based on the exported configuration via the provisioning feature.
Only basic configuration is exported: dashboards and data sources. If you need to replicate also alerts, users, or other stuff, you should adjust the script in the guide.
Export configuration from Grafana
This section describes how you can export configuration from an existing Grafana instance
Generate an API token
If you do not have an API token, go to UI and generate it: Grafana dashboard -> Administration -> Users and Access -> Create Service Account -> Add token
Shell script to export configurations
The following shell script uses the API token to fetch configurations from Grafana, then it converts the data to a set of YAML and JSON files that can be used for provisioning a new Grafana instance further.
The following parameters should be set in the script:
-
http://127.0.0.1:3000 -
glsa_xzWpKux0iIJXdhM123dQO0aHaoVS_fa5a -
/home/admin/grafana-exported-data
#!/bin/bash
set -e

# CONFIG
GRAFANA_URL=""
API_KEY=""
EXPORT_DIR=""
DASHBOARDS_DIR="$EXPORT_DIR/dashboards"
DATASOURCE_YAML="$EXPORT_DIR/datasource.yaml"
DASHBOARD_LOADER_YAML="$EXPORT_DIR/dashboards.yaml"

# Prepare directories
mkdir -p "$DASHBOARDS_DIR"
rm -f "$DATASOURCE_YAML" "$DASHBOARD_LOADER_YAML"

echo "[*] Exporting dashboards..."

# Get all dashboards
DASHBOARDS=$(curl -s -H "Authorization: Bearer $API_KEY" "$GRAFANA_URL/api/search?type=dash-db")

echo "$DASHBOARDS" | jq -c '.[]' | while read -r row; do
    DASH_UID=$(echo "$row" | jq -r '.uid')
    TITLE=$(echo "$row" | jq -r '.title' | tr ' ' '_' | tr -dc '[:alnum:]_')
    echo "  -> $TITLE (uid: $DASH_UID)"

    curl -s -H "Authorization: Bearer $API_KEY" "$GRAFANA_URL/api/dashboards/uid/$DASH_UID" \
        | jq '.dashboard' \
        > "$DASHBOARDS_DIR/$TITLE.json"
done

echo "[*] Exporting data sources..."

# Get data sources
DATASOURCES=$(curl -s -H "Authorization: Bearer $API_KEY" "$GRAFANA_URL/api/datasources")

# Convert to provisioning YAML
echo "apiVersion: 1" > "$DATASOURCE_YAML"
echo "datasources:" >> "$DATASOURCE_YAML"

echo "$DATASOURCES" | jq -c '.[]' | while read -r ds; do
    NAME=$(echo "$ds" | jq -r '.name')
    TYPE=$(echo "$ds" | jq -r '.type')
    URL=$(echo "$ds" | jq -r '.url')
    ACCESS=$(echo "$ds" | jq -r '.access')
    IS_DEFAULT=$(echo "$ds" | jq -r '.isDefault')

    echo "  - name: \"$NAME\"" >> "$DATASOURCE_YAML"
    echo "    type: \"$TYPE\"" >> "$DATASOURCE_YAML"
    echo "    access: \"$ACCESS\"" >> "$DATASOURCE_YAML"
    echo "    url: \"$URL\"" >> "$DATASOURCE_YAML"
    echo "    isDefault: $IS_DEFAULT" >> "$DATASOURCE_YAML"
done

echo "[*] Writing dashboards loader YAML..."

cat < "$DASHBOARD_LOADER_YAML"
apiVersion: 1

providers:
  - name: 'default'
    orgId: 1
    folder: ''
    type: file
    options:
      path: /etc/grafana/provisioning/dashboards
      watch_interval: 10s
      allowUiUpdates: true
EOF

echo "[✔] Export complete. Files saved to: $EXPORT_DIR"
Make sure the script has 'x' attirbute set: chmod +x grafana-export.sh
Now you run the script. If successful, you should see something like this:
[*] Exporting dashboards...
  -> GuiMiddleware (uid: dewer)
  -> HW_Monitoring (uid: tbgfdvsda)
  -> Loki_stack_monitoring_Promtail_Loki (uid: loki_limpopo)
  -> Sales_Monitor (uid: ilokutyuj)
  -> System_overview (uid: ertgfyj)
[*] Exporting data sources...
[*] Writing dashboards loader YAML...
[✔] Export complete. Files saved to: /home/admin/grafana-exported-data
Spin up a new Grafana instance with provisioning
This section describes how to spin up a new Grafana instance using the data exported in the previous section for provisioning the new instance.
Create a new folder structure
mkdir -p ~/grafana/provisioning/dashboards
mkdir -p ~/grafana/provisioning/datasources
mkdir -p ~/grafana/data
Copy exported data to the new folders
cp /home/admin/grafana-exported-data/dashboards/* ~/grafana/provisioning/dashboards/
cp /home/admin/grafana-exported-data/dashboards.yaml ~/grafana/provisioning/dashboards/dashboards.yaml
cp /home/admin/grafana-exported-data/datasource.yaml ~/grafana/provisioning/datasources/datasource.yaml
Start the docker container
podman run -d \
  --name grafana-alt \
  -p 4000:3000 \
  -v ~/grafana/data:/var/lib/grafana:z \
  -v ~/grafana/provisioning/dashboards:/etc/grafana/provisioning/dashboards:z \
  -v ~/grafana/provisioning/datasources:/etc/grafana/provisioning/datasources:z \
  -v ~/grafana/provisioning/dashboards/dashboards.yaml:/etc/grafana/provisioning/dashboards/dashboards.yaml:z \
  -e GF_SECURITY_ADMIN_USER=admin \
  -e GF_SECURITY_ADMIN_PASSWORD=admin \
  grafana/grafana-oss:latest
Navigate to Grafana UI and check
Go to the new Grafana UI (port 4000 in our example). The default password/username combination is admin/admin, it will ask you to set up a new password right after login.
Now go check the dashboards and data sources, they should be all in place, the same as in the original Grafana instance.
Conclusion
This approach can be used for replicating Grafana based on a pre-defined configuration. For automation of the deployment process, you should adapt the YAML provisioning scripts to a special software like Puppet, Ansible, or another.


