


![[The AI Show Episode 143]: ChatGPT Revenue Surge, New AGI Timelines, Amazon’s AI Agent, Claude for Education, Model Context Protocol & LLMs Pass the Turing Test](https://www.marketingaiinstitute.com/hubfs/ep%20143%20cover.png)


![From drop-out to software architect with Jason Lengstorf [Podcast #167]](https://cdn.hashnode.com/res/hashnode/image/upload/v1743796461357/f3d19cd7-e6f5-4d7c-8bfc-eb974bc8da68.png?#)


![What are the Best Practices for Structuring Modern Website Design and Development Services for Scalable Projects? [closed]](https://cdn.sstatic.net/Sites/softwareengineering/Img/apple-touch-icon@2.png?v=1ef7363febba)


.png?width=1920&height=1920&fit=bounds&quality=70&format=jpg&auto=webp#)


.jpg?#)


.png?width=1920&height=1920&fit=bounds&quality=70&format=jpg&auto=webp#)


_ArtemisDiana_Alamy.jpg?#)


-xl.jpg)


![Yes, the Gemini icon is now bigger and brighter on Android [U]](https://i0.wp.com/9to5google.com/wp-content/uploads/sites/4/2025/02/Gemini-on-Galaxy-S25.jpg?resize=1200%2C628&quality=82&strip=all&ssl=1)


![Apple Rushes Five Planes of iPhones to US Ahead of New Tariffs [Report]](https://www.iclarified.com/images/news/96967/96967/96967-640.jpg)
![Apple Vision Pro 2 Allegedly in Production Ahead of 2025 Launch [Rumor]](https://www.iclarified.com/images/news/96965/96965/96965-640.jpg)


Navigating Stormy Seas: Troubleshooting Pirate Weather’s Container Memory Usage with AWS Container Insights
Running applications in containers provides numerous benefits—easy deployments, rapid scaling, streamlined updates, and more. However, troubleshooting and maintaining observability can become challenging, especially when containers run in cloud environments. Issues that didn't surface during testing might appear suddenly in production, and without direct access to underlying processes, diagnosing root causes can quickly become complex. This exact scenario happened to us recently at Pirate Weather, where unexpected container failures led to brief and seemingly random downtime incidents. As outlined previously in our infrastructure overview, Pirate Weather’s production stack is hosted on Amazon Elastic Container Service (Amazon ECS), utilizing a series of ECS tasks managed by a single ECS service. Our service ensures high availability by maintaining at least two tasks running at all times, each task consisting of three distinct containers. Behind these tasks, we leverage auto-scaling EC2 instances to handle dynamic workloads. When we began experiencing intermittent downtime, our initial investigation revealed ECS tasks failing with the infamous "Error 137," indicating that containers were terminated due to exceeding memory limits. Although this was a helpful clue, we still didn't know which specific container was responsible or whether the issue stemmed from sudden memory spikes or gradual leaks. Initially, our monitoring setup involved using the Kong Prometheus plugin, but this provided insights only at the API gateway level, not deep within our ECS infrastructure. Seeking a more comprehensive solution, we discovered AWS Container Insights, a built-in feature of Amazon CloudWatch that offers detailed metrics and logs for containers running on Amazon ECS. Enabling AWS Container Insights was incredibly straightforward—just a single click in our ECS task definition settings, a quick update to our ECS service, and within minutes, we had detailed container-level metrics on CPU utilization, storage I/O, and crucially, memory usage available directly in CloudWatch. Arguably one of the easiest yet most impactful updates we’ve ever made! After collecting data for a couple of days (and observing several more restarts), we revisited CloudWatch. The depth of data was impressive—almost overwhelming at first glance—but by filtering on key parameters like ClusterName, ContainerName, and ServiceName, we quickly identified the culprit. Our "TimeMachine" container, responsible for handling historical data requests, was steadily leaking memory and occasionally experiencing significant spikes. These spikes caused it to exceed its allocated memory, resulting in container termination and subsequent stack downtime. While a complete, permanent solution requires deeper investigation into the memory leak, AWS Container Insights provided immediate actionable insights, enabling us to implement two effective short-term solutions: We modified our task definition to include the --limit-max-requests=25 flag in our Uvicorn Docker command, automatically restarting worker processes within the container to mitigate the slow memory leak. We leveraged ECS's newly available container restart policy, enabling graceful restarts of our TimeMachine container upon memory overload events. This ensured only the problematic container restarted rather than impacting the entire ECS task. Though further work is needed for a long-term fix, activating AWS Container Insights significantly streamlined our troubleshooting process, demonstrating the immense value this tool offers for quickly diagnosing and resolving container-related issues.
Running applications in containers provides numerous benefits—easy deployments, rapid scaling, streamlined updates, and more. However, troubleshooting and maintaining observability can become challenging, especially when containers run in cloud environments. Issues that didn't surface during testing might appear suddenly in production, and without direct access to underlying processes, diagnosing root causes can quickly become complex. This exact scenario happened to us recently at Pirate Weather, where unexpected container failures led to brief and seemingly random downtime incidents.
As outlined previously in our infrastructure overview, Pirate Weather’s production stack is hosted on Amazon Elastic Container Service (Amazon ECS), utilizing a series of ECS tasks managed by a single ECS service. Our service ensures high availability by maintaining at least two tasks running at all times, each task consisting of three distinct containers. Behind these tasks, we leverage auto-scaling EC2 instances to handle dynamic workloads.
When we began experiencing intermittent downtime, our initial investigation revealed ECS tasks failing with the infamous "Error 137," indicating that containers were terminated due to exceeding memory limits. Although this was a helpful clue, we still didn't know which specific container was responsible or whether the issue stemmed from sudden memory spikes or gradual leaks.
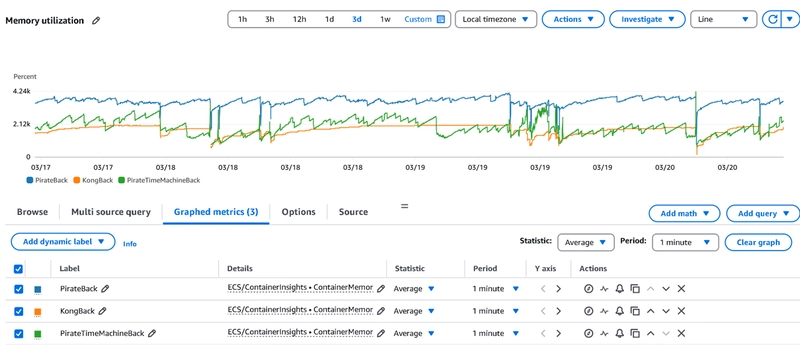
Initially, our monitoring setup involved using the Kong Prometheus plugin, but this provided insights only at the API gateway level, not deep within our ECS infrastructure. Seeking a more comprehensive solution, we discovered AWS Container Insights, a built-in feature of Amazon CloudWatch that offers detailed metrics and logs for containers running on Amazon ECS.
Enabling AWS Container Insights was incredibly straightforward—just a single click in our ECS task definition settings, a quick update to our ECS service, and within minutes, we had detailed container-level metrics on CPU utilization, storage I/O, and crucially, memory usage available directly in CloudWatch. Arguably one of the easiest yet most impactful updates we’ve ever made!
After collecting data for a couple of days (and observing several more restarts), we revisited CloudWatch. The depth of data was impressive—almost overwhelming at first glance—but by filtering on key parameters like ClusterName, ContainerName, and ServiceName, we quickly identified the culprit. Our "TimeMachine" container, responsible for handling historical data requests, was steadily leaking memory and occasionally experiencing significant spikes. These spikes caused it to exceed its allocated memory, resulting in container termination and subsequent stack downtime.
While a complete, permanent solution requires deeper investigation into the memory leak, AWS Container Insights provided immediate actionable insights, enabling us to implement two effective short-term solutions:
We modified our task definition to include the --limit-max-requests=25 flag in our Uvicorn Docker command, automatically restarting worker processes within the container to mitigate the slow memory leak.
We leveraged ECS's newly available container restart policy, enabling graceful restarts of our TimeMachine container upon memory overload events. This ensured only the problematic container restarted rather than impacting the entire ECS task.
Though further work is needed for a long-term fix, activating AWS Container Insights significantly streamlined our troubleshooting process, demonstrating the immense value this tool offers for quickly diagnosing and resolving container-related issues.