


![[The AI Show Episode 146]: Rise of “AI-First” Companies, AI Job Disruption, GPT-4o Update Gets Rolled Back, How Big Consulting Firms Use AI, and Meta AI App](https://www.marketingaiinstitute.com/hubfs/ep%20146%20cover.png)


.jpg?width=1920&height=1920&fit=bounds&quality=70&format=jpg&auto=webp#)


_Brian_Jackson_Alamy.jpg?width=1280&auto=webp&quality=80&disable=upscale#)

_Steven_Jones_Alamy.jpg?width=1280&auto=webp&quality=80&disable=upscale#)


 Stolen 884,000 Credit Card Details on 13 Million Clicks from Users Worldwide.webp?#)


![Google rolling out Nest Wifi Pro April 2025 update [U]](https://i0.wp.com/9to5google.com/wp-content/uploads/sites/4/2022/10/Nest-Wifi-Pro-1.jpg?resize=1200%2C628&quality=82&strip=all&ssl=1)


![Apple Seeds visionOS 2.5 RC to Developers [Download]](https://www.iclarified.com/images/news/97240/97240/97240-640.jpg)
![Apple Seeds tvOS 18.5 RC to Developers [Download]](https://www.iclarified.com/images/news/97243/97243/97243-640.jpg)

![Apple Releases macOS Sequoia 15.5 RC to Developers [Download]](https://www.iclarified.com/images/news/97245/97245/97245-640.jpg)


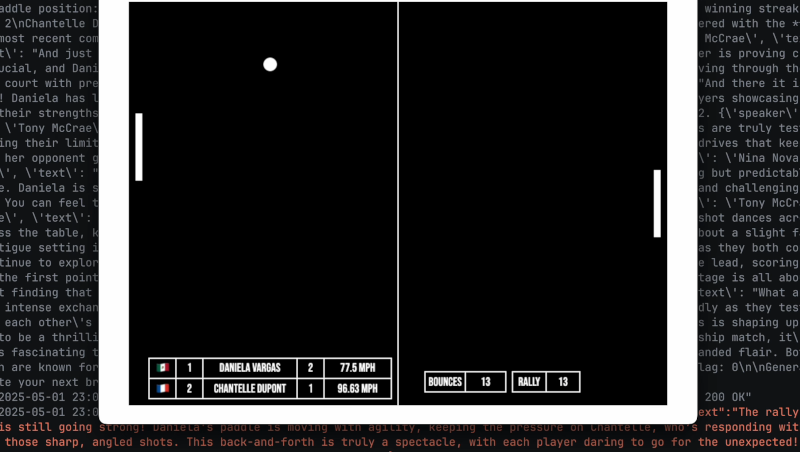
Learn to Track Bitcoin Prices Every Minute with MongoDB Charts!
Hello DEV community! I just dropped a hands‑on walkthrough showing how to stream in BTCUSD price ticks into MongoDB Time Series collections—and turn them into live, interactive charts with Atlas Charts. No React, no D3—just configuration and a few clicks. Why You’ll Love It Real‑Time Insights: Capture and visualize price swings as they happen. Low‑Code Setup: Skip the boilerplate; get straight to analysis on the free tier. Data Modeling Best Practices: Structure your time series for lightning‑fast queries. Outlier & Volatility Detection: Learn simple techniques to surface critical market events. Whether you’re building trading bots, monitoring DeFi protocols, or just geeking out over candle patterns, this video has something for you. Check out the tutorial and start crafting your own crypto dashboards in minutes! Click here... Happy coding and happy charting!
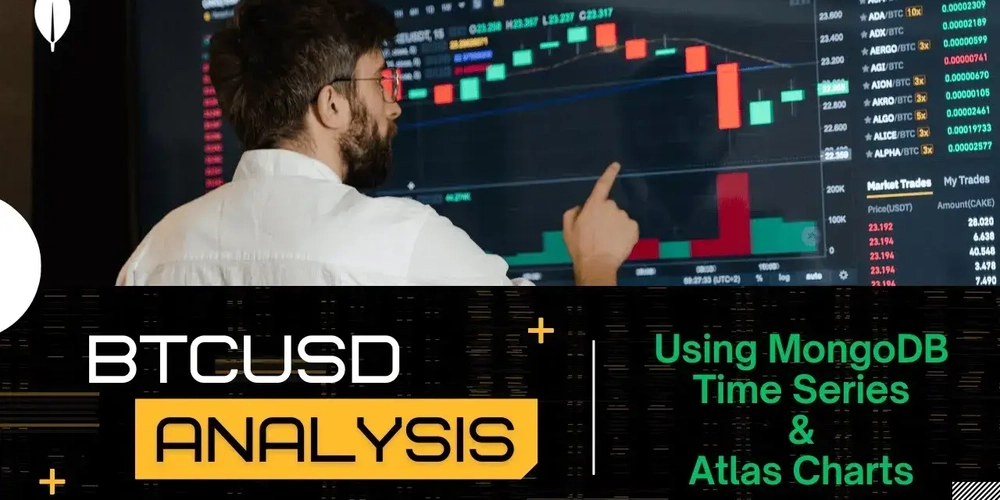
Hello DEV community! I just dropped a hands‑on walkthrough showing how to stream in BTCUSD price ticks into MongoDB Time Series collections—and turn them into live, interactive charts with Atlas Charts. No React, no D3—just configuration and a few clicks.
Why You’ll Love It
Real‑Time Insights: Capture and visualize price swings as they happen.
Low‑Code Setup: Skip the boilerplate; get straight to analysis on the free tier.
Data Modeling Best Practices: Structure your time series for lightning‑fast queries.
Outlier & Volatility Detection: Learn simple techniques to surface critical market events.
Whether you’re building trading bots, monitoring DeFi protocols, or just geeking out over candle patterns, this video has something for you.
Check out the tutorial and start crafting your own crypto dashboards in minutes! Click here...
Happy coding and happy charting!