


![Epic Games: Fortnite is offline for Apple devices worldwide after app store rejection [updated]](https://helios-i.mashable.com/imagery/articles/00T6DmFkLaAeJiMZlCJ7eUs/hero-image.fill.size_1200x675.v1747407583.jpg)


![[The AI Show Episode 146]: Rise of “AI-First” Companies, AI Job Disruption, GPT-4o Update Gets Rolled Back, How Big Consulting Firms Use AI, and Meta AI App](https://www.marketingaiinstitute.com/hubfs/ep%20146%20cover.png)


.png?width=1920&height=1920&fit=bounds&quality=70&format=jpg&auto=webp#)


-xl-(1)-xl-xl.jpg)


![How to upgrade the M4 Mac mini SSD and save hundreds [Video]](https://i0.wp.com/9to5mac.com/wp-content/uploads/sites/6/2025/05/M4-Mac-mini-SSD-Upgrade-Tutorial-2TB.jpg?resize=1200%2C628&quality=82&strip=all&ssl=1)
![‘Apple in China’ book argues that the iPhone could be killed overnight [Updated]](https://i0.wp.com/9to5mac.com/wp-content/uploads/sites/6/2025/05/Apple-in-China-review.jpg?resize=1200%2C628&quality=82&strip=all&ssl=1)


![What’s new in Android’s May 2025 Google System Updates [U: 5/16]](https://i0.wp.com/9to5google.com/wp-content/uploads/sites/4/2025/01/google-play-services-1.jpg?resize=1200%2C628&quality=82&strip=all&ssl=1)


![iPhone 17 Air Could Get a Boost From TDK's New Silicon Battery Tech [Report]](https://www.iclarified.com/images/news/97344/97344/97344-640.jpg)
![Vision Pro Owners Say They Regret $3,500 Purchase [WSJ]](https://www.iclarified.com/images/news/97347/97347/97347-640.jpg)
![Apple Showcases 'Magnifier on Mac' and 'Music Haptics' Accessibility Features [Video]](https://www.iclarified.com/images/news/97343/97343/97343-640.jpg)
![Sony WH-1000XM6 Unveiled With Smarter Noise Canceling and Studio-Tuned Sound [Video]](https://www.iclarified.com/images/news/97341/97341/97341-640.jpg)


![Apple Stops Signing iPadOS 17.7.7 After Reports of App Login Issues [Updated]](https://images.macrumors.com/t/DoYicdwGvOHw-VKkuNvoxYs3pfo=/1920x/article-new/2023/06/ipados-17.jpg)


Full Integration Guide: Camunda 8.5 with OpenTelemetry for End-to-End Observability
Camunda 8.5 offers robust integration capabilities with OpenTelemetry, enabling comprehensive observability across your process automation workflows. This technical guide provides validated configuration and implementation details to successfully connect Camunda 8.5 with OpenTelemetry, ensuring proper collection of trace IDs and process execution details. Understanding the Camunda 8 Telemetry Architecture Camunda 8 organizes its operational data in a structured hierarchy of indices, as shown in the Harmonized Indices schema diagram. This includes: Operate Indices: Store process execution data, incidents, and metrics Tasklist Indices: Maintain task-related information Identity Indices: Manage users, groups, and authorizations[1] This architecture forms the foundation for the telemetry data that will be exported through OpenTelemetry. Enabling OpenTelemetry in Camunda 8.5 Camunda 8.5 includes native support for both Prometheus and OpenTelemetry. By default, only Prometheus metrics export is enabled via a scraping endpoint, while OpenTelemetry export is disabled[8]. To enable OpenTelemetry: Configuration for Metrics Export Configure the OTLP exporter in your Camunda 8.5 configuration: # Optional: Disable Prometheus if preferring OpenTelemetry exclusively prometheus.metrics.export.enabled: false # Configure OpenTelemetry Metrics otlp: metrics: export: # Enable OTLP export enabled: true # Set data push interval step: 30s # Define endpoint destination url: "https://otlp.example.com:4318/v1/metrics" Set environment variables for advanced control: # Base endpoint for all telemetry signals export OTEL_EXPORTER_OTLP_ENDPOINT="https://my-collector:4318" # Signal-specific endpoints if needed export OTEL_EXPORTER_OTLP_METRICS_ENDPOINT="https://metrics-collector:4318/v1/metrics" # Configure timeout (milliseconds) export OTEL_EXPORTER_OTLP_TIMEOUT=10000 # Set protocol (grpc, http/protobuf, or http/json) export OTEL_EXPORTER_OTLP_PROTOCOL=http/protobuf Implementing Distributed Tracing with Zeebe Gateway Interceptors To ensure trace IDs are propagated and process details are collected, implement custom interceptors for the Zeebe Gateway[11]. Creating a Custom OpenTelemetry Interceptor Create a Maven/Gradle project with the following dependencies: io.camunda zeebe-gateway 8.5.0 provided io.opentelemetry opentelemetry-api 1.34.1 io.opentelemetry opentelemetry-sdk 1.34.1 io.grpc grpc-api 1.60.0 provided Implement a ServerInterceptor for distributed tracing: package io.example.tracing; import io.grpc.*; import io.opentelemetry.api.OpenTelemetry; import io.opentelemetry.api.trace.Span; import io.opentelemetry.api.trace.SpanKind; import io.opentelemetry.api.trace.Tracer; import io.opentelemetry.context.Context; import io.opentelemetry.context.Scope; import io.opentelemetry.context.propagation.TextMapGetter; public class ZeebeOpenTelemetryInterceptor implements ServerInterceptor { private final OpenTelemetry openTelemetry; private final Tracer tracer; public ZeebeOpenTelemetryInterceptor() { // Initialize OpenTelemetry - in production, use a proper SDK setup this.openTelemetry = OpenTelemetry.noop(); this.tracer = openTelemetry.getTracer("io.example.zeebe.interceptor"); } @Override public ServerCall.Listener interceptCall( ServerCall call, Metadata headers, ServerCallHandler next) { String methodName = call.getMethodDescriptor().getFullMethodName(); // Extract trace context from headers if present Context context = openTelemetry.getPropagators().getTextMapPropagator() .extract(Context.current(), headers, new MetadataGetter()); // Start a new span or continue from extracted context Span span = tracer.spanBuilder(methodName) .setSpanKind(SpanKind.SERVER) .setParent(context) .startSpan(); // Add method information as span attributes span.setAttribute("rpc.service", call.getMethodDescriptor().getServiceName()); span.setAttribute("rpc.method", call.getMethodDescriptor().getBareMethodName()); // Create a new scope and server call wrapper return new TracingServerCallListener( next.startCall(new TracingServerCall(call, span), headers), span); } // Implementation of TextMapGetter for gRPC Metadata private static class MetadataGetter implements TextMapGetter { // Implementation details omitted for brevity } // Implementations of TracingServerCall and TracingServerCallListener // that properly handle span lifecycle and error capturing } Package the interceptor into

Camunda 8.5 offers robust integration capabilities with OpenTelemetry, enabling comprehensive observability across your process automation workflows. This technical guide provides validated configuration and implementation details to successfully connect Camunda 8.5 with OpenTelemetry, ensuring proper collection of trace IDs and process execution details.
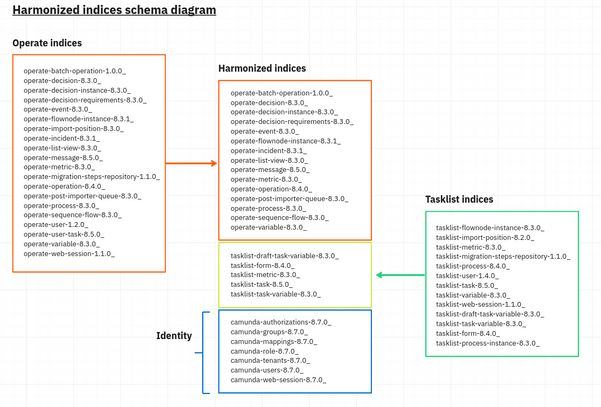
Understanding the Camunda 8 Telemetry Architecture
Camunda 8 organizes its operational data in a structured hierarchy of indices, as shown in the Harmonized Indices schema diagram. This includes:
- Operate Indices: Store process execution data, incidents, and metrics
- Tasklist Indices: Maintain task-related information
- Identity Indices: Manage users, groups, and authorizations[1]
This architecture forms the foundation for the telemetry data that will be exported through OpenTelemetry.
Enabling OpenTelemetry in Camunda 8.5
Camunda 8.5 includes native support for both Prometheus and OpenTelemetry. By default, only Prometheus metrics export is enabled via a scraping endpoint, while OpenTelemetry export is disabled[8]. To enable OpenTelemetry:
Configuration for Metrics Export
- Configure the OTLP exporter in your Camunda 8.5 configuration:
# Optional: Disable Prometheus if preferring OpenTelemetry exclusively
prometheus.metrics.export.enabled: false

# Configure OpenTelemetry Metrics
otlp:
  metrics:
    export:
      # Enable OTLP export
      enabled: true
      # Set data push interval
      step: 30s
      # Define endpoint destination
      url: "https://otlp.example.com:4318/v1/metrics"
- Set environment variables for advanced control:
# Base endpoint for all telemetry signals
export OTEL_EXPORTER_OTLP_ENDPOINT="https://my-collector:4318"

# Signal-specific endpoints if needed
export OTEL_EXPORTER_OTLP_METRICS_ENDPOINT="https://metrics-collector:4318/v1/metrics"

# Configure timeout (milliseconds)
export OTEL_EXPORTER_OTLP_TIMEOUT=10000

# Set protocol (grpc, http/protobuf, or http/json)
export OTEL_EXPORTER_OTLP_PROTOCOL=http/protobuf
Implementing Distributed Tracing with Zeebe Gateway Interceptors
To ensure trace IDs are propagated and process details are collected, implement custom interceptors for the Zeebe Gateway[11].
Creating a Custom OpenTelemetry Interceptor
- Create a Maven/Gradle project with the following dependencies:
        io.camunda
        zeebe-gateway
        8.5.0
        provided


        io.opentelemetry
        opentelemetry-api
        1.34.1


        io.opentelemetry
        opentelemetry-sdk
        1.34.1


        io.grpc
        grpc-api
        1.60.0
        provided
- Implement a ServerInterceptor for distributed tracing:
package io.example.tracing;

import io.grpc.*;
import io.opentelemetry.api.OpenTelemetry;
import io.opentelemetry.api.trace.Span;
import io.opentelemetry.api.trace.SpanKind;
import io.opentelemetry.api.trace.Tracer;
import io.opentelemetry.context.Context;
import io.opentelemetry.context.Scope;
import io.opentelemetry.context.propagation.TextMapGetter;

public class ZeebeOpenTelemetryInterceptor implements ServerInterceptor {
    private final OpenTelemetry openTelemetry;
    private final Tracer tracer;

    public ZeebeOpenTelemetryInterceptor() {
        // Initialize OpenTelemetry - in production, use a proper SDK setup
        this.openTelemetry = OpenTelemetry.noop();
        this.tracer = openTelemetry.getTracer("io.example.zeebe.interceptor");
    }

    @Override
    public  ServerCall.Listener interceptCall(
            ServerCall call,
            Metadata headers,
            ServerCallHandler next) {

        String methodName = call.getMethodDescriptor().getFullMethodName();

        // Extract trace context from headers if present
        Context context = openTelemetry.getPropagators().getTextMapPropagator()
                .extract(Context.current(), headers, new MetadataGetter());

        // Start a new span or continue from extracted context
        Span span = tracer.spanBuilder(methodName)
                .setSpanKind(SpanKind.SERVER)
                .setParent(context)
                .startSpan();

        // Add method information as span attributes
        span.setAttribute("rpc.service", call.getMethodDescriptor().getServiceName());
        span.setAttribute("rpc.method", call.getMethodDescriptor().getBareMethodName());

        // Create a new scope and server call wrapper
        return new TracingServerCallListener<>(
                next.startCall(new TracingServerCall<>(call, span), headers),
                span);
    }

    // Implementation of TextMapGetter for gRPC Metadata
    private static class MetadataGetter implements TextMapGetter {
        // Implementation details omitted for brevity
    }

    // Implementations of TracingServerCall and TracingServerCallListener
    // that properly handle span lifecycle and error capturing
}
- Package the interceptor into a JAR file.
Deploying the OpenTelemetry Interceptor
- Create a custom Docker image for Zeebe Gateway:
FROM camunda/zeebe:8.5.16

# Copy your interceptor JAR
COPY target/zeebe-otel-interceptor-1.0.0.jar /usr/local/zeebe/lib/
- Configure the interceptor in your Kubernetes deployment using Helm:
zeebe:
  image:
    repository: your-custom-zeebe
    tag: 8.5.16
  env:
    - name: zeebe_gateway_interceptors_0_id
      value: "otel-interceptor"
    - name: zeebe_gateway_interceptors_0_className
      value: "io.example.tracing.ZeebeOpenTelemetryInterceptor"
    - name: zeebe_gateway_interceptors_0_jarPath
      value: "/usr/local/zeebe/lib/zeebe-otel-interceptor-1.0.0.jar"
    # Configure OpenTelemetry endpoint
    - name: OTEL_EXPORTER_OTLP_ENDPOINT
      value: "http://otel-collector:4317"
Enabling Process Detail Collection
To ensure process details are captured in your traces:
- Capture process information in spans:
// Example from within your interceptor or client code
span.setAttribute("process.definition.key", processDefinition.getKey());
span.setAttribute("process.instance.id", processInstance.getId());
span.setAttribute("process.element.id", execution.getCurrentActivityId());
- Implement a ZeebeClientInterceptor for client-side tracing:
public class ZeebeOpenTelemetryClientInterceptor implements ZeebeClientInterceptor {
    private final OpenTelemetry openTelemetry;
    private final Tracer tracer;

    public ZeebeOpenTelemetryClientInterceptor(OpenTelemetry openTelemetry) {
        this.openTelemetry = openTelemetry;
        this.tracer = openTelemetry.getTracer("io.example.zeebe.client");
    }

    @Override
    public  ClientCall interceptCall(
            MethodDescriptor method,
            CallOptions callOptions,
            Channel next) {

        Span span = tracer.spanBuilder(method.getFullMethodName())
                .setSpanKind(SpanKind.CLIENT)
                .startSpan();

        // Add process context if available
        // Implementation details omitted for brevity

        return new TracingClientCall<>(next.newCall(method, callOptions), span);
    }
}
Deploying the OpenTelemetry Collector
For most production setups, using the OpenTelemetry Collector is recommended:
- Create a collector configuration file:
receivers:
  otlp:
    protocols:
      grpc:
      http:

processors:
  batch:
  memory_limiter:
    check_interval: 1s
    limit_mib: 1000
    spike_limit_mib: 200

exporters:
  logging:
    loglevel: debug

  otlp/elastic:
    endpoint: "${ELASTIC_APM_SERVER_URL}"
    headers:
      Authorization: "Bearer ${ELASTIC_APM_SECRET_TOKEN}"
    tls:
      insecure_skip_verify: false

service:
  pipelines:
    traces:
      receivers: [otlp]
      processors: [batch, memory_limiter]
      exporters: [logging, otlp/elastic]
    metrics:
      receivers: [otlp]
      processors: [batch, memory_limiter]
      exporters: [logging, otlp/elastic]
- Deploy the collector as a sidecar or separate service in your Kubernetes cluster.
Understanding the Data Flow
With the configuration in place, Camunda 8.5 will:
- Collect metrics from internal components
- Push metric updates to your configured OTLP endpoint
- Propagate trace contexts across service boundaries and process executions
- Structure the data according to the Harmonized Indices schema[1]
- Format telemetry data according to OpenTelemetry protocol specifications
The interceptors will ensure trace IDs are properly propagated, allowing you to follow process executions across multiple services and observe the entire lifecycle of business processes.
Conclusion
By following this integration guide, you've established comprehensive observability for your Camunda 8.5 workflows using OpenTelemetry. This setup enables you to track process execution details, monitor system performance, and troubleshoot issues across your distributed process automation environment.
As the OpenTelemetry ecosystem continues to mature, watch for official instrumentation support for Camunda in the OpenTelemetry Java instrumentation project, which is currently under consideration[15].
Citations:
[1] https://pplx-res.cloudinary.com/image/upload/v1747427714/user_uploads/48031643/6b29f8b1-fff0-45bb-9ae7-f0bc2d98c3cb/17474277015804148959788849369994.jpg
[2] https://docs.camunda.io/docs/components/modeler/desktop-modeler/telemetry/
[3] https://camunda.com/blog/2025/02/one-exporter-to-rule-them-all-exploring-camunda-exporter/
[4] https://camunda.com/blog/2025/01/performance-tuning-camunda-8/
[5] https://forum.camunda.io/t/instrumentation-of-camunda-processes-for-open-telemetry/51400
[6] https://docs.camunda.io/docs/self-managed/zeebe-deployment/zeebe-gateway/interceptors/
[7] https://docs.dapr.io/operations/observability/tracing/otel-collector/open-telemetry-collector/
[8] https://docs.camunda.io/docs/8.7/self-managed/operational-guides/monitoring/metrics/
[9] https://camunda.com/blog/2024/04/camunda-8-5-release/
[10] https://github.com/camunda/zeebe/issues/9742
[11] https://www.linkedin.com/pulse/how-implement-custom-interceptors-camunda-85-anubhav-mangla-fl14c
[12] https://forum.camunda.io/t/zeebe-and-distributed-tracing/36723
[13] https://javadoc.io/static/io.quarkiverse.zeebe/quarkus-zeebe/0.4.0/io/quarkiverse/zeebe/runtime/tracing/ZeebeOpenTelemetryClientInterceptor.html
[14] https://www.linkedin.com/pulse/distributed-tracing-springboot-opentelemetry-api-calls-chandan-khatri-wpw7c
[15] https://github.com/open-telemetry/opentelemetry-java-instrumentation/issues/12122
[16] https://camunda.com/blog/2022/11/how-to-build-camunda-platform-8-connector/
[17] https://github.com/open-telemetry/opentelemetry-js/issues/2786
[18] https://grafana.com/docs/grafana-cloud/monitor-applications/frontend-observability/instrument/opentelemetry-js/
[19] https://coralogix.com/guides/opentelemetry/opentelemetry-tracing-how-it-works-tutorial-and-best-practices/
[20] https://grafana.com/docs/grafana-cloud/send-data/metrics/metrics-prometheus/prometheus-config-examples/camunda-zeebe/
[21] https://opentelemetry.io/docs/specs/otel/trace/api/


