


![[The AI Show Episode 146]: Rise of “AI-First” Companies, AI Job Disruption, GPT-4o Update Gets Rolled Back, How Big Consulting Firms Use AI, and Meta AI App](https://www.marketingaiinstitute.com/hubfs/ep%20146%20cover.png)


.jpg?width=1920&height=1920&fit=bounds&quality=70&format=jpg&auto=webp#)


_Alexey_Kotelnikov_Alamy.jpg?width=1280&auto=webp&quality=80&disable=upscale#)
_Brian_Jackson_Alamy.jpg?width=1280&auto=webp&quality=80&disable=upscale#)


 Stolen 884,000 Credit Card Details on 13 Million Clicks from Users Worldwide.webp?#)


![Roku clarifies how ‘Pause Ads’ work amid issues with some HDR content [U]](https://i0.wp.com/9to5google.com/wp-content/uploads/sites/4/2025/05/roku-pause-ad-1.jpg?resize=1200%2C628&quality=82&strip=all&ssl=1)


![Apple Seeds visionOS 2.5 RC to Developers [Download]](https://www.iclarified.com/images/news/97240/97240/97240-640.jpg)
![Apple Seeds tvOS 18.5 RC to Developers [Download]](https://www.iclarified.com/images/news/97243/97243/97243-640.jpg)


Drawing the Line: What Makes Support Vector Machines So Effective?
Learn how Support Vector Machines find the optimal hyperplane to classify complex data with precision and power. In the era of ever-growing data, choosing the right algorithm to make sense of it all is crucial. One such powerful and versatile tool is the Support Vector Machine (SVM) — a supervised learning model known for its ability to classify complex datasets with remarkable accuracy. In this blog, we’ll break down how SVMs work, the intuition behind them, their mathematical foundations, and how you can implement them in real-world applications. Whether you're just starting with machine learning or looking to solidify your understanding, this guide will equip you with the essentials. Intuition behind Support Vector Machines Before diving into the math, let’s first understand the core intuition behind Support Vector Machines. Imagine you’re tasked with drawing a line (or hyperplane) that best separates two groups of data points on a graph. But this isn’t just any line — the goal is to find the optimal line that maximizes the margin between the two groups, leaving the least room for error. This simple yet powerful concept forms the foundation of SVMs. By maximizing this margin, SVMs achieve better generalization, making them highly effective even for complex and noisy datasets. Let’s break it down further and see how this intuition translates into a powerful machine learning tool. At the heart of SVMs is the concept of finding the optimal hyperplane. This hyperplane serves as the boundary that separates data into different classes. But it’s not just any boundary — SVMs seek the hyperplane that maximizes the margin, ensuring the maximum possible separation between the classes. The data points closest to the hyperplane are called support vectors, and these are the key players in determining the optimal hyperplane. By focusing on these critical points, SVMs ensure that they don’t overfit to noisy data and maintain excellent generalization capabilities, even on unseen data. In the next section, we’ll explore the mathematics behind finding this optimal hyperplane and how SVMs handle more complex cases like non-linear boundaries. Mathematical foundation of Support Vector Machines In this section we will lay a foundation using the 2D plane and after we have understood the underlying concepts we will then extend it to higher Dimensions Problem statement Given sets of points in a 2D plane , draw a line that seperates them in a way that the gap between that line and the nearest point on either sides is maximum. Then define a particular rule that will be used to decide where new points will belong In the Real World is like fitting the widest street between two set of people in a given village . and the defining a rule that will be used in the future to allocate land to new comers we will use mathematical equations to represent these planes Imagine you went to the market with $200 to by two items X and Y. 1 unit of X cost $4 and 1 unit of X cost $3 how many items of X and Y must you purchase with $200 Total cost for X: 3 X quantity of X = 3X Total cost for Y: 4 X quantity of Y = 4Y TOTAL cost = 3X + 4Y but remember this TOTAL MUST NOT EXCEED 200 SO 3X + 4Y

Learn how Support Vector Machines find the optimal hyperplane to classify complex data with precision and power.
In the era of ever-growing data, choosing the right algorithm to make sense of it all is crucial. One such powerful and versatile tool is the Support Vector Machine (SVM) — a supervised learning model known for its ability to classify complex datasets with remarkable accuracy.
In this blog, we’ll break down how SVMs work, the intuition behind them, their mathematical foundations, and how you can implement them in real-world applications. Whether you're just starting with machine learning or looking to solidify your understanding, this guide will equip you with the essentials.
Intuition behind Support Vector Machines
Before diving into the math, let’s first understand the core intuition behind Support Vector Machines. Imagine you’re tasked with drawing a line (or hyperplane) that best separates two groups of data points on a graph. But this isn’t just any line — the goal is to find the optimal line that maximizes the margin between the two groups, leaving the least room for error.
This simple yet powerful concept forms the foundation of SVMs. By maximizing this margin, SVMs achieve better generalization, making them highly effective even for complex and noisy datasets. Let’s break it down further and see how this intuition translates into a powerful machine learning tool.
At the heart of SVMs is the concept of finding the optimal hyperplane. This hyperplane serves as the boundary that separates data into different classes. But it’s not just any boundary — SVMs seek the hyperplane that maximizes the margin, ensuring the maximum possible separation between the classes.
The data points closest to the hyperplane are called support vectors, and these are the key players in determining the optimal hyperplane. By focusing on these critical points, SVMs ensure that they don’t overfit to noisy data and maintain excellent generalization capabilities, even on unseen data.
In the next section, we’ll explore the mathematics behind finding this optimal hyperplane and how SVMs handle more complex cases like non-linear boundaries.
Mathematical foundation of Support Vector Machines
In this section we will lay a foundation using the 2D plane and after we have understood the underlying concepts we will then extend it to higher Dimensions
Problem statement
Given sets of points in a 2D plane , draw a line that seperates them in a way that the gap between that line and the nearest point on either sides is maximum. Then define a particular rule that will be used to decide where new points will belong
In the Real World is like fitting the widest street between two set of people in a given village . and the defining a rule that will be used in the future to allocate land to new comers
we will use mathematical equations to represent these planes
Imagine you went to the market with $200 to by two items X and Y.
1 unit of X cost $4 and 1 unit of X cost $3
how many items of X and Y must you purchase with $200
Total cost for X: 3 X quantity of X = 3X
Total cost for Y: 4 X quantity of Y = 4Y

TOTAL cost = 3X + 4Y

but remember this TOTAL MUST NOT EXCEED 200
SO
3X + 4Y < = 200
OUR DECISION BOUNDARY : 3X + 4Y  = 200 (A 2D hyperplane)
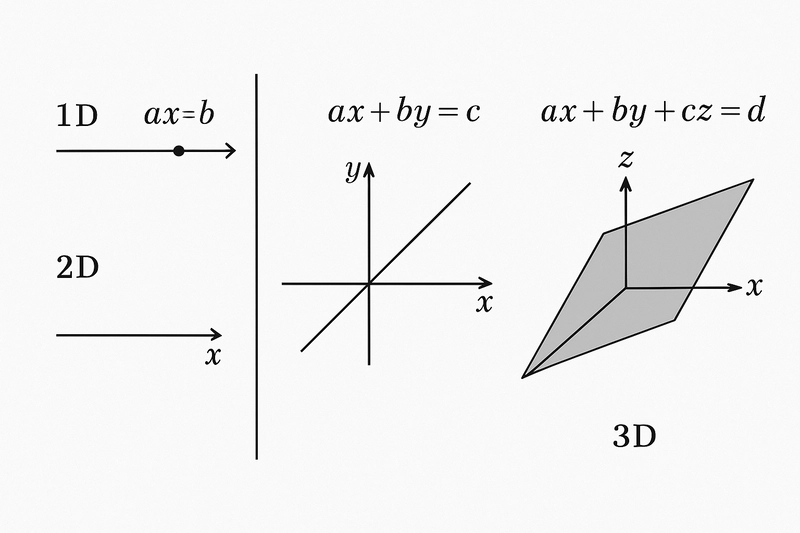
Equations of plane
1D: X = 5
2D: ax + by = 5
3D: ax + by + cz = 5
Decision Rule
IN our items purchase any combination that the total price does not exceed 200 is a valid combination
we will use the same idea to create a DECISION RULE for our Support Vector Classifier
Construct a 2D plane with red and black points
Determine how to seperate the red dots from the black dots
This is achieved by fitting a hyperplane which serves as a boundary
imagine a vector perpendicular to this dividing plane
we call this vector (w)
we need this vector because to calculate a
distance in a plane we need a vector perpendicular
to the plane
if you are getting confused check out this my blog post on use cases of vector dot product to real world problems
vector dot product arround us
if you understand let's continue
- since every point in our plane is a vector our Decision rule 1 we be
Rule 1: for any new point (u) if the dot product of u and w exceed and certain number b it belongs to red else it belongs to black
U BELONGS TO RED
else
U belongs to BLACK
The problem at this level is to find an optimal value of w and b
we can modify our rule 1 as
u⋅w+b≥0 \mathbf{u} \cdot \mathbf{w} + b \geq 0 u⋅w+b≥0
there are many value of w and b SVMs has the ability to choose the optimal
we will add additional constraints
if
u is a red point
if
u is a black point
0 + 1 and 0 - 1 shows that there is a gap of 1 unit on either sides of the decision boundary
take
ub
\mathbf{u}_b
ub
and
ur
\mathbf{u}_r
ur
to be at the edge of the gap between the 2 set of points and the decision line at the center of this gap
then width of gap will be
eqn(1) - eqn(2)

#pick up your pen and paper and do the subtraction to get rid of b
and finally we can divide both sides by magnitude of w to get formula for width of the gap(Margin)
our objective is to maximize this margin

in another way

our objective is to minimize ||w||
At this point am about to do something strange
instead of minimizing
it is better and computatonally efficient to minimize
:) trust me what we have just done is the right thing
In the constraints
If yi=+1y_i = +1yi=+1 : the point xi\mathbf{x}_ixi should lie on the positive side of the hyperplane.
If yi=−1y_i = -1yi=−1 : the point xi\mathbf{x}_ixi should lie on the negative side.
This constraint ensures all data points are correctly classified and lie outside the margin (not just on the correct side, but also at least 1 unit away from the hyperplane).
.
at this point finding turning points will not be helpful because we
must respect the constraints
For that we will introduce Lagrange Multipliers