


![[The AI Show Episode 145]: OpenAI Releases o3 and o4-mini, AI Is Causing “Quiet Layoffs,” Executive Order on Youth AI Education & GPT-4o’s Controversial Update](https://www.marketingaiinstitute.com/hubfs/ep%20145%20cover.png)


![From Art School Drop-out to Microsoft Engineer with Shashi Lo [Podcast #170]](https://cdn.hashnode.com/res/hashnode/image/upload/v1746203291209/439bf16b-c820-4fe8-b69e-94d80533b2df.png?#)


(1).jpg?#)


_Inge_Johnsson-Alamy.jpg?width=1280&auto=webp&quality=80&disable=upscale#)


![New Apple iPad mini 7 On Sale for $399! [Lowest Price Ever]](https://www.iclarified.com/images/news/96096/96096/96096-640.jpg)
![Apple to Split iPhone Launches Across Fall and Spring in Major Shakeup [Report]](https://www.iclarified.com/images/news/97211/97211/97211-640.jpg)
![Apple to Move Camera to Top Left, Hide Face ID Under Display in iPhone 18 Pro Redesign [Report]](https://www.iclarified.com/images/news/97212/97212/97212-640.jpg)
![Apple Developing Battery Case for iPhone 17 Air Amid Battery Life Concerns [Report]](https://www.iclarified.com/images/news/97208/97208/97208-640.jpg)


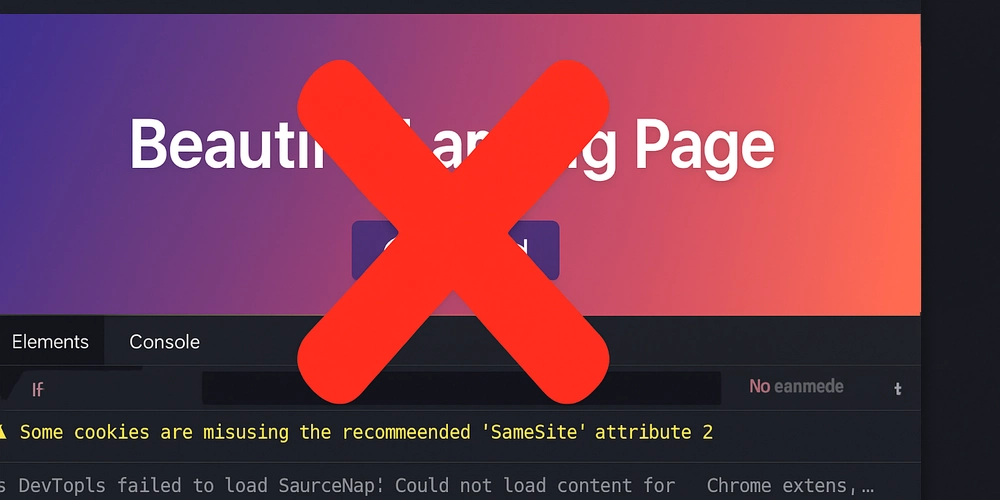
Your Browser Dev Tools Are Killing Your Productivity (And How to Fix It)
Have you ever found yourself constantly switching between your code editor and browser dev tools, trying to track down that elusive bug? Or perhaps you've spent hours analyzing network requests or console logs, only to miss the forest for the trees? What if I told you there's a way to bring all that browser debugging power directly into your coding environment? Enter Browser Tools MCP - a game-changing tool that transforms how developers debug and optimize web applications from within Cursor IDE. Why Browser Debugging is Broken (And How to Fix It) The traditional debugging workflow creates a cognitive drain on developers: Write code in your editor Switch to browser to test Open dev tools to check errors Try to remember what you saw while switching back to your editor Repeat endlessly This context-switching tax is draining your productivity without you even realizing it. Browser Tools MCP eliminates this by bringing browser analytics directly into your coding environment. The Magic Moment: Debugging Without Leaving Your Editor Imagine instantly accessing: Console logs and errors - Track down JavaScript issues without tab switching Network requests - Analyze API calls, responses, and performance bottlenecks DOM inspection - Examine selected elements and their properties Screenshots - Capture and analyze visual state automatically Comprehensive audits - Performance, accessibility, SEO, and best practices analysis All from within your Cursor IDE, powered by Claude AI's assistance. Beyond Basic Debugging: Unlock Web Development Superpowers Browser Tools MCP isn't just about catching errors - it's about transforming your entire web development workflow:
Have you ever found yourself constantly switching between your code editor and browser dev tools, trying to track down that elusive bug? Or perhaps you've spent hours analyzing network requests or console logs, only to miss the forest for the trees?
What if I told you there's a way to bring all that browser debugging power directly into your coding environment?
Enter Browser Tools MCP - a game-changing tool that transforms how developers debug and optimize web applications from within Cursor IDE.
Why Browser Debugging is Broken (And How to Fix It)
The traditional debugging workflow creates a cognitive drain on developers:
- Write code in your editor
- Switch to browser to test
- Open dev tools to check errors
- Try to remember what you saw while switching back to your editor
- Repeat endlessly
This context-switching tax is draining your productivity without you even realizing it. Browser Tools MCP eliminates this by bringing browser analytics directly into your coding environment.
The Magic Moment: Debugging Without Leaving Your Editor
Imagine instantly accessing:
- Console logs and errors - Track down JavaScript issues without tab switching
- Network requests - Analyze API calls, responses, and performance bottlenecks
- DOM inspection - Examine selected elements and their properties
- Screenshots - Capture and analyze visual state automatically
- Comprehensive audits - Performance, accessibility, SEO, and best practices analysis
All from within your Cursor IDE, powered by Claude AI's assistance.
Beyond Basic Debugging: Unlock Web Development Superpowers
Browser Tools MCP isn't just about catching errors - it's about transforming your entire web development workflow: