


![[The AI Show Episode 143]: ChatGPT Revenue Surge, New AGI Timelines, Amazon’s AI Agent, Claude for Education, Model Context Protocol & LLMs Pass the Turing Test](https://www.marketingaiinstitute.com/hubfs/ep%20143%20cover.png)


![From drop-out to software architect with Jason Lengstorf [Podcast #167]](https://cdn.hashnode.com/res/hashnode/image/upload/v1743796461357/f3d19cd7-e6f5-4d7c-8bfc-eb974bc8da68.png?#)


![QA - Best methods for getting large amount of test data into event consuming applications generated from an API application [closed]](https://cdn.sstatic.net/Sites/softwareengineering/Img/apple-touch-icon@2.png?v=1ef7363febba)


-11.11.2024-4-49-screenshot.png?width=1920&height=1920&fit=bounds&quality=70&format=jpg&auto=webp#)


_jvphoto_Alamy.jpg?#)


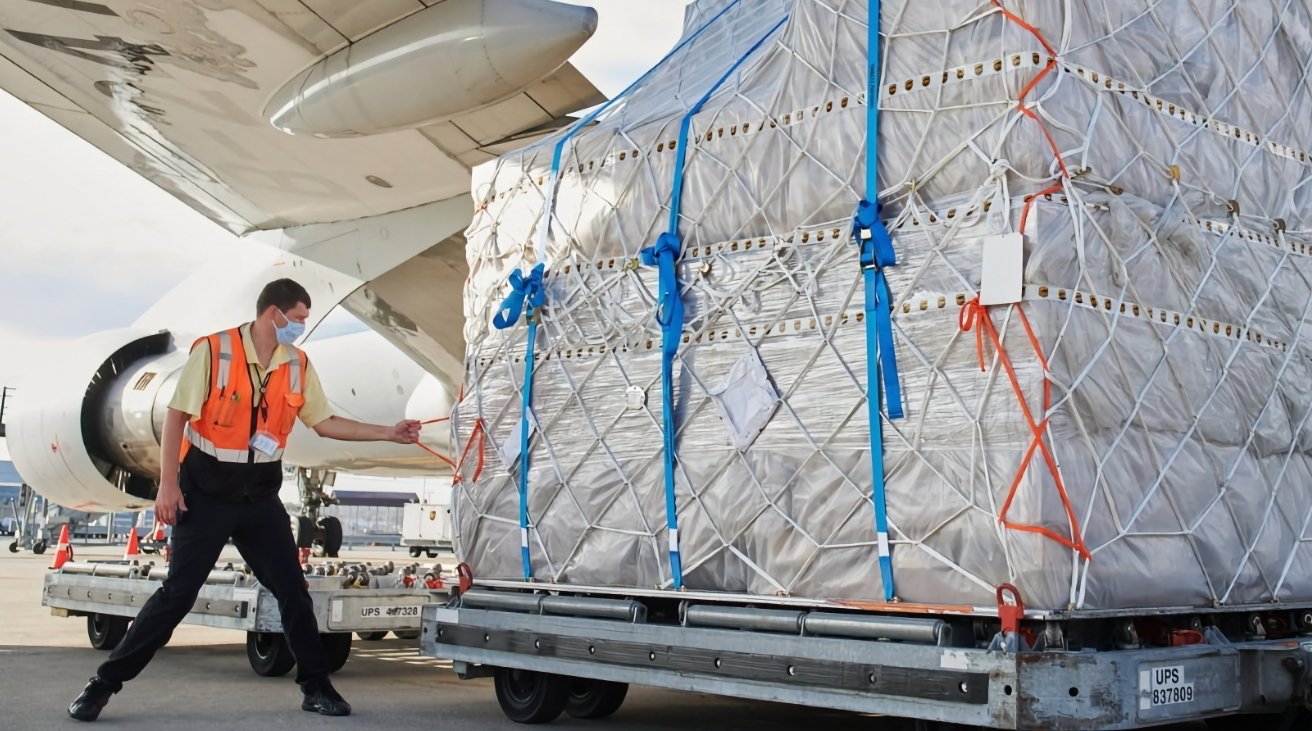


![Apple Rushes Five Planes of iPhones to US Ahead of New Tariffs [Report]](https://www.iclarified.com/images/news/96967/96967/96967-640.jpg)
![Apple Vision Pro 2 Allegedly in Production Ahead of 2025 Launch [Rumor]](https://www.iclarified.com/images/news/96965/96965/96965-640.jpg)


Prometheus
In this blog we are going to discuss about the Prometheus. It is opensource Observability tool for the applications. As system architecture continue to get more and more complex, new challenges arise as tracking down issues become far more challenging. There's a greater need for observability as we move towards distributed systems & microservices based application. When it comes to troubleshooting issues, we need more information than just what is wrong. We need to know to know why our application entered a specific state, what component is responsible and how we can avoid it in the future. Why are error rates rising Why is there high latency Why are services timing out Observability gives you the flexibility to understand unpredictable events. How do we accomplish observability? Logging Metrics Tracing Logging Logs are records of events that have occurred and encapsulate information about the specific event. Logs are comprised of: Timestamp of when the log occured Message containing information Logs are the most common form of observation produced by systems. However, they can be difficult to use due to the verbosity of the logs outputted by the applications. Logs of processes are likely to be interwoven with other concurrent processes spread across multiple systems. Traces Traces allow you to follow operations as they traverses through various systems & services. So, we can follow an individual request and see it flow through our system hop by hop. Traces help us connect the dots on how processes and services work together. Each trace has a trace-id that can be used to identify a request as it traverses the system. Individual events forming a trace are called spans. Each span tracks the following: Start time Duration Parent-Id Metrics Metrics provide information about the state of a system using numerical values CPU Load Number of open files HTTP response times Number of errors The data collected can be aggregated over time and graphed using visualization tools to identify trends over time. Usecases Prometheus is primarily written in Go Lang.
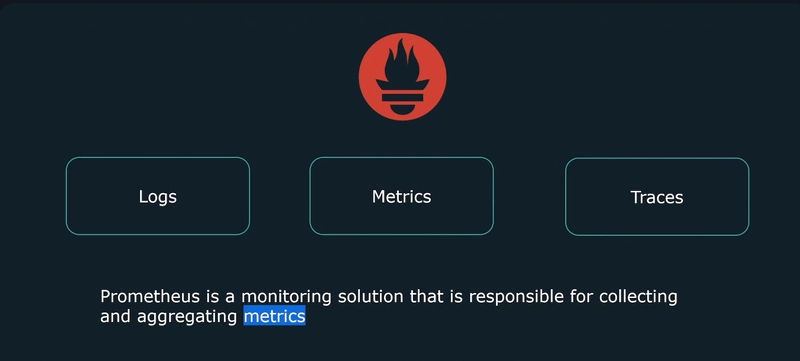
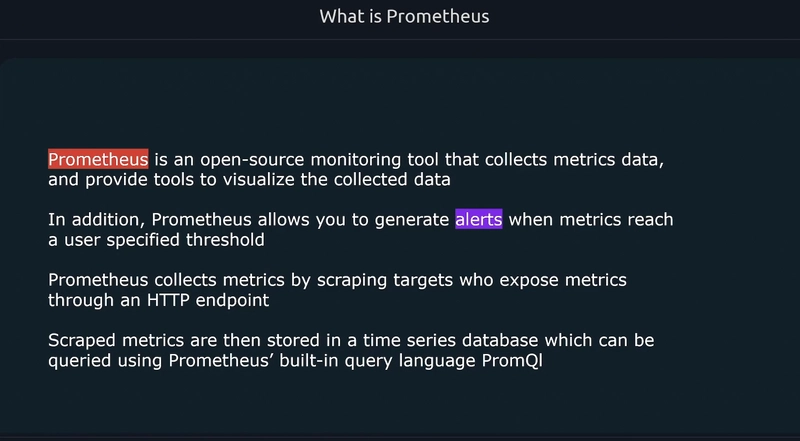
In this blog we are going to discuss about the Prometheus. It is opensource Observability tool for the applications.
As system architecture continue to get more and more complex, new challenges arise as tracking down issues become far more challenging.
There's a greater need for observability as we move towards distributed systems & microservices based application.
When it comes to troubleshooting issues, we need more information than just what is wrong.
We need to know to know why our application entered a specific state, what component is responsible and how we can avoid it in the future.
- Why are error rates rising
- Why is there high latency
- Why are services timing out
Observability gives you the flexibility to understand unpredictable events.
How do we accomplish observability?
- Logging
- Metrics
- Tracing
Logging
Logs are records of events that have occurred and encapsulate information about the specific event.
Logs are comprised of:
- Timestamp of when the log occured
- Message containing information
Logs are the most common form of observation produced by systems.
However, they can be difficult to use due to the verbosity of the logs outputted by the applications.
Logs of processes are likely to be interwoven with other concurrent processes spread across multiple systems.
Traces
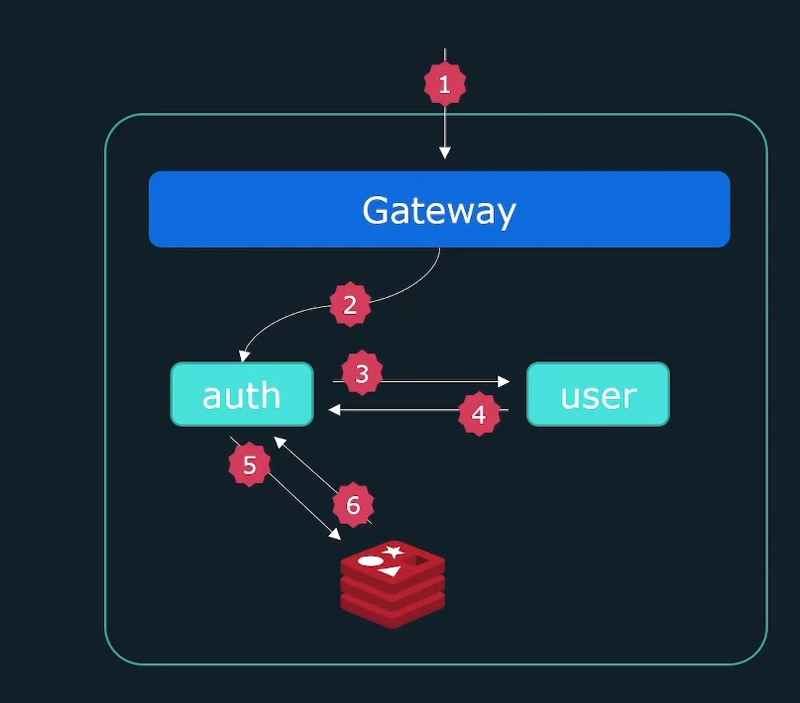
Traces allow you to follow operations as they traverses through various systems & services.
So, we can follow an individual request and see it flow through our system hop by hop.
Traces help us connect the dots on how processes and services work together.
Each trace has a trace-id that can be used to identify a request as it traverses the system.
Individual events forming a trace are called spans.
Each span tracks the following:
- Start time
- Duration
- Parent-Id

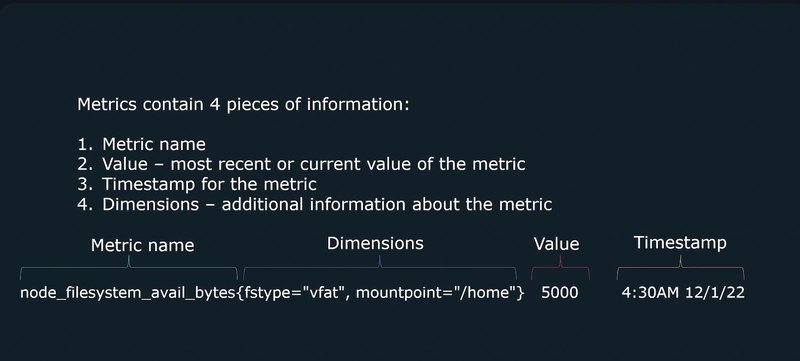
Metrics
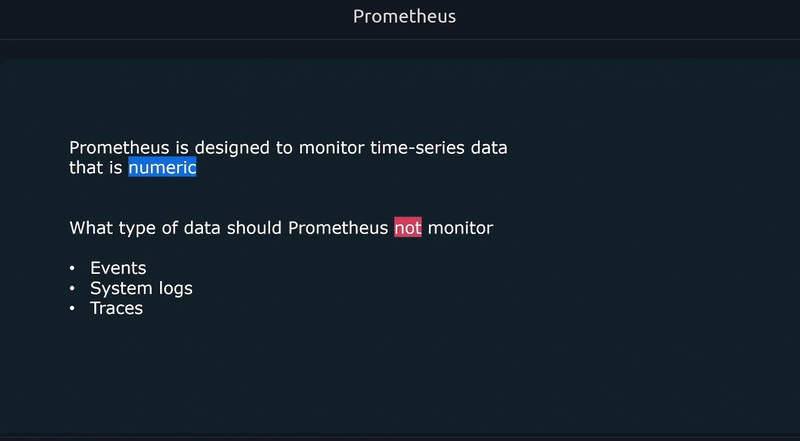
Metrics provide information about the state of a system using numerical values
- CPU Load
- Number of open files
- HTTP response times
- Number of errors The data collected can be aggregated over time and graphed using visualization tools to identify trends over time.
Usecases

Prometheus is primarily written in Go Lang.