


![[The AI Show Episode 142]: ChatGPT’s New Image Generator, Studio Ghibli Craze and Backlash, Gemini 2.5, OpenAI Academy, 4o Updates, Vibe Marketing & xAI Acquires X](https://www.marketingaiinstitute.com/hubfs/ep%20142%20cover.png)


![From drop-out to software architect with Jason Lengstorf [Podcast #167]](https://cdn.hashnode.com/res/hashnode/image/upload/v1743796461357/f3d19cd7-e6f5-4d7c-8bfc-eb974bc8da68.png?#)


(1).jpg?width=1920&height=1920&fit=bounds&quality=80&format=jpg&auto=webp#)


_NicoElNino_Alamy.png?#)
.webp?#)
.webp?#)


![New iOS 19 Leak Allegedly Reveals Updated Icons, Floating Tab Bar, More [Video]](https://www.iclarified.com/images/news/96958/96958/96958-640.jpg)

![Apple to Source More iPhones From India to Offset China Tariff Costs [Report]](https://www.iclarified.com/images/news/96954/96954/96954-640.jpg)
![Blackmagic Design Unveils DaVinci Resolve 20 With Over 100 New Features and AI Tools [Video]](https://www.iclarified.com/images/news/96951/96951/96951-640.jpg)


Hardware Metrics Collection with IOT Devices
In a self-made IOT stack, several applications provide, parse, and store data. You might have all applications running on the same or several machines. You might have different sensors providing data, and different methods to access and store this data. For a hobby project, this is all well until the point where things are not running anymore. The very first thing to check should be metrics from all your systems and sensors. Systems, which are conventional or single board computers, can be queried for their load, RAM and disk usage, network utilization. Sensors can be queried for their power consumption, computing cycles. And everything can be measured for their liveness. But how do you collect these metrics? And how do you store them? How to you access them - on demand in an error case, or proactively by triggering alerts? The goal of this article is to give a concise overview and introduction to the aspects of systematic metrics gathering and storage in DIY IOT stack. First, I present a guideline, a set of questions that help for form a metrics gathering approach. Second, I present several concrete applications and systems that take on one or more roles for collection, aggregation and storing metrics. This article originally appeared at my blog admantium.com Metrics Collection and Storage Guideline In your IOT network, applications and technology stacks define available metrics. The first step is to form an inventory of all computers and sensors: Which computers do I have? Which sensors do I own? How does sensor information flow to applications? (push vs. pull) Once you have the answers, a general picture emerges which devices communicate and how data is exchanged. Then, define the list of additional metrics that you would like to record. Do I want to measure the general liveliness of my devices? For my computers, which hardware metrics are essential to monitor? For my computers, which additional hardware metrics are helpful to monitor? For my sensor, which software metrics in addition to the sensor data are helpful to monitor? For all computer metrics: How frequently should a metric being recorded? For all sensor metrics: How frequently should a metric being recorded? When you have answered these questions, the final piece of the puzzle is to determine metrics collection and storage system. Which system collects these metrics? How does the metrics system collect data? (push vs. pull) How long is the metrics data stored? If multiple systems collect data: Should the metrics data aggregated at a single machine? When you understand the metrics system, it’s very possible that you will discover a mismatch between metric data that you want to collect, the data that the metrics system can record, and the data flows between them. Maybe you need to use an additional system, for example a broker, to deliver the data. Or maybe the metrics is simply not available on a system or sensor. This forms a loop that you need to traverse several times to arrive at a concept that is both manageable and sustainable. Practical: Metrics Collection and Storage With the general options considered, lets discuss the practical design space that you have for metrics collection and storage. You need to distinguish and consider the following components or roles for metrics collection: Agent: The system or process that collects metrics from a computer or sensor. The agent can run on the same machine where the metrics originate, or it can run on another machine and contact the target for getting metrics Aggregator: The Aggregator orchestrates the agents to collect the data, and then connects with the store to save the metrics. Store: Long-term storage for metrics data Considering concrete applications, to my surprise, some fit neatly into one role, while others fulfill multiple roles. Some examples for these systems are as follows. Please note that this list is limited to the system that I know about and have been working with. Agent Aggregator Store CollectD X Node Exporter X SNMP X Telegraf X X HomeAssistant X X Node Red X StatsD X Prometehus X X Graphite X X InfluxDB X In the following sections, each application is briefly discussed. CollectD roles: agent CollectD is a small memory footprint Linux metrics configuration. Its installed and configured as a system service and features a huge list of plugins to collect any metric. Here is an example how to collect CPU and disk metrics: Hostname "nexus" Interval 60 LoadPlugin cpu LoadPlugin disk ReportByState true ValuesPercentage true Disk "/sda1/" Disk "/sda2/" Node Exporter roles: agent The Node exporter is an all-purpose metrics collector for Linux system. Delivered as a single binary, it exposes a metrics endpoint that on its host. Here is an example: curl localhost:9000 # HELP node_boot_time_seconds Node boot time, in unixtime. # TYPE node_boot_t
In a self-made IOT stack, several applications provide, parse, and store data. You might have all applications running on the same or several machines. You might have different sensors providing data, and different methods to access and store this data. For a hobby project, this is all well until the point where things are not running anymore.
The very first thing to check should be metrics from all your systems and sensors. Systems, which are conventional or single board computers, can be queried for their load, RAM and disk usage, network utilization. Sensors can be queried for their power consumption, computing cycles. And everything can be measured for their liveness. But how do you collect these metrics? And how do you store them? How to you access them - on demand in an error case, or proactively by triggering alerts?
The goal of this article is to give a concise overview and introduction to the aspects of systematic metrics gathering and storage in DIY IOT stack. First, I present a guideline, a set of questions that help for form a metrics gathering approach. Second, I present several concrete applications and systems that take on one or more roles for collection, aggregation and storing metrics.
This article originally appeared at my blog admantium.com
Metrics Collection and Storage Guideline
In your IOT network, applications and technology stacks define available metrics. The first step is to form an inventory of all computers and sensors:
- Which computers do I have?
- Which sensors do I own?
- How does sensor information flow to applications? (push vs. pull)
Once you have the answers, a general picture emerges which devices communicate and how data is exchanged. Then, define the list of additional metrics that you would like to record.
- Do I want to measure the general liveliness of my devices?
- For my computers, which hardware metrics are essential to monitor?
- For my computers, which additional hardware metrics are helpful to monitor?
- For my sensor, which software metrics in addition to the sensor data are helpful to monitor?
- For all computer metrics: How frequently should a metric being recorded?
- For all sensor metrics: How frequently should a metric being recorded?
When you have answered these questions, the final piece of the puzzle is to determine metrics collection and storage system.
- Which system collects these metrics?
- How does the metrics system collect data? (push vs. pull)
- How long is the metrics data stored?
- If multiple systems collect data: Should the metrics data aggregated at a single machine?
When you understand the metrics system, it’s very possible that you will discover a mismatch between metric data that you want to collect, the data that the metrics system can record, and the data flows between them. Maybe you need to use an additional system, for example a broker, to deliver the data. Or maybe the metrics is simply not available on a system or sensor. This forms a loop that you need to traverse several times to arrive at a concept that is both manageable and sustainable.
Practical: Metrics Collection and Storage
With the general options considered, lets discuss the practical design space that you have for metrics collection and storage. You need to distinguish and consider the following components or roles for metrics collection:
- Agent: The system or process that collects metrics from a computer or sensor. The agent can run on the same machine where the metrics originate, or it can run on another machine and contact the target for getting metrics
- Aggregator: The Aggregator orchestrates the agents to collect the data, and then connects with the store to save the metrics.
- Store: Long-term storage for metrics data
Considering concrete applications, to my surprise, some fit neatly into one role, while others fulfill multiple roles. Some examples for these systems are as follows. Please note that this list is limited to the system that I know about and have been working with.
| Agent | Aggregator | Store | |
|---|---|---|---|
| CollectD | X | ||
| Node Exporter | X | ||
| SNMP | X | ||
| Telegraf | X | X | |
| HomeAssistant | X | X | |
| Node Red | X | ||
| StatsD | X | ||
| Prometehus | X | X | |
| Graphite | X | X | |
| InfluxDB | X |
In the following sections, each application is briefly discussed.
CollectD
roles: agent
CollectD is a small memory footprint Linux metrics configuration. Its installed and configured as a system service and features a huge list of plugins to collect any metric. Here is an example how to collect CPU and disk metrics:
Hostname "nexus"
Interval 60

LoadPlugin cpu
LoadPlugin disk

 cpu>
  ReportByState true
  ValuesPercentage true


 disk>
  Disk "/sda1/"
  Disk "/sda2/"
Node Exporter
roles: agent
The Node exporter is an all-purpose metrics collector for Linux system. Delivered as a single binary, it exposes a metrics endpoint that on its host. Here is an example:
curl localhost:9000

# HELP node_boot_time_seconds Node boot time, in unixtime.
# TYPE node_boot_time_seconds gauge
node_boot_time_seconds 1.642755791e+09
# HELP node_context_switches_total Total number of context switches.
# TYPE node_context_switches_total counter
node_context_switches_total 6.1337805256e+10
# HELP node_cpu_seconds_total Seconds the CPUs spent in each mode.
# TYPE node_cpu_seconds_total counter
node_cpu_seconds_total{cpu="0",mode="idle"} 2.950242349e+07
node_cpu_seconds_total{cpu="0",mode="iowait"} 117189.98
node_cpu_seconds_total{cpu="0",mode="irq"} 0
node_cpu_seconds_total{cpu="0",mode="nice"} 1106.33
node_cpu_seconds_total{cpu="0",mode="softirq"} 24949.86
node_cpu_seconds_total{cpu="0",mode="steal"} 0
node_cpu_seconds_total{cpu="0",mode="system"} 382452.13
SNMP
roles: agent
SNMP is an older protocol for exposing metrics especially of networking devices such as router, switches and firewalls. SNMP capable devices are called and queried with a hierarchical oriented number system that structures the available metrics. For example, to get the system 15 minutes load, you would query for the ID 1.3.6.1.4.1.2021.10.1.3 execute the following command:
snmpwalk -v2c -c public localhost 1.3.6.1.4.1.2021.10.1.3.3

UCD-SNMP-MIB::systemLoad.3 = Counter32: 0.4
Telegraf
roles: agent, aggregator
Telegraf is a highly customizable metrics agent and aggregator.
When running as an agent, it collects data from all configured input plugins. For example, here is the basic configuration for collecting CPU and memory metrics:
[[inputs.cpu]]

[[inputs.mem]]

[agent]
  interval = "60s"
  round_interval = true
As an aggregator, there are likewise several output plugins. Here is an example how to write to an influxdb instance:
[[outputs.influxdb]]
   urls = ["http://influxdb:8086"]
   database = "telegraf"
   write_consistency = "any"
   timeout = "5s"
   # HTTP Basic Auth
   username = REDACTED
   password = REDACTED
Home Assistant
roles: agent, aggregator
Home Assistant is a fully customizable platform. Its main role is to provide a comprehensive dashboard for all kinds of sensors that are connected with very different protocols and technologies. HA also provides automation and scripting for defining programs that react on sensor value, such as triggering a light when movement is detected.
HA can collect hardware metrics from its host by activating the systemmonitor platform in its configuration file:
sensor:
- platform: systemmonitor
  resources:
    - type: disk_use_percent
      arg: /config
    - type: disk_use
    - type: disk_free
    - type: memory_use_percent
    - type: memory_use
    - type: memory_free
    - type: swap_use_percent
    - type: swap_use
    - type: swap_free
    - type: load_1m
    - type: load_5m
    - type: load_15m
    - type: processor_use
    - type: processor_temperature
    - type: last_boot
Basically, all sensor data is stored in an internal database. Given the many different sensor platforms and technologies, you just add them as a sensor and HA starts aggerating the metrics. For example, in order to listen to MQTT messages about CPU temperatures, use this configuration:
- platform: mqtt
  state_topic: '/node/nexus/cpu_temperatures'
  name: 'nexus.metric.cpu_temperature'
  unit_of_measurement: '°C'
Node Red
roles: aggregator
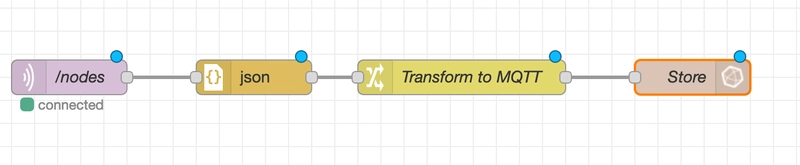
Node Red is a unique application that provides a graphical programming environment. With this, you can define input to output transformation with any level of complexity, including reading, parsing, formatting, and output with optional conditionals. For example, here is a flow definition that parses MQTT JSON messages that communicate if a node is alive, and then store this information in InfluxDB:
StatsD
roles: aggregator
StatsD is a small memory-footprint metrics aggregator. It typically receives metric in a custom one-line format via UDP and will then forward the metric to other systems.
Here is an example configuration from the Github repository that defines the statsd instances to listen on, and the configuration of the metrics server.
// source: https://github.com/statsd/statsd/blob/master/exampleProxyConfig.js
{
  nodes: [
    {host: '127.0.0.1', port: 8127, adminport: 8128},
    {host: '127.0.0.1', port: 8129, adminport: 8130},
    {host: '127.0.0.1', port: 8131, adminport: 8132}
  ],
  server: './servers/udp',
  host:  '0.0.0.0',
  port: 8125,
  udp_version:'udp4',
  mgmt_port: 8126,
  forkCount: 0,
  checkInterval: 1000,
  cacheSize: 10000
}
Prometheus
roles: aggregator, store
Prometheus is a production grade metrics aggregator widely used in the industry. It provides an extensive list of exporters to pull metrics from. For example, to scrape metrics delivered with node exporter, you need to add the following scrape configuration:
  - job_name: 'nodes'
    static_configs:
    - targets: ['http://nexus:9100']
Additional aggregators are provided by the community, such as the mqtt-exporter that listens to MQTT messages and exposes Prometheus compatible metrics.
Prometheus has a built-in timeseries database that stores all collected metrics. Data can be queried by combining the metrics name, attributes of the targets, and additional functions, see some Prometheus query examples
Graphite
roles: aggregator, store
Graphite is composed of three components: Carbon, the metrics aggregator daemon, Whisper, the time series databases that internally uses an SQLite database, and an web frontend for accessing the metrics.
To collect metrics send via TCP that contain the start with the string nodes and which should be buffered for 60s before being send to the database, the following configuration needs to be defined:
[stats]
pattern = ^nodes/.*
retentions = 60s:30d
To access the metrics, the dashboard is typically used, but textual queries are possible too. Here is an example to query the sum of CPU loads:
&target=aggregate(host.cpu.value, "sum")
InfluxDB
roles: store
InfluxDB is a sophisticated time series database tuned for high performance. A datapoint in InfluxDB consists of tags (discrete data), fields (continuous data) and is indexed by a Unix timestamp. Here is an example how temperature data is represented:
> select * from cpu_temperatures limit 10

name: cpu_temperatures
time                node        temperature
----                ----        -----------
1629979793360140718 raspberrypi 51.5
1629981542154078749 raspberrypi 52.6
1629981601660331504 raspberrypi 53.7
Conclusion
Collecting hardware metrics for your IOT devices can be achieved with a plethora of techniques and protocol. In the first part of this article, you saw a guideline, a list of questions about the metrics goals that you want to have. By forming a coherent picture of which devices to monitor, which metrics to collect, and how to store them, you gain a clear picture. In the second part of the article, you learned concrete applications and systems with a short usage example. The systems take on different roles for collecting, aggregating, and storing metrics data. In the next article I will give a concrete realization for metrics monitoring in my IOT stack.


