


![[The AI Show Episode 143]: ChatGPT Revenue Surge, New AGI Timelines, Amazon’s AI Agent, Claude for Education, Model Context Protocol & LLMs Pass the Turing Test](https://www.marketingaiinstitute.com/hubfs/ep%20143%20cover.png)


![From drop-out to software architect with Jason Lengstorf [Podcast #167]](https://cdn.hashnode.com/res/hashnode/image/upload/v1743796461357/f3d19cd7-e6f5-4d7c-8bfc-eb974bc8da68.png?#)


_Zoonar_GmbH_Alamy.jpg?#)


 (1).webp?#)


![Are you buying a new Apple product to avoid tariffs? [Poll]](https://9to5mac.com/wp-content/uploads/sites/6/2025/03/tim-cook-apple-fifth-ave-joz.jpg?quality=82&strip=all&w=290&h=145&crop=1)


![New iOS 19 Leak Allegedly Reveals Updated Icons, Floating Tab Bar, More [Video]](https://www.iclarified.com/images/news/96958/96958/96958-640.jpg)

![Apple to Source More iPhones From India to Offset China Tariff Costs [Report]](https://www.iclarified.com/images/news/96954/96954/96954-640.jpg)


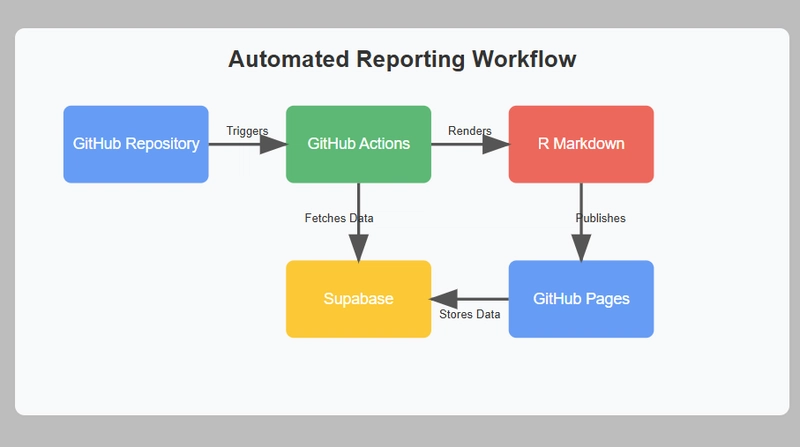
Building Automated Data Reports from Supabase with GitHub Actions and R Markdown
Imagine being able to generate professional data reports automatically every week without lifting a finger. In this guide, I'll walk you through creating an automated reporting system that connects to a Supabase database, analyzes data, and publishes the results as a polished PDF report - all using free tools and services. What We're Building Let's whiz through how this was created, if you want to go straight to the code, visit here: https://github.com/AkanimohOD19A/automated-Rmd-outputs We're going to set up a system that: Connects to your Supabase PostgreSQL database Pulls and analyzes your data Generates beautiful PDF reports with visualizations Publishes these reports to GitHub Pages Does all this automatically on a schedule (or when triggered manually) This setup is perfect for businesses that need regular reporting, data analysis teams, or personal projects where you want to keep an eye on your data trends without manual intervention. Prerequisites Before we start building, we'll need: A GitHub account (obviously) A Supabase account with some data (a free tier would suffice) Basic understanding of R (or willingness to learn) No special hardware or paid services required! Step 1: Setting Up Your Repository First, create a new repository on GitHub to host your reporting project: # Clone the new repository git clone https://github.com/yourusername/your-repo-name.git cd your-repo-name # Create the project structure mkdir -p .github/workflows touch .github/workflows/supabase-auto-reports.yml touch auto-report.Rmd touch README.md Step 2: Creating the GitHub Action Workflow Let's create our automation engine. This GitHub Action will run on a schedule, set up the required environment, and generate our reports. Open or touch .github/workflows/supabase-auto-reports.yml and add: Let's break down the GitHub Actions workflow into its major chunks and explain what each part does. job chunk: Workflow Trigger Configuration name: Generate and Deploy Supabase Report on: schedule: - cron: '0 8 *1*' # i.e every Monday @ 8AM UTC workflow_dispatch: # Allow manual trigger push: branches: master This section defines when the workflow will run. It has three trigger conditions: 1) on a schedule every Monday at 8:00 AM UTC using cron syntax (though there appears to be a syntax error with *1*; it should likely be * * 1), 2) manually through the GitHub UI with workflow_dispatch, and 3) whenever code is pushed to the master branch. The workflow's purpose is to generate and deploy a report using data from Supabase. job chunk: Permissions Configuration permissions: contents: write pages: write id-token: write This section sets the security permissions the workflow needs to function. It requests write access to repository contents (to commit files), GitHub Pages (for deployment), and the ID token (used for authentication). These permissions allow the workflow to make changes to the repository and deploy results to GitHub Pages. Remeber to pass the secrets in the Secrets components on GitHub: Settings > Secrets and variables (Left side) > Actions .. job chunk: Job and Environment Setup jobs: render: runs-on: ubuntu-latest env: SUPABASE_URL: ${{ secrets.SUPABASE_URL }} SUPABASE_KEY: ${{ secrets.SUPABASE_KEY }} This section defines the main job called "render" that will run on the latest Ubuntu runner. It also sets up environment variables by retrieving Supabase credentials (URL and API key) from GitHub repository secrets. These credentials will be used to connect to the Supabase database when generating the report. job chunk: Initial Setup Steps steps: - name: Checkout repository uses: actions/checkout@v4 - name: Set Up R uses: r-lib/actions/setup-r@v2 with: r-version: '4.4.2' - name: Setup Pandoc uses: r-lib/actions/setup-pandoc@v2 with: pandoc-version: '3.1.11.1' These steps prepare the environment for report generation. First, the workflow checks out the repository code using GitHub's checkout action. Then it installs R programming language (version 4.4.2) and Pandoc (version 3.1.11.1). R will be used for data analysis and report generation, while Pandoc helps convert R Markdown documents into the final PDF format. job chunk: System and R Dependencies Installation - name: Install system dependencies run: | sudo apt-get update sudo apt-get install -y libcurl4-openssl-dev libssl-dev libxml2-dev - name: Install R dependencies run: | R -e 'options(repos = c(CRAN = "https://cloud.r-project.org"))' R -e 'install.packages(c("rmarkdown", "knitr"), dependencies=TRUE)' R -e 'install.packages(c("httr", "jsonlite", "dplyr", "ggplot2", "lubridate"), dependencies=TRUE)'
Imagine being able to generate professional data reports automatically every week without lifting a finger. In this guide, I'll walk you through creating an automated reporting system that connects to a Supabase database, analyzes data, and publishes the results as a polished PDF report - all using free tools and services.
What We're Building
Let's whiz through how this was created, if you want to go straight to the code, visit here: https://github.com/AkanimohOD19A/automated-Rmd-outputs
We're going to set up a system that:
- Connects to your Supabase PostgreSQL database
- Pulls and analyzes your data
- Generates beautiful PDF reports with visualizations
- Publishes these reports to GitHub Pages
- Does all this automatically on a schedule (or when triggered manually)
This setup is perfect for businesses that need regular reporting, data analysis teams, or personal projects where you want to keep an eye on your data trends without manual intervention.
Prerequisites
Before we start building, we'll need:
- A GitHub account (obviously)
- A Supabase account with some data (a free tier would suffice)
- Basic understanding of R (or willingness to learn)
- No special hardware or paid services required!
Step 1: Setting Up Your Repository
First, create a new repository on GitHub to host your reporting project:
# Clone the new repository
git clone https://github.com/yourusername/your-repo-name.git
cd your-repo-name

# Create the project structure
mkdir -p .github/workflows
touch .github/workflows/supabase-auto-reports.yml
touch auto-report.Rmd
touch README.md
Step 2: Creating the GitHub Action Workflow
Let's create our automation engine. This GitHub Action will run on a schedule, set up the required environment, and generate our reports.
Open or touch .github/workflows/supabase-auto-reports.yml and add:
Let's break down the GitHub Actions workflow into its major chunks and explain what each part does.
job chunk: Workflow Trigger Configuration
name: Generate and Deploy Supabase Report
on:
  schedule:
    - cron: '0 8 *1*' # i.e every Monday @ 8AM UTC
  workflow_dispatch: # Allow manual trigger
  push:
    branches:
      master
This section defines when the workflow will run. It has three trigger conditions:
1) on a schedule every Monday at 8:00 AM UTC using cron syntax (though there appears to be a syntax error with *1*; it should likely be * * 1),
2) manually through the GitHub UI with workflow_dispatch, and
3) whenever code is pushed to the master branch. The workflow's purpose is to generate and deploy a report using data from Supabase.
job chunk: Permissions Configuration
permissions:
  contents: write
  pages: write
  id-token: write
This section sets the security permissions the workflow needs to function. It requests write access to repository contents (to commit files), GitHub Pages (for deployment), and the ID token (used for authentication). These permissions allow the workflow to make changes to the repository and deploy results to GitHub Pages.
Remeber to pass the secrets in the Secrets components on GitHub:
Settings > Secrets and variables (Left side) > Actions ..
job chunk: Job and Environment Setup
jobs:
  render:
    runs-on: ubuntu-latest
    env:
      SUPABASE_URL: ${{ secrets.SUPABASE_URL }}
      SUPABASE_KEY: ${{ secrets.SUPABASE_KEY }}
This section defines the main job called "render" that will run on the latest Ubuntu runner. It also sets up environment variables by retrieving Supabase credentials (URL and API key) from GitHub repository secrets. These credentials will be used to connect to the Supabase database when generating the report.
job chunk: Initial Setup Steps
    steps:
      - name: Checkout repository
        uses: actions/checkout@v4

      - name: Set Up R
        uses: r-lib/actions/setup-r@v2
        with:
          r-version: '4.4.2'

      - name: Setup Pandoc
        uses: r-lib/actions/setup-pandoc@v2
        with:
          pandoc-version: '3.1.11.1'
These steps prepare the environment for report generation. First, the workflow checks out the repository code using GitHub's checkout action. Then it installs R programming language (version 4.4.2) and Pandoc (version 3.1.11.1). R will be used for data analysis and report generation, while Pandoc helps convert R Markdown documents into the final PDF format.
job chunk: System and R Dependencies Installation
      - name: Install system dependencies
        run: |
          sudo apt-get update
          sudo apt-get install -y libcurl4-openssl-dev libssl-dev libxml2-dev

      - name: Install R dependencies
        run: |
          R -e 'options(repos = c(CRAN = "https://cloud.r-project.org"))'
          R -e 'install.packages(c("rmarkdown", "knitr"), dependencies=TRUE)'
          R -e 'install.packages(c("httr", "jsonlite", "dplyr", "ggplot2", "lubridate"), dependencies=TRUE)'
          R -e 'install.packages(c("tinytex", "DBI", "RPostgres"), dependencies=TRUE)'
          R -e 'tinytex::install_tinytex()'
This section installs all the necessary dependencies. First, Ubuntu system libraries needed for R packages are installed, particularly those required for networking and XML processing. Then, R packages are installed in three batches:
1) rmarkdown and knitr for document generation,
2) data manipulation and visualization packages like dpl*yr and ggplot2, and
3) database connectivity packages like RPostgres for connecting to Supabase. Finally, TinyTeX is installed to enable PDF generation from R Markdown.
job chunk: Credential and Package Verification
      - name: Check Supabase credentials
        run: |
          if [ -z "$SUPABASE_URL" ] || [ -z "$SUPABASE_KEY" ]; then
            echo "Supabase credentials are not properly set in GitHub secrets."
            exit 1
          fi

      - name: Verify R package installation
        run: |
          R -e 'installed_packages <- installed.packages()[,"Package"]; cat("Installed packages:", paste(installed_packages, collapse=", "), "\n")'
          R -e 'if(!"httr" %in% installed.packages()[,"Package"]) { install.packages("httr", dependencies=TRUE); print("Reinstalled httr") }'
          R -e 'library(httr); print("httr loaded successfully")'
These steps perform verification to ensure the workflow can proceed successfully. First, it checks if the Supabase credentials are properly set in the GitHub secrets, failing early if they're missing. Then it verifies R package installation by listing all installed packages and specifically checking for the httr package (which is critical for API communication).
I had some inssues with the httr package, so I added an extra layer of verification if httr isn't found, it attempts to reinstall it and confirm it loads correctly.
job chunk: Report Generation and Status Check
      - name: Render RMarkdown
        run : |
          Rscript -e 'rmarkdown::render("auto-report.Rmd", output_file = "report.pdf")'

      - name: Check Query Status
        id: query_check
        run: |
          if [ -f query_status.txt ] && [ "$(cat query_status.txt)" == "SUCCESS" ]; then
            echo "Query executed successfully, proceeding with deployment."
            echo "query_status=success" >> $GITHUB_OUTPUT
          else
            echo "Query failed, aborting deployment."
            if [ -f error_log.txt ]; then
              echo "Error details:"
              cat error_log.txt
            fi
            echo "query_status=failed" >> $GITHUB_OUTPUT
            exit 1
          fi
This section performs the actual report generation and validation. First, it runs the R script to render an R Markdown file called "auto-report.Rmd" into a PDF report. Then it checks if the process was successful by looking for a "query_status.txt" file that should contain "SUCCESS" if database queries executed properly. If the status check fails, it displays any available error logs and aborts the workflow. This step also sets an output variable that later steps will use to determine whether to proceed with deployment.
job chunk: Deployment Steps
      - name: Deploy PDF
        if: steps.query_check.outputs.query_status == 'success'
        uses: actions/upload-artifact@v4
        with:
          name: supabase-report-pdf
          path: report.pdf

      # Github Pages
      - name: Deploy to Github Pages
        if: steps.query_check.outputs.query_status == 'success'
        uses: peaceiris/actions-gh-pages@v4
        with:
          github_token: ${{ secrets.GITHUB_TOKEN }}
          publish_dir: .
          publish_branch: gh-pages
          keep_files: true
The final section handles deployment of the generated report in two ways, but only if the query status check passed. First, it uploads the PDF as a GitHub Actions artifact : [generated report link](https://github.com/AkanimohOD19A/automated-Rmd-outputs/blob/gh-pages/report.pdf) on the new gh-pages branch, making it available for download directly from the workflow run page. Second, it deploys the entire directory to GitHub Pages using the peaceiris action, publishing to the gh-pages branch while preserving any existing files. This makes the report accessible via a public webpage hosted by GitHub Pages.
This workflow represents an automated reporting pipeline that connects to a Supabase database, generates a PDF report using R and R Markdown, and then publishes that report both as a downloadable artifact and to a website. It's designed to run automatically every Monday, but can also be triggered manually or when changes are pushed to the master branch. Here's the full code
name: Generate and Deploy Supabase Report

on:
  schedule:
    - cron: '0 8 * * 1' # i.e every Monday @ 8AM UTC
  workflow_dispatch: # Allow manual trigger
  push:
    branches:
      master

permissions:
  contents: write
  pages: write
  id-token: write

jobs:
  render:
    runs-on: ubuntu-latest
    env:
      SUPABASE_URL: ${{ secrets.SUPABASE_URL }}
      SUPABASE_KEY: ${{ secrets.SUPABASE_KEY }}

    steps:
      - name: Checkout repository
        uses: actions/checkout@v4

      - name: Set Up R
        uses: r-lib/actions/setup-r@v2
        with:
          r-version: '4.4.2'

      - name: Setup Pandoc
        uses: r-lib/actions/setup-pandoc@v2
        with:
          pandoc-version: '3.1.11.1'

      - name: Install system dependencies
        run: |
          sudo apt-get update
          sudo apt-get install -y libcurl4-openssl-dev libssl-dev libxml2-dev

      - name: Install R dependencies
        run: |
          R -e 'options(repos = c(CRAN = "https://cloud.r-project.org"))'
          R -e 'install.packages(c("rmarkdown", "knitr"), dependencies=TRUE)'
          R -e 'install.packages(c("httr", "jsonlite", "dplyr", "ggplot2", "lubridate"), dependencies=TRUE)'
          R -e 'install.packages(c("tinytex", "DBI", "RPostgres"), dependencies=TRUE)'
          R -e 'tinytex::install_tinytex()'

      - name: Check Supabase credentials
        run: |
          if [ -z "$SUPABASE_URL" ] || [ -z "$SUPABASE_KEY" ]; then
            echo "Supabase credentials are not properly set in GitHub secrets."
            exit 1
          fi

      - name: Verify R package installation
        run: |
          R -e 'installed_packages <- installed.packages()[,"Package"]; cat("Installed packages:", paste(installed_packages, collapse=", "), "\n")'
          R -e 'if(!"httr" %in% installed.packages()[,"Package"]) { install.packages("httr", dependencies=TRUE); print("Reinstalled httr") }'
          R -e 'library(httr); print("httr loaded successfully")'

      - name: Render RMarkdown
        run : |
          Rscript -e 'rmarkdown::render("auto-report.Rmd", output_file = "report.pdf")'

      - name: Check Query Status
        id: query_check
        run: |
          if [ -f query_status.txt ] && [ "$(cat query_status.txt)" == "SUCCESS" ]; then
            echo "Query executed successfully, proceeding with deployment."
            echo "query_status=success" >> $GITHUB_OUTPUT
          else
            echo "Query failed, aborting deployment."
            if [ -f error_log.txt ]; then
              echo "Error details:"
              cat error_log.txt
            fi
            echo "query_status=failed" >> $GITHUB_OUTPUT
            exit 1
          fi

      - name: Deploy PDF
        if: steps.query_check.outputs.query_status == 'success'
        uses: actions/upload-artifact@v4
        with:
          name: supabase-report-pdf
          path: report.pdf

      # Github Pages
      - name: Deploy to Github Pages
        if: steps.query_check.outputs.query_status == 'success'
        uses: peaceiris/actions-gh-pages@v4
        with:
          github_token: ${{ secrets.GITHUB_TOKEN }}
          publish_dir: .
          publish_branch: gh-pages
          keep_files: true
Step 3: Creating the R Markdown Report Template
Having handled the automation job, let's create our report template in R/R.md. This is where the abracadabra happens - connecting to your database, analyzing data, and creating visualizations.
Open auto-report.Rmd or create it with touch auto-report.Rmd and add:
---
title: "Automated Supabase Data Report"
author: "Your Name" # Daniel
date: "`r format(Sys.Date(), '%B %d, %Y')`" # today's date
output: pdf_document
---
`{r setup, include=FALSE}
knitr::opts_chunk$set(echo = FALSE, message = FALSE, warning = FALSE)
library(DBI)
library(RPostgres)
library(dplyr)
library(ggplot2)
library(httr) # For API requests
library(jsonlite) # For JSON parsing
library(lubridate) # For date handling
## Fetch secrets
supabase_url <- Sys.getenv("SUPABASE_URL")
supabase_key <- Sys.getenv("SUPABASE_KEY")
`
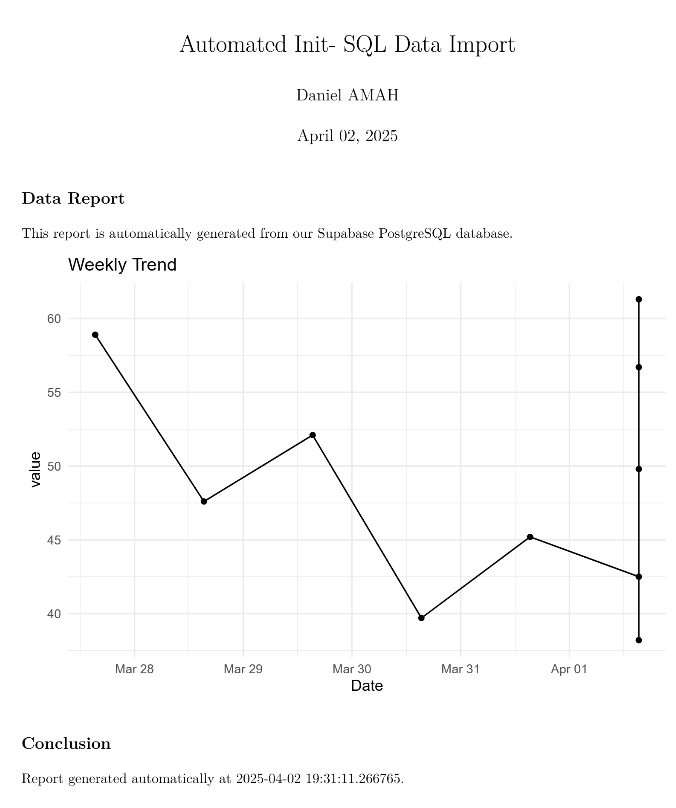
## Automated Database Report
This report is automatically generated from our Supabase PostgreSQL database.
`{r fetch-data}
# Function to fetch data from Supabase using REST API
fetch_supabase_data <- function(url, api_key, table_name, query_params = NULL) {
# Build the API endpoint
endpoint <- paste0(url, "/rest/v1/", table_name)
# Prepare headers
headers <- c(
"apikey" = api_key,
"Authorization" = paste("Bearer", api_key),
"Content-Type" = "application/json",
"Prefer" = "return=representation"
)
# Build query parameters
if (is.null(query_params)) {
# Default: get data from last 7 days
query_params <- list(
# Using Supabase's PostgREST syntax
`created_at` = paste0("gte.", format(Sys.Date() - 7, "%Y-%m-%d"))
)
}
tryCatch({
# Make the GET request
response <- GET(
url = endpoint,
add_headers(.headers = headers),
query = query_params
)
# Check for successful response
if (http_status(response)$category == "Success") {
# Parse the JSON response
data <- fromJSON(content(response, "text", encoding = "UTF-8"), flatten = TRUE)
# Log success
write("SUCCESS", "query_status.txt")
# Convert to data frame if it isn't already
if (!is.data.frame(data)) {
if (length(data) == 0) {
# Return empty data frame with expected columns
data <- data.frame(
id = integer(0),
value = numeric(0),
created_at = character(0),
description = character(0)
)
} else {
data <- as.data.frame(data)
}
}
return(data)
} else {
# Log error
error_msg <- paste("API Error:", http_status(response)$message,
"-", content(response, "text", encoding = "UTF-8"))
write(error_msg, "error_log.txt")
write("FAILED", "query_status.txt")
stop(error_msg)
}
}, error = function(e) {
# Log connection errors
write(paste("ERROR:", e$message), "error_log.txt")
write("FAILED", "query_status.txt")
stop(paste("Supabase API request failed:", e$message))
})
}
# Fetch data from Supabase - replace "your_table_name" with your actual table
data <- fetch_supabase_data(
url = supabase_url,
api_key = supabase_key,
table_name = "your_table_name"
)
`
`{r analyze, eval=file.exists("query_status.txt") && readLines("query_status.txt")[1] == "SUCCESS"}
# Data analysis code runs only if query was successful
# Check if we have data
if(nrow(data) == 0) {
cat("No data available for the selected period.")
} else {
# Convert date strings to proper date objects if needed
if("created_at" %in% colnames(data) && !inherits(data$created_at, "Date")) {
data$created_at <- as_datetime(data$created_at)
}
# Summary statistics
summary_stats <- data %>%
summarize(
count = n(),
avg_value = mean(value, na.rm = TRUE),
max_value = max(value, na.rm = TRUE),
min_value = min(value, na.rm = TRUE)
)
knitr::kable(summary_stats, caption = "Summary Statistics")
# Create a visualization
ggplot(data, aes(x = created_at, y = value)) +
geom_line() +
geom_point() +
theme_minimal() +
labs(title = "Weekly Trend", x = "Date", y = "Value")
}
`
## Conclusion
Report generated automatically at `r Sys.time()`.
Without breaking going too deep into what's happening, our template does a few remarkable bits - asides the queries set up for connection with Supabase it incorporates logging and testing with the queries passed to error and the query txt files.
Make sure NOT to expose your credentials - create a .Renviron file and pass your secrets as well as echo .Renviron > .gitignore when you push to Github.
Step 4: Setting Up Your Supabase Connection
To connect securely to Supabase, you'll need to add your credentials as GitHub Secrets:
- In your GitHub repository, go to Settings → Secrets and variables → Actions → New repository secret
- Add two secrets:
-
SUPABASE_URL: Your Supabase project URL (looks likehttps://yourproject.supabase.co) -
SUPABASE_KEY: Your Supabase service role API key
-
Step 5: Customizing the Report for Your Data
The template we created is minimal (for PoC) and just a starting point. You'll want to customize it based on your specific data structure and analysis needs:
-
Change the table name: Replace
"your_table_name"with your actual Supabase table name - Adjust the query parameters: Modify the date filters or add additional filters based on your needs
- Enhance the analysis: Add more complex statistics or visualizations
For example, if you wanted to add a bar chart showing counts by category:
# Add this to your analysis R chunk
if("category" %in% colnames(data)) {
  # Create category summary
  cat_summary <- data %>%
    group_by(category) %>%
    summarize(count = n()) %>%
    arrange(desc(count))

  # Plot categories
  ggplot(cat_summary, aes(x = reorder(category, -count), y = count)) +
    geom_bar(stat = "identity", fill = "steelblue") +
    theme_minimal() +
    labs(title = "Data by Category", x = "Category", y = "Count") +
    theme(axis.text.x = element_text(angle = 45, hjust = 1))
}
Step 6: Testing Locally Before Deployment
Before committing your changes, it's a good idea to test your report locally:
- Visit your
.Renvironfile in your project root (make sure to add it to.gitignore):
SUPABASE_URL=your_supabase_url_here
SUPABASE_KEY=your_supabase_key_here
- Install the required R packages:
install.packages(c("rmarkdown", "knitr", "httr", "jsonlite",
                  "dplyr", "ggplot2", "lubridate", "DBI", "RPostgres"))
- Render your report:
rmarkdown::render("auto-report.Rmd", output_file = "test-report.pdf")
If everything works correctly, you should see a test-report.pdf file with your data analysis!
Step 7: Committing and Pushing Your Code
Once you're ready, commit your changes and push them to GitHub:
git add .
git commit -m "Initial setup of automated Supabase reporting"
git push origin master
This will trigger your workflow for the first time (if you included the push trigger).
Step 8: Monitoring and Troubleshooting
After your code is pushed, head to the "Actions" tab in your GitHub repository to monitor the workflow execution:
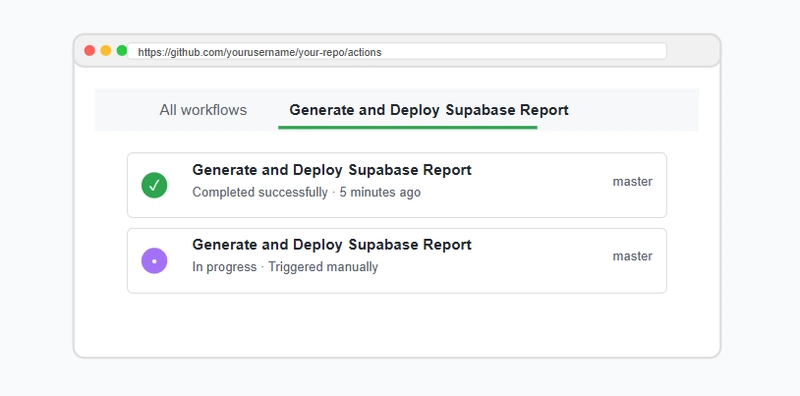
Common issues and solutions:
- Missing packages: If you see errors about missing R packages, make sure they're all listed in the install step
- Authentication issues: Double-check your Supabase credentials in GitHub Secrets
- Table not found: Verify that your table name is correct and accessible with your API key
- Empty data: Make sure your date filters aren't too restrictive
Step 9: Accessing Your Reports
Once the workflow completes successfully, you can access your reports in two ways:
- As workflow artifacts: In the GitHub Actions run details page
-
On GitHub Pages: At
https://yourusername.github.io/your-repo-name/report.pdf
That's it, or there's more on how you take it further!
Advanced Customizations
Once you have the basic system working, here are some ways to enhance it:
1. Multiple Reports
You can generate multiple reports for different data sources by modifying your R Markdown:
# First report
rmarkdown::render("sales-report.Rmd", output_file = "sales-report.pdf")

# Second report
rmarkdown::render("customer-report.Rmd", output_file = "customer-report.pdf")
2. Interactive Dashboard
Instead of a static PDF, you can generate an HTML report with interactive elements:
---
title: "Interactive Dashboard"
output:
  flexdashboard::flex_dashboard:
    theme: united
    orientation: rows
---
3. Email Notifications
Add email notifications when reports are generated:
- name: Send Email
  if: steps.query_check.outputs.query_status == 'success'
  uses: dawidd6/action-send-mail@v3
  with:
    server_address: smtp.gmail.com
    server_port: 465
    username: ${{ secrets.EMAIL_USERNAME }}
    password: ${{ secrets.EMAIL_PASSWORD }}
    subject: New Report Available
    body: A new report has been generated and is available at https://yourusername.github.io/your-repo-name/report.pdf
    to: recipient@example.com
Troubleshooting Guide
When this was been built, a lot of errors were met and you've just got to build a tolerance for these failures as well as take a systematic approach to debugging:
- Check workflow logs: The GitHub Actions tab provides detailed logs of what happened
- Examine error files: Look at error_log.txt for specific error messages
- Try locally: Test your R Markdown file locally with the same data
- Isolate components: Test the Supabase connection separately from the analysis code
- Simplify: Remove complex analyses temporarily to identify problematic code
Conclusion
Congrats! You've built an automated data reporting system that runs on its own schedule, pulls data from your database, generates beautiful reports, and publishes them automatically. This system can save hours of manual work and ensures your reports are always up-to-date.
The beauty of this approach is its flexibility - you can adapt it to any kind of data analysis task, and since it's all based on free tools and services, you can scale it at no additional cost.
Remember that this is just a starting point, it takes a bit of everything - analytics with sql, R and ggplot2, orchestration with linux/ubuntu, github actions and .db provisioning with Supabase. As you become more comfortable with the system, you can add more complex analyses, different visualization types, or even branch out into machine learning predictions based on your data.
Build something cool, today.