


![[Free Webinar] Guide to Securing Your Entire Identity Lifecycle Against AI-Powered Threats](https://blogger.googleusercontent.com/img/b/R29vZ2xl/AVvXsEjqbZf4bsDp6ei3fmQ8swm7GB5XoRrhZSFE7ZNhRLFO49KlmdgpIDCZWMSv7rydpEShIrNb9crnH5p6mFZbURzO5HC9I4RlzJazBBw5aHOTmI38sqiZIWPldRqut4bTgegipjOk5VgktVOwCKF_ncLeBX-pMTO_GMVMfbzZbf8eAj21V04y_NiOaSApGkM/s1600/webinar-play.jpg?#)


![[The AI Show Episode 145]: OpenAI Releases o3 and o4-mini, AI Is Causing “Quiet Layoffs,” Executive Order on Youth AI Education & GPT-4o’s Controversial Update](https://www.marketingaiinstitute.com/hubfs/ep%20145%20cover.png)


-xl.jpg)


![New Hands-On iPhone 17 Dummy Video Shows Off Ultra-Thin Air Model, Updated Pro Designs [Video]](https://www.iclarified.com/images/news/97171/97171/97171-640.jpg)
![Apple Shares Trailer for First Immersive Feature Film 'Bono: Stories of Surrender' [Video]](https://www.iclarified.com/images/news/97168/97168/97168-640.jpg)


Vector: A lightweight tool for collecting EKS application logs with long-term storage capabilities
About Vector Vector is a high-performance observability data pipeline tool developed by Datadog that puts organizations in control of their observability data. Collect, transform, and route all your logs, metrics, and traces to any vendors you want today and any other vendors you may want tomorrow. Vector enables dramatic cost reduction, novel data enrichment, and data security where you need it, not where is most convenient for your vendors. Open source and up to 10x faster than every alternative. AWS Architecture In this article, we present an architecture that demonstrates how to collect application logs from Amazon Elastic Kubernetes Service (Amazon EKS) via Vector, store them in Amazon Simple Storage Service (Amazon S3) for long-term retention, and finally query these logs using AWS Glue and Amazon Athena. The architecture diagram is as below: Let's build this Step by Step! 1. Create an S3 bucket for long-term log retention Make sure AWS CLI is installed. aws s3api create-bucket --bucket my-vector-demo --region ap-northeast-1 [Note]: Replace my-vector-demo with your own S3 bucket name. 2. Create IAM Policy for Vector Agent aws iam create-policy \ --policy-name vector-s3-access \ --policy-document file://vector-iam-policy.json vector-iam-policy.json { "Version": "2012-10-17", "Statement": [ { "Sid": "S3PutObject", "Effect": "Allow", "Action": [ "s3:GetObject", "s3:PutObject", "s3:PutObjectAcl" ], "Resource": "arn:aws:s3:::my-vector-demo/*" }, { "Sid": "S3ListBucket", "Effect": "Allow", "Action": [ "s3:GetBucketLocation", "s3:ListBucket" ], "Resource": "arn:aws:s3:::my-vector-demo" } ] } [Note]: Replace my-vector-demo with S3 bucket name same as Step 1. 3. Create EKS Cluster Create ESK cluster via eksctl: eksctl create cluster -f cluster.yaml cluster.yaml apiVersion: eksctl.io/v1alpha5 kind: ClusterConfig metadata: name: my-vector-cluster region: ap-northeast-1 version: "1.32" vpc: cidr: "192.168.0.0/16" addons: - name: vpc-cni attachPolicyARNs: - arn:aws:iam::aws:policy/AmazonEKS_CNI_Policy resolveConflicts: overwrite - name: eks-pod-identity-agent iam: withOIDC: true podIdentityAssociations: - namespace: vector serviceAccountName: vector-sa roleName: pod-identity-role-vector createServiceAccount: true permissionPolicyARNs: ["arn:aws:iam::115789992589:policy/vector-s3-access"] managedNodeGroups: - name: application-ng instanceType: t3a.small desiredCapacity: 2 minSize: 2 maxSize: 3 amiFamily: Bottlerocket ssh: allow: false volumeSize: 20 volumeEncrypted: true It will take approximately 10-15 minutes for your Cluster to be created. Once it's created, you can interact with your EKS cluster using kubectl. [Note]: Replace 115789992589 with your own 12-digit AWS Account Number. 4. Deploy a Log Generator Application Apply YAML file to EKS cluster. kubectl apply -f log-generator.yaml log-generator.yaml apiVersion: v1 kind: Namespace metadata: name: log-generator labels: app: flog --- apiVersion: apps/v1 kind: Deployment metadata: name: flog namespace: log-generator spec: replicas: 2 selector: matchLabels: app: flog template: metadata: labels: app: flog spec: containers: - name: flog image: mingrammer/flog:0.4.3 args: ["-f", "json", "-d", "5s", "-t", "stdout", "-l"] ports: - containerPort: 80 --- apiVersion: v1 kind: Service metadata: name: flog namespace: log-generator spec: selector: app: flog ports: - protocol: TCP port: 80 targetPort: 80 type: ClusterIP This log generator application will generate a JSON format log payload every 5 seconds and print it out using stdout. Check log generator application readiness: kubectl get all -n log-generator You will see two pods running in the log-generator namespace. NAME READY STATUS RESTARTS AGE pod/flog-6776c79fc5-9mnqh 1/1 Running 0 10s pod/flog-6776c79fc5-rp7sp 1/1 Running 0 10s NAME TYPE CLUSTER-IP EXTERNAL-IP PORT(S) AGE service/flog ClusterIP 10.100.217.73 80/TCP 10s NAME READY UP-TO-DATE AVAILABLE AGE deployment.apps/flog 2/2 2 2 11s NAME DESIRED CURRENT READY AGE replicaset.apps/flog-6776c79fc5 2 2 2 11s The log generator application log payloads are as below: {"host":"82.43.196.160", "user-identifier":"-", "datetime":
About Vector
Vector is a high-performance observability data pipeline tool developed by Datadog that puts organizations in control of their observability data. Collect, transform, and route all your logs, metrics, and traces to any vendors you want today and any other vendors you may want tomorrow. Vector enables dramatic cost reduction, novel data enrichment, and data security where you need it, not where is most convenient for your vendors. Open source and up to 10x faster than every alternative.
AWS Architecture
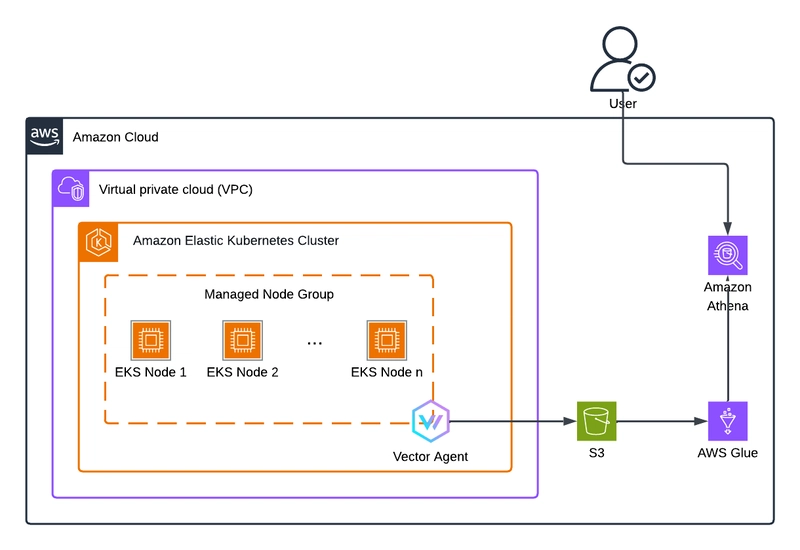
In this article, we present an architecture that demonstrates how to collect application logs from Amazon Elastic Kubernetes Service (Amazon EKS) via Vector, store them in Amazon Simple Storage Service (Amazon S3) for long-term retention, and finally query these logs using AWS Glue and Amazon Athena.
The architecture diagram is as below:
Let's build this Step by Step!
1. Create an S3 bucket for long-term log retention
Make sure AWS CLI is installed.
aws s3api create-bucket --bucket my-vector-demo --region ap-northeast-1
[Note]: Replace my-vector-demo with your own S3 bucket name.
2. Create IAM Policy for Vector Agent
aws iam create-policy \
    --policy-name vector-s3-access \
    --policy-document file://vector-iam-policy.json
vector-iam-policy.json
{
    "Version": "2012-10-17",
    "Statement": [
        {
            "Sid": "S3PutObject",
            "Effect": "Allow",
            "Action": [
                "s3:GetObject",
                "s3:PutObject",
                "s3:PutObjectAcl"
            ],
            "Resource": "arn:aws:s3:::my-vector-demo/*"
        },
        {
            "Sid": "S3ListBucket",
            "Effect": "Allow",
            "Action": [
                "s3:GetBucketLocation",
                "s3:ListBucket"
            ],
            "Resource": "arn:aws:s3:::my-vector-demo"
        }
    ]
}
[Note]: Replace my-vector-demo with S3 bucket name same as Step 1.
3. Create EKS Cluster
Create ESK cluster via eksctl:
eksctl create cluster -f cluster.yaml
cluster.yaml
apiVersion: eksctl.io/v1alpha5
kind: ClusterConfig

metadata:
  name: my-vector-cluster
  region: ap-northeast-1
  version: "1.32"

vpc:
  cidr: "192.168.0.0/16"

addons:
- name: vpc-cni
  attachPolicyARNs:
    - arn:aws:iam::aws:policy/AmazonEKS_CNI_Policy
  resolveConflicts: overwrite
- name: eks-pod-identity-agent

iam:
  withOIDC: true
  podIdentityAssociations:
  - namespace: vector
    serviceAccountName: vector-sa
    roleName: pod-identity-role-vector
    createServiceAccount: true
    permissionPolicyARNs: ["arn:aws:iam::115789992589:policy/vector-s3-access"]

managedNodeGroups:
  - name: application-ng
    instanceType: t3a.small
    desiredCapacity: 2
    minSize: 2
    maxSize: 3
    amiFamily: Bottlerocket
    ssh:
      allow: false
    volumeSize: 20
    volumeEncrypted: true
It will take approximately 10-15 minutes for your Cluster to be created. Once it's created, you can interact with your EKS cluster using kubectl.
[Note]: Replace 115789992589 with your own 12-digit AWS Account Number.
4. Deploy a Log Generator Application
Apply YAML file to EKS cluster.
kubectl apply -f log-generator.yaml
log-generator.yaml
apiVersion: v1
kind: Namespace
metadata:
  name: log-generator
  labels:
    app: flog
---
apiVersion: apps/v1
kind: Deployment
metadata:
  name: flog
  namespace: log-generator
spec:
  replicas: 2
  selector:
    matchLabels:
      app: flog
  template:
    metadata:
      labels:
        app: flog
    spec:
      containers:
        - name: flog
          image: mingrammer/flog:0.4.3
          args: ["-f", "json", "-d", "5s", "-t", "stdout", "-l"]
          ports:
            - containerPort: 80
---
apiVersion: v1
kind: Service
metadata:
  name: flog
  namespace: log-generator
spec:
  selector:
    app: flog
  ports:
    - protocol: TCP
      port: 80
      targetPort: 80
  type: ClusterIP
This log generator application will generate a JSON format log payload every 5 seconds and print it out using stdout.
Check log generator application readiness:
kubectl get all -n log-generator
You will see two pods running in the log-generator namespace.
NAME                        READY   STATUS    RESTARTS   AGE
pod/flog-6776c79fc5-9mnqh   1/1     Running   0          10s
pod/flog-6776c79fc5-rp7sp   1/1     Running   0          10s

NAME           TYPE        CLUSTER-IP      EXTERNAL-IP   PORT(S)   AGE
service/flog   ClusterIP   10.100.217.73           80/TCP    10s

NAME                   READY   UP-TO-DATE   AVAILABLE   AGE
deployment.apps/flog   2/2     2            2           11s

NAME                              DESIRED   CURRENT   READY   AGE
replicaset.apps/flog-6776c79fc5   2         2         2       11s
The log generator application log payloads are as below:
{"host":"82.43.196.160", "user-identifier":"-", "datetime":"29/Apr/2025:06:15:41 +0000", "method": "GET", "request": "/expedite/target/disintermediate", "protocol":"HTTP/1.1", "status":304, "bytes":11362, "referer": "https://www.corporatedeliver.io/transform"}
{"host":"83.122.146.62", "user-identifier":"-", "datetime":"29/Apr/2025:06:15:46 +0000", "method": "GET", "request": "/ubiquitous", "protocol":"HTTP/1.0", "status":304, "bytes":8663, "referer": "https://www.dynamicvortals.com/incubate/interfaces/grow/leverage"}
{"host":"55.206.219.132", "user-identifier":"grimes1800", "datetime":"29/Apr/2025:06:15:51 +0000", "method": "POST", "request": "/strategic/global/exploit", "protocol":"HTTP/1.1", "status":504, "bytes":24205, "referer": "https://www.nationale-markets.net/mesh"}
5. Deploy Vector Agent
Make sure Helm is installed.
helm repo add vector https://helm.vector.dev
helm repo update

helm install vector vector/vector --namespace vector --create-namespace --values values.yaml
values.yaml
# Each role is created with the following workloads:
# Agent = DaemonSet
# Aggregator = StatefulSet
# Stateless-Aggregator = Deployment
role: "Agent"

serviceAccount:
  create: false
  annotations:
    eks.amazonaws.com/role-arn: arn:aws:iam::115789992589:role/pod-identity-role-vector
  name: vector-sa
  automountToken: true

containerPorts:
  - containerPort: 80
    name: http

service:
  enabled: true
  type: "ClusterIP"
  ports:
    - port: 80
      name: http

# customConfig -- Override Vector's default configs, if used **all** options need to be specified. This section supports
# using helm templates to populate dynamic values. See Vector's [configuration documentation](https://vector.dev/docs/reference/configuration/)
# for all options.
customConfig:
  data_dir: /vector-data-dir
  api:
    enabled: false
  sources:
    my_eks_cluster_logs:
      type: kubernetes_logs
      exclude_paths_glob_patterns:
        - "/var/log/pods/kube-system_*/**"
  transforms:
    modify:
      type: remap
      inputs:
        - my_eks_cluster_logs
      source: |
        del(.file)
        del(.kubernetes.pod_ip)
        del(.kubernetes.pod_ips)
        del(.kubernetes.pod_owner)
        del(.kubernetes.pod_uid)
        del(.kubernetes.source_type)
        del(.kubernetes.stream)
        del(.kubernetes.node_labels)
        del(.kubernetes.pod_labels)
        del(.kubernetes.pod_node_name)
        del(.kubernetes.namespace_labels)
        del(.kubernetes.container_id)
        del(.kubernetes.container_image_id)
        del(.stream)
        del(.source_type)
        .timestamp = now()
        .message = parse_json!(string!(.message))
        .message.user_identifier = .message."user-identifier"
        del(.message.bytes)
        del(.message.datetime)
        del(.message."user-identifier")
  sinks:
    s3:
      inputs:
        - modify
      type: aws_s3
      region: ap-northeast-1
      bucket: my-vector-demo
      key_prefix: date=%Y-%m-%d/
      framing:
        method: newline_delimited
      compression: none
      encoding:
        codec: json
Check Vector Agent readiness:
kubectl get all -n vector
You will see two pods running as daemonset in the vector namespace.
NAME               READY   STATUS    RESTARTS   AGE
pod/vector-gkd5j   1/1     Running   0          3s
pod/vector-lwj85   1/1     Running   0          3s

NAME                      TYPE        CLUSTER-IP    EXTERNAL-IP   PORT(S)   AGE
service/vector            ClusterIP   10.100.2.99           80/TCP    3s
service/vector-headless   ClusterIP   None                  80/TCP    3s

NAME                    DESIRED   CURRENT   READY   UP-TO-DATE   AVAILABLE   NODE SELECTOR   AGE
daemonset.apps/vector   2         2         2       2            2                     3s
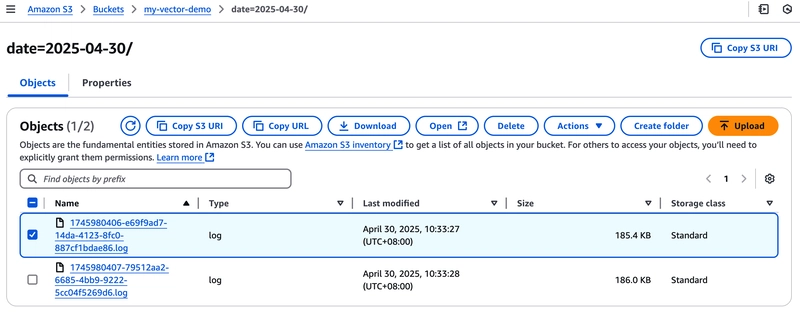
Wait around 3-5 minutes you will see your log placed in the S3 bucket.
Let's deep dive into the three parts of Helm Chart values.yaml file: customConfig.source, customConfig.transforms, and customConfig.sinks before forward to the next step.
Vector provides a lot of observability data sources:
https://vector.dev/docs/reference/configuration/sources/
We use kubernetes_logs (Line 3) data source type in this demonstration. Then ignore all of the application logs in kube-system (Line 4-5) namespace. We just need our log generator application logs.
For more detailed configurations for kubernetes_logs data source type please refer to:
https://vector.dev/docs/reference/configuration/sources/kubernetes_logs/
customConfig.source
1  sources:
2    my_eks_cluster_logs:
3      type: kubernetes_logs
4      exclude_paths_glob_patterns:
5        - "/var/log/pods/kube-system_*/**"
After completing the previous step, the log pattern you obtained will look like this:
{"file":"/var/log/pods/log-generator_flog-6776c79fc5-r9npr_5eaef748-8dfa-4159-8095-1f072bbe56f7/flog/0.log","kubernetes":{"container_id":"containerd://c9e33cff88b3ddc9d76f78afc9c1def2f90818d490d92e648e4aa72c68c52f6e","container_image":"mingrammer/flog:0.4.3","container_image_id":"docker.io/mingrammer/flog@sha256:44180f8610fab7d4c29ff233a79e19cf28bd425c1737aa59c72c1f66613fdf41","container_name":"flog","namespace_labels":{"app":"flog","kubernetes.io/metadata.name":"log-generator"},"node_labels":{"alpha.eksctl.io/cluster-name":"my-vector-cluster","alpha.eksctl.io/nodegroup-name":"application-ng","beta.kubernetes.io/arch":"amd64","beta.kubernetes.io/instance-type":"t3a.small","beta.kubernetes.io/os":"linux","eks.amazonaws.com/capacityType":"ON_DEMAND","eks.amazonaws.com/nodegroup":"application-ng","eks.amazonaws.com/nodegroup-image":"ami-0c584e04243563b1d","eks.amazonaws.com/sourceLaunchTemplateId":"lt-0de21881415806411","eks.amazonaws.com/sourceLaunchTemplateVersion":"1","failure-domain.beta.kubernetes.io/region":"ap-northeast-1","failure-domain.beta.kubernetes.io/zone":"ap-northeast-1a","k8s.io/cloud-provider-aws":"d856828657925fb2e15850b3e197f9d7","kubernetes.io/arch":"amd64","kubernetes.io/hostname":"ip-192-168-4-74.ap-northeast-1.compute.internal","kubernetes.io/os":"linux","node.kubernetes.io/instance-type":"t3a.small","topology.k8s.aws/zone-id":"apne1-az4","topology.kubernetes.io/region":"ap-northeast-1","topology.kubernetes.io/zone":"ap-northeast-1a"},"pod_ip":"192.168.7.43","pod_ips":["192.168.7.43"],"pod_labels":{"app":"flog","pod-template-hash":"6776c79fc5"},"pod_name":"flog-6776c79fc5-r9npr","pod_namespace":"log-generator","pod_node_name":"ip-192-168-4-74.ap-northeast-1.compute.internal","pod_owner":"ReplicaSet/flog-6776c79fc5","pod_uid":"5eaef748-8dfa-4159-8095-1f072bbe56f7"},"message":"{\"host\":\"192.53.77.232\", \"user-identifier\":\"-\", \"datetime\":\"30/Apr/2025:02:26:18 +0000\", \"method\": \"PUT\", \"request\": \"/web-readiness/networks/interfaces\", \"protocol\":\"HTTP/1.0\", \"status\":416, \"bytes\":10254, \"referer\": \"https://www.humanmatrix.info/evolve/wireless/enhance/engage\"}","source_type":"kubernetes_logs","stream":"stdout","timestamp":"2025-04-30T02:26:23.090690200Z"}
In addition to the logs generated by the log generator application itself, you will find that a lot of Kubernetes-related information (e.g., namespace_labels, instance-type, or region) has been added.
Our log generator application log has been added with a lot of \ symbols.
Here we will demonstrate how to remove some information that we don't need, remove \ symbols, and add timestamps to our logs payload.
Vector provides a feature called Vector Remap Language (VRL), which is an expression-oriented language designed for transforming observability data (logs and metrics) in a safe and performant manner.
You can use VRL Playground to test your Remap Language with your log payload.
(1) del() (Lines 7-21 and 25-27): is used to delete the Key/Value of your log payload.
(2) .timestamp = now() (Line 22): Add a timestamp to your log payload.
(3) .message = parse_json!(string!(.message)) (Line 23): Convert message string to JSON object, this action will remove the \ symbols at the same time.
(4) .message.user_identifier = .message."user-identifier" (Line 24): Situations with hyphens often require many exceptions, so we convert them to underscores for representation.
Here's also the playground for these transforms. You can experiment with it to better understand the entire Vector Remap Language transformation process.
customConfig.transforms
1   transforms:
2     modify:
3       type: remap
4       inputs:
5         - my_eks_cluster_logs
6       source: |
7         del(.file)
8         del(.kubernetes.pod_ip)
9         del(.kubernetes.pod_ips)
10        del(.kubernetes.pod_owner)
11        del(.kubernetes.pod_uid)
12        del(.kubernetes.source_type)
13        del(.kubernetes.stream)
14        del(.kubernetes.node_labels)
15        del(.kubernetes.pod_labels)
16        del(.kubernetes.pod_node_name)
17        del(.kubernetes.namespace_labels)
18        del(.kubernetes.container_id)
19        del(.kubernetes.container_image_id)
20        del(.stream)
21        del(.source_type)
22        .timestamp = now()
23        .message = parse_json!(string!(.message))
24        .message.user_identifier = .message."user-identifier"
25        del(.message.bytes)
26        del(.message.datetime)
27        del(.message."user-identifier")
The transformed result as below:
{
    "kubernetes": {
        "container_image": "mingrammer/flog:0.4.3",
        "container_name": "flog",
        "pod_name": "flog-6776c79fc5-r9npr",
        "pod_namespace": "log-generator"
    },
    "message": {
        "host": "192.53.77.232",
        "method": "PUT",
        "protocol": "HTTP/1.0",
        "referer": "https://www.humanmatrix.info/evolve/wireless/enhance/engage",
        "request": "/web-readiness/networks/interfaces",
        "status": 416,
        "user_identifier": "-"
    },
    "timestamp": "2025-04-30T02:51:38.078Z"
}
Vector provides a variety of destinations to deliver your observability data.
https://vector.dev/docs/reference/configuration/sinks/
We use AWS S3 as our destination in this demonstration.
For more detailed configurations for AWS S3 destination please refer to:
https://vector.dev/docs/reference/configuration/sinks/aws_s3/
The most important things to note are these three settings:
(1) Set destination type as aws_s3 (Line 5).
(2) Set region name and bucket name (Lines 6-7).
(3) Set encoding codec as JSON format (Line 13).
customConfig.sinks
1   sinks:
2     s3:
3       inputs:
4         - modify
5       type: aws_s3
6       region: ap-northeast-1
7       bucket: my-vector-demo
8       key_prefix: date=%Y-%m-%d/
9       framing:
10        method: newline_delimited
11      compression: none
12      encoding:
13        codec: json
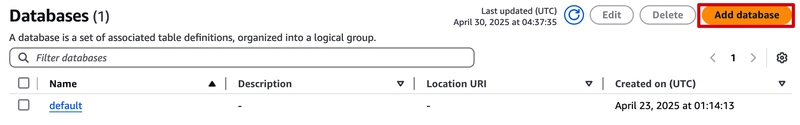
6. Crawler logs from AWS S3 to AWS Glue - Data Catalog Tables
Move to AWS Glue console and click Add tables using crawler:
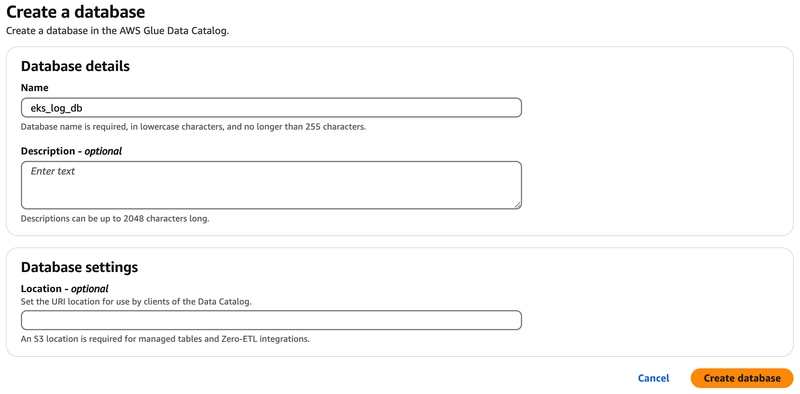
Create a database:
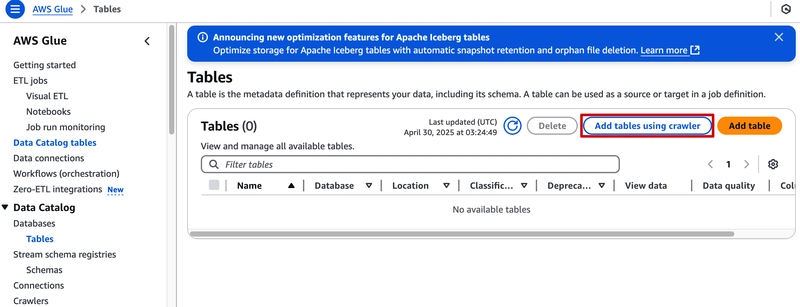
Move to Tables and click Add tables using crawler:
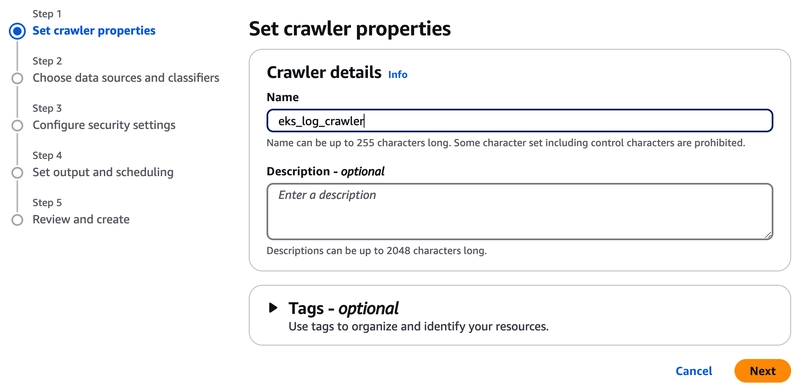
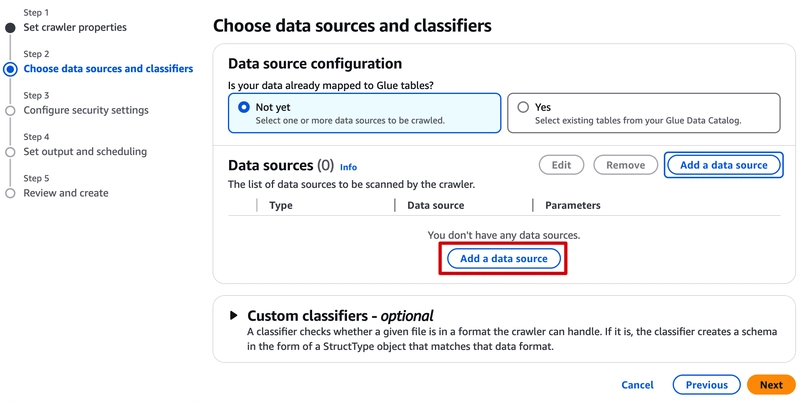
Set the crawler properties:
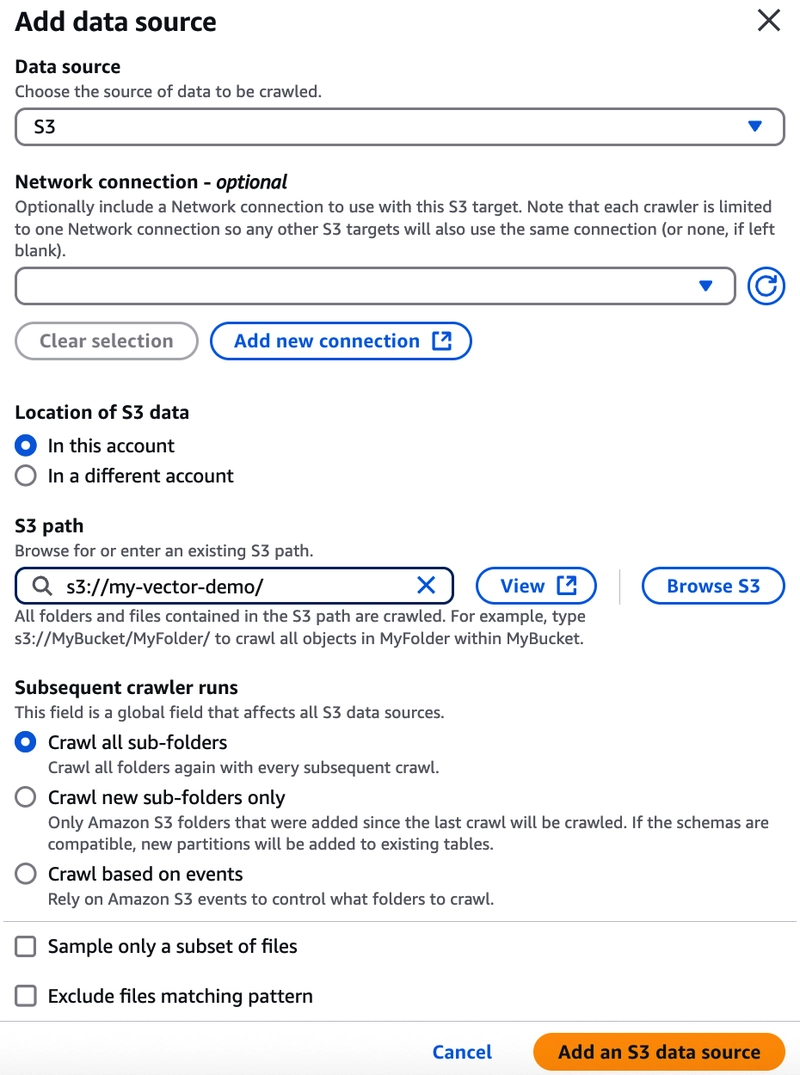
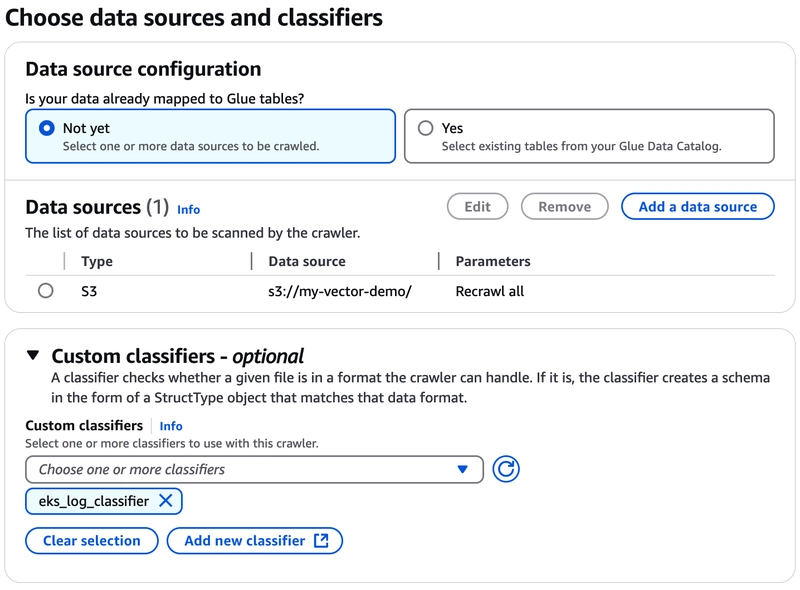
Add a data source:
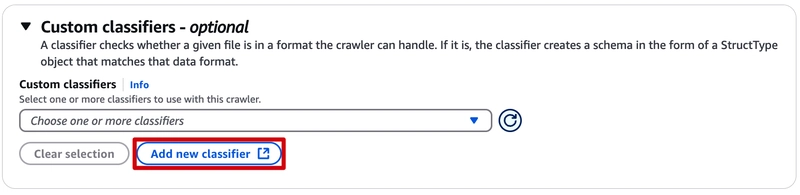
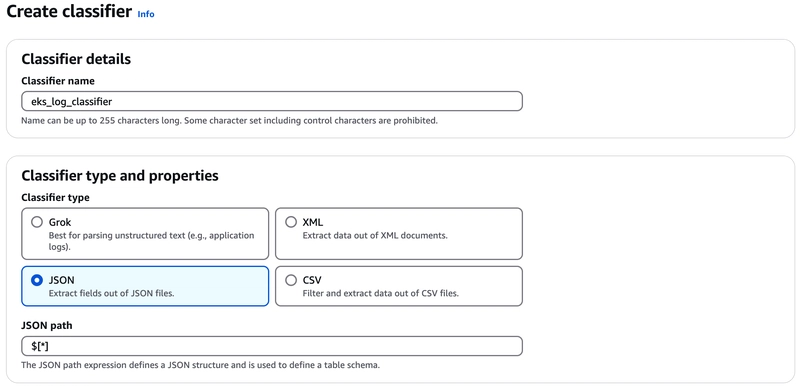
Add a Custom classifiers:
Data source and Custom classifiers are all set, move to the next step.
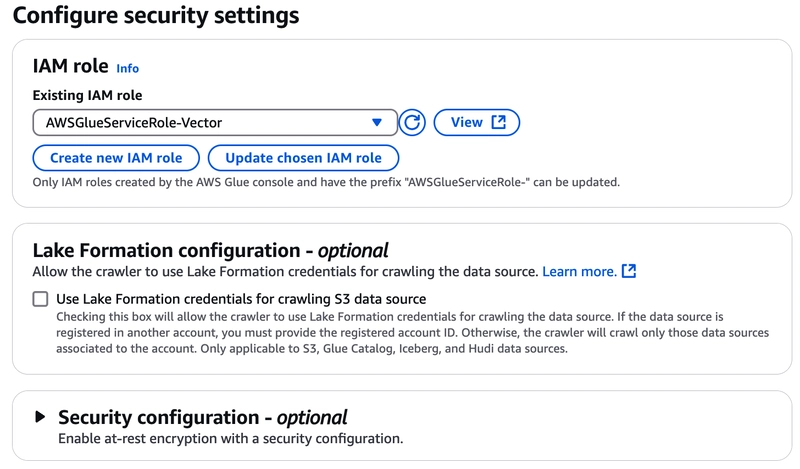
Select an IAM Role:
You can click the `Create new IAM Role' button to create a new IAM Role if you don't have an IAM Role.
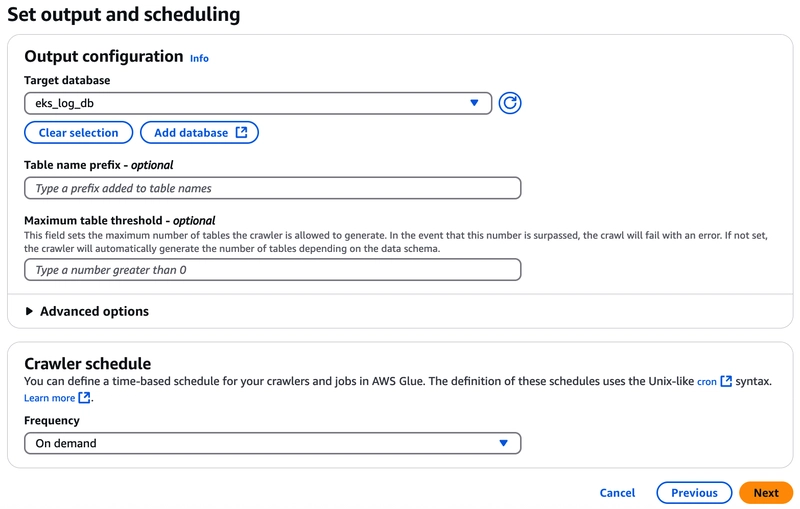
Set output and scheduling:
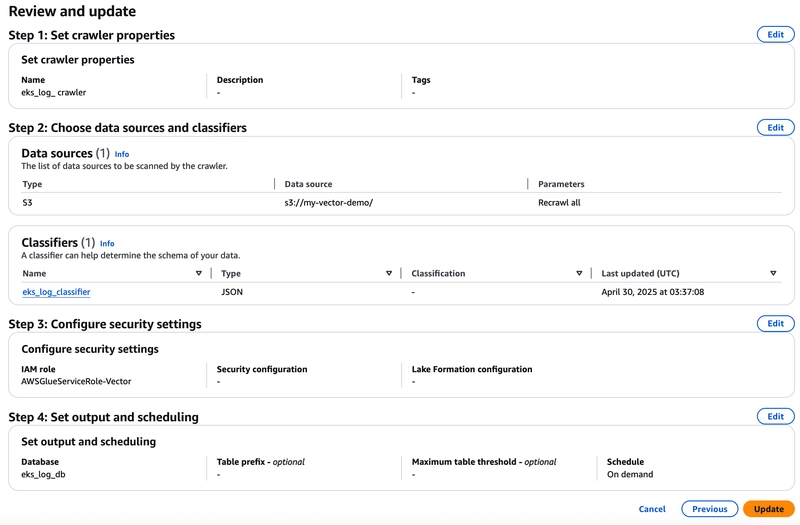
Double-check all of the configurations then click Create crawler button:
Click `Run crawler' button:
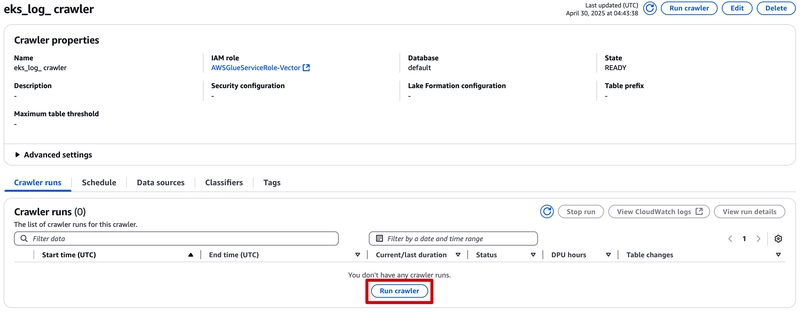
Wait for around 3-5 minutes till the Crawler job is completed.
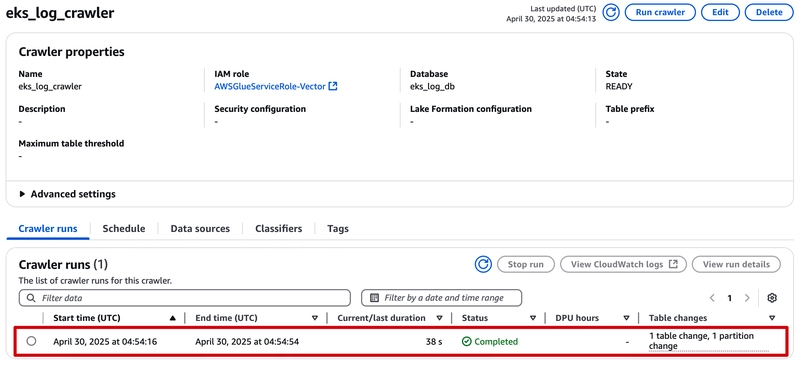
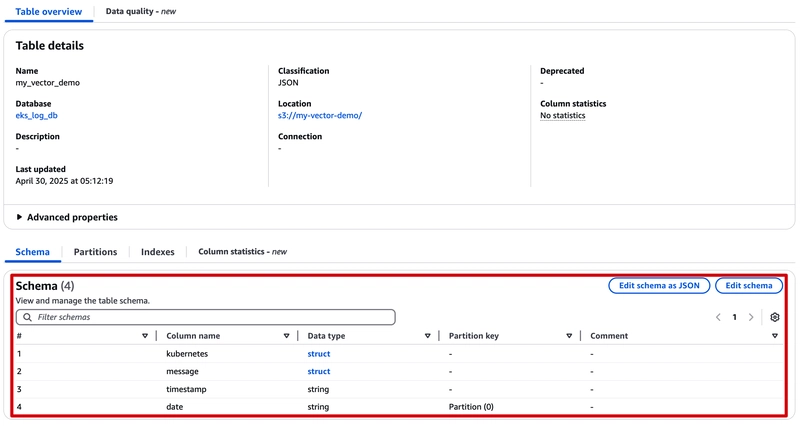
Back to Table overview. You can see table schema has been created automatically.
7. Query log via Amazon Athena
Let's move to Amazon Athena console to query our application logs.
Copy and paste the below SQL statement to Athena SQL editor then run this query:
SELECT timestamp,
    kubernetes.container_image,
    kubernetes.container_name,
    kubernetes.pod_name,
    kubernetes.pod_namespace,
    message.host,
    message.method,
    message.protocol,
    message.referer,
    message.request,
    message.status,
    message.user_identifier,
    date
FROM "AwsDataCatalog"."eks_log_db"."my_vector_demo"
ORDER BY timestamp DESC
LIMIT 500;
When the query is completed, the 500 logs are sorted by timestamp in descending order and every JSON Key/Value also maps to an independent column:
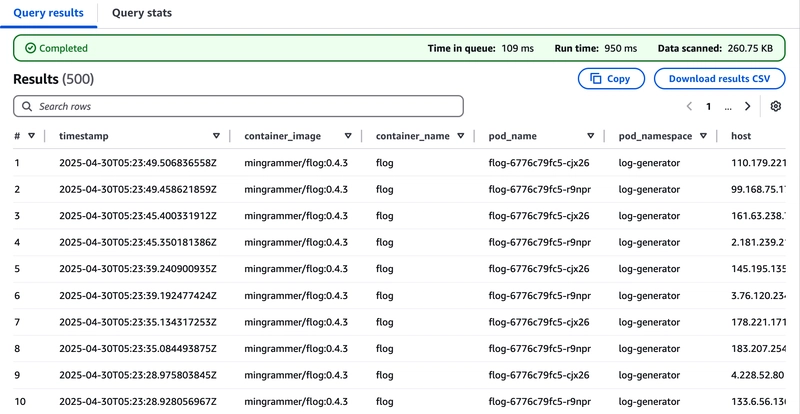
You can further set some conditions to find the logs you want, such as the host's IP address or the request's URI.
8. Cleanup
Use eksctl to delete all of the EKS cluster stack:
eksctl delete cluster --name my-vector-cluster --region ap-northeast-1 --disable-nodegroup-eviction
9. Conclusion
In this demonstration, we showed how to:
Use Vector, an open-source tool, to collect Application Logs on Amazon Elastic Kubernetes Service (Amazon EKS).
Store the Application Logs using Amazon Simple Storage Service (Amazon S3) to meet long-term retention requirements.
Finally, analyze the Application Logs through the powerful search capabilities brought by the integration of AWS Glue and Amazon Athena.
If you are looking for a solution to collect Application Logs on Kubernetes, you might consider using Vector.