


![[The AI Show Episode 145]: OpenAI Releases o3 and o4-mini, AI Is Causing “Quiet Layoffs,” Executive Order on Youth AI Education & GPT-4o’s Controversial Update](https://www.marketingaiinstitute.com/hubfs/ep%20145%20cover.png)


.png?width=1920&height=1920&fit=bounds&quality=70&format=jpg&auto=webp#)


_Vladimir_Stanisic_Alamy.jpg?width=1280&auto=webp&quality=80&disable=upscale#)


![Standalone Meta AI App Released for iPhone [Download]](https://www.iclarified.com/images/news/97157/97157/97157-640.jpg)

![AirPods Pro 2 With USB-C Back On Sale for Just $169! [Deal]](https://www.iclarified.com/images/news/96315/96315/96315-640.jpg)
![Apple Releases iOS 18.5 Beta 4 and iPadOS 18.5 Beta 4 [Download]](https://www.iclarified.com/images/news/97145/97145/97145-640.jpg)


![Did T-Mobile just upgrade your plan again? Not exactly, despite confusing email [UPDATED]](https://m-cdn.phonearena.com/images/article/169902-two/Did-T-Mobile-just-upgrade-your-plan-again-Not-exactly-despite-confusing-email-UPDATED.jpg?#)


Outlier detection and handling in R
An outlier is a data point that significantly differs from other observations in a dataset. It can be: - Unusually high or low compared to the rest of the data. - Anomalous due to measurement errors, data entry mistakes, or rare events. - A true extreme value that represents natural variation. Example of data set name of the loaded data is Data How to identify outliers basic summary function summary(Data) output Visual methods (using Box plot) Plot age on a box plot boxplot(Data$Age, main = "Age",col = "skyblue") output Plot Net_worth on a box plot boxplot(Data$Net_worth, main ="Networth in *10000 PLN",col = "orange") output Using interquatile range Identify the outlier on age values Q1

An outlier is a data point that significantly differs from other observations in a dataset. It can be:
- - Unusually high or low compared to the rest of the data.
- - Anomalous due to measurement errors, data entry mistakes, or rare events.
- - A true extreme value that represents natural variation.
Example of data set
name of the loaded data is Data
How to identify outliers
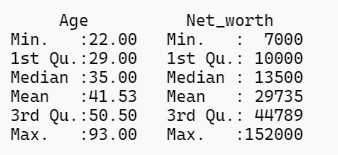
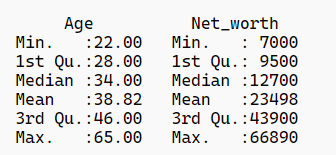
- basic summary function
summary(Data)
output
- Visual methods (using Box plot)
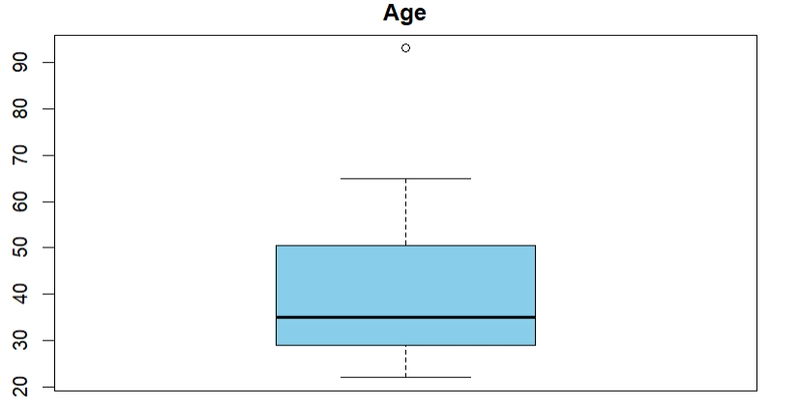
Plot age on a box plot
boxplot(Data$Age, main = "Age",col = "skyblue")
output
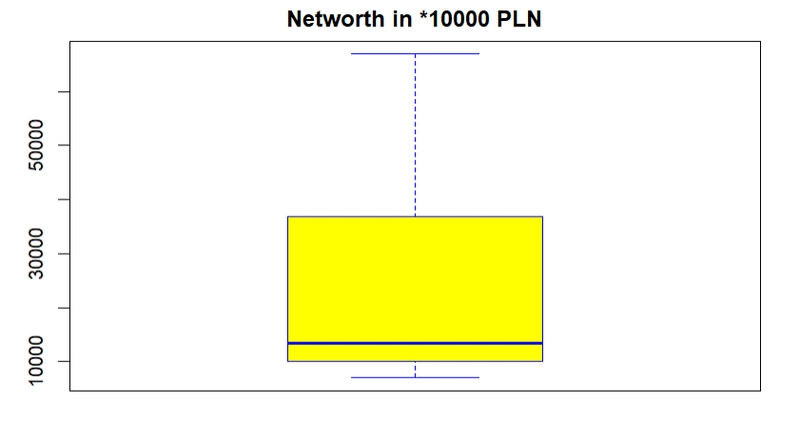
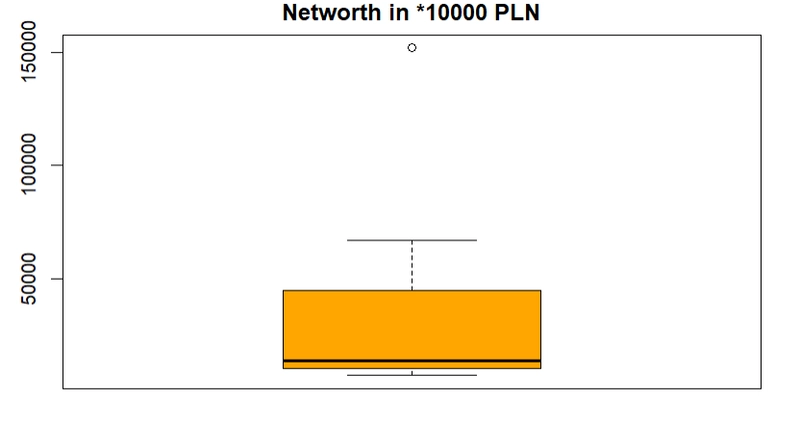
Plot Net_worth on a box plot
boxplot(Data$Net_worth, main ="Networth in *10000 PLN",col = "orange")
output
- Using interquatile range
Identify the outlier on age values
Q1 <- quantile(Data$Age, 0.25)
Q3 <- quantile(Data$Age, 0.75)
IQR <- Q3 - Q1
lower_bound_age <- Q1 - 1.5 * IQR
upper_bound_age <- Q3 + 1.5 * IQR
outlier_age <- Data$Age[Data$Age < lower_bound_age | Data$Age > upper_bound_age]
print(outlier_age)
output
93
Identify the outlier on Net_worth values
Q1 <- quantile(Data$Net_worth, 0.25)
Q3 <- quantile(Data$Net_worth, 0.75)
IQR <- Q3 - Q1
lower_bound_Net_worth <- Q1 - 1.5 * IQR
upper_bound_Net_worth <- Q3 + 1.5 * IQR
outlier_networth <- Data$Net_worth[Data$Net_worth < lower_bound_Net_worth | Data$Net_worth > upper_bound_Net_worth]
print(outlier_networth)
output
152000
SOLVING THE OUTLIER
- Droping the outliers using the interquartile range
new_data <- Data[
  Data$Net_worth >= lower_bound_Net_worth & Data$Net_worth <= upper_bound_Net_worth &
  Data$Age >= lower_bound_age & Data$Age <= upper_bound_age,
]

summary(new_data)
output
- Substituting the outliers with column mean
identify the row index for outliers
# check the data row
which(Data$Net_worth== 152000 )
which(Data$Age== 93)
output
12, 10Replace the outliers with the means
#Replace the data points with the mean
Data$Net_worth[12] <- mean(Data$Net_worth)
Data$Age[10] <- mean(Data$Age)
summary(Data)
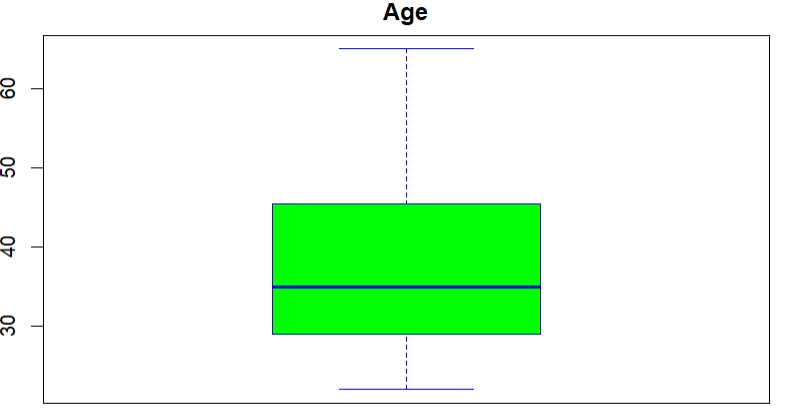
plot the new data columns on a box plot
boxplot(Data$Age,
        main = "Age",
        col = "green",
        border = "blue")
Output
boxplot(Data$Net_worth,
        main = "Networth in *10000 PLN",
        col = "yellow",
        border = "blue")
output