


![[The AI Show Episode 145]: OpenAI Releases o3 and o4-mini, AI Is Causing “Quiet Layoffs,” Executive Order on Youth AI Education & GPT-4o’s Controversial Update](https://www.marketingaiinstitute.com/hubfs/ep%20145%20cover.png)


![From Art School Drop-out to Microsoft Engineer with Shashi Lo [Podcast #170]](https://cdn.hashnode.com/res/hashnode/image/upload/v1746203291209/439bf16b-c820-4fe8-b69e-94d80533b2df.png?#)


(1).jpg?#)


_Inge_Johnsson-Alamy.jpg?width=1280&auto=webp&quality=80&disable=upscale#)


![Apple to Split iPhone Launches Across Fall and Spring in Major Shakeup [Report]](https://www.iclarified.com/images/news/97211/97211/97211-640.jpg)
![Apple to Move Camera to Top Left, Hide Face ID Under Display in iPhone 18 Pro Redesign [Report]](https://www.iclarified.com/images/news/97212/97212/97212-640.jpg)
![Apple Developing Battery Case for iPhone 17 Air Amid Battery Life Concerns [Report]](https://www.iclarified.com/images/news/97208/97208/97208-640.jpg)
![AirPods 4 On Sale for $99 [Lowest Price Ever]](https://www.iclarified.com/images/news/97206/97206/97206-640.jpg)


![[Updated] Samsung’s 65-inch 4K Smart TV Just Crashed to $299 — That’s Cheaper Than an iPad](https://www.androidheadlines.com/wp-content/uploads/2025/05/samsung-du7200.jpg)


Introduction to OpenTelemetry: A DevOps Beginner's Guide
As a DevOps engineer, understanding how your applications are performing in production is crucial to ensuring their reliability and stability. Whether you’re working with microservices, containers, or cloud-native environments, monitoring and observability play a vital role. This is where OpenTelemetry comes in. In this article, we’ll go over what OpenTelemetry is, why it’s important for your DevOps practices, and introduce some key concepts to help you get started on the path to improved observability. How OpenTelemetry Works OpenTelemetry is a collection of APIs, libraries, agents, and instrumentation tools designed to help you collect, process, and export telemetry data things like traces, metrics, and logs from your applications. Essentially, it offers a standardized way to capture data, providing you with a clear view of your system’s performance and behavior. This data is critical for understanding how your system is functioning, pinpointing issues, and optimizing overall performance. But how does OpenTelemetry gather all this useful information, and how can you use it to improve your system? Let’s break it down step-by-step. 1. Instrumentation: Making Your App Observable: The first step is instrumentation. Basically, you’re wiring your application to be “observed.” This is where you decide how to generate signals (traces, metrics, and logs) from your code. Now, depending on your setup, you can either go with any below; Manually instrument: This means adding SDK calls in your code like creating spans around functions, or timing a DB query. Automatically instrument: OpenTelemetry offers auto-instrumentation for many popular frameworks (like Express for Node.js, Spring Boot for Java, Flask for Python). This way, telemetry is collected without you writing much extra code. Once your application is instrumented, you’ll have the data needed to analyze performance, identify issues, and understand system behavior in real time. 2. Signal Generation: Traces, Metrics, and Logs Now your application is instrumented, it starts generating signals: Traces track the path of a request as it moves through your system. They’re made up of spans, which capture operations like HTTP calls, database queries, or interactions with external services. Useful for pinpointing bottlenecks or latency issues. Metrics are numerical values you can aggregate, graph, and alert on, like request rates, response times, CPU and memory usage, error counts, etc. Ideal for monitoring trends and setting SLOs. Logs are timestamped text entries that capture specific events or states. They’re often used for debugging or to provide extra context alongside traces and metrics. These signals are structured in a consistent format, usually using the OpenTelemetry Protocol (OTLP), so they can be processed and exported to your observability backend without friction. 3. Context Propagation: Keeping Traces Connected Across Services In a distributed system, especially with microservices, tracking a single request across multiple services can get messy fast. That’s where context propagation comes in. OpenTelemetry handles this by passing trace context things like trace IDs and span IDs along with each request. For HTTP, this happens via headers; for gRPC, it’s in the metadata. Each service picks up that context and attaches it to its own spans. The result: when you view a trace later, you get a complete picture of the request’s path through the system, without any gaps. This is what makes distributed tracing actually usable. 4. The Collector: Centralized Ingestion and Processing When your app starts producing telemetry data, you need a way to handle it. That’s where the OpenTelemetry Collector comes in. Think of it as a central point that: Ingests traces, metrics, and logs from instrumented services Processes the data, things like filtering, redacting, or adding metadata Exports it to your monitoring or observability backend By separating data collection from where the data ends up, the Collector gives you a clean layer of control. You can standardize telemetry pipelines, apply consistent transformations, and avoid tight coupling with any single vendor. 5. Exporting: Routing Telemetry to the Right Tools After the Collector processes your telemetry, it sends it off to the systems you use to monitor and troubleshoot. Metrics → Prometheus, Cloud Monitoring, etc. Traces → Jaeger, Zipkin, or other tracing backends Logs → Log aggregation tools or cloud logging platforms The best part? You don’t need to modify your application every time you want to switch or add a new backend. Just update the Collector’s config and you're good to go. What Makes OpenTelemetry Different? So maybe you’re thinking, “Why bother with OpenTelemetry? I already use Prometheus for metrics or Jaeger for tracing isn’t that enough?” Fair question. But here’s the thing: OpenTelemetry isn’
As a DevOps engineer, understanding how your applications are performing in production is crucial to ensuring their reliability and stability. Whether you’re working with microservices, containers, or cloud-native environments, monitoring and observability play a vital role. This is where OpenTelemetry comes in.
In this article, we’ll go over what OpenTelemetry is, why it’s important for your DevOps practices, and introduce some key concepts to help you get started on the path to improved observability.
How OpenTelemetry Works
OpenTelemetry is a collection of APIs, libraries, agents, and instrumentation tools designed to help you collect, process, and export telemetry data things like traces, metrics, and logs from your applications. Essentially, it offers a standardized way to capture data, providing you with a clear view of your system’s performance and behavior.
This data is critical for understanding how your system is functioning, pinpointing issues, and optimizing overall performance. But how does OpenTelemetry gather all this useful information, and how can you use it to improve your system? Let’s break it down step-by-step.
1. Instrumentation: Making Your App Observable:
The first step is instrumentation. Basically, you’re wiring your application to be “observed.” This is where you decide how to generate signals (traces, metrics, and logs) from your code.
Now, depending on your setup, you can either go with any below;
- Manually instrument: This means adding SDK calls in your code like creating spans around functions, or timing a DB query.
- Automatically instrument: OpenTelemetry offers auto-instrumentation for many popular frameworks (like Express for Node.js, Spring Boot for Java, Flask for Python). This way, telemetry is collected without you writing much extra code.
Once your application is instrumented, you’ll have the data needed to analyze performance, identify issues, and understand system behavior in real time.
2. Signal Generation: Traces, Metrics, and Logs
Now your application is instrumented, it starts generating signals:
- Traces track the path of a request as it moves through your system. They’re made up of spans, which capture operations like HTTP calls, database queries, or interactions with external services. Useful for pinpointing bottlenecks or latency issues.
- Metrics are numerical values you can aggregate, graph, and alert on, like request rates, response times, CPU and memory usage, error counts, etc. Ideal for monitoring trends and setting SLOs.
- Logs are timestamped text entries that capture specific events or states. They’re often used for debugging or to provide extra context alongside traces and metrics.
These signals are structured in a consistent format, usually using the OpenTelemetry Protocol (OTLP), so they can be processed and exported to your observability backend without friction.
3. Context Propagation: Keeping Traces Connected Across Services
In a distributed system, especially with microservices, tracking a single request across multiple services can get messy fast. That’s where context propagation comes in.
OpenTelemetry handles this by passing trace context things like trace IDs and span IDs along with each request. For HTTP, this happens via headers; for gRPC, it’s in the metadata. Each service picks up that context and attaches it to its own spans.
The result: when you view a trace later, you get a complete picture of the request’s path through the system, without any gaps. This is what makes distributed tracing actually usable.
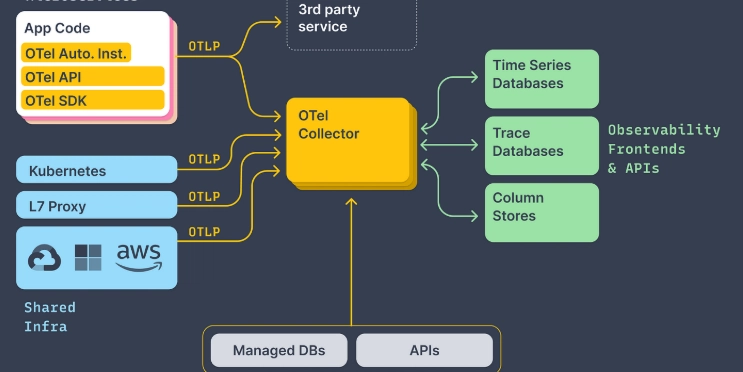
4. The Collector: Centralized Ingestion and Processing
When your app starts producing telemetry data, you need a way to handle it. That’s where the OpenTelemetry Collector comes in.
Think of it as a central point that:
- Ingests traces, metrics, and logs from instrumented services
- Processes the data, things like filtering, redacting, or adding metadata
- Exports it to your monitoring or observability backend
By separating data collection from where the data ends up, the Collector gives you a clean layer of control. You can standardize telemetry pipelines, apply consistent transformations, and avoid tight coupling with any single vendor.
5. Exporting: Routing Telemetry to the Right Tools
After the Collector processes your telemetry, it sends it off to the systems you use to monitor and troubleshoot.
- Metrics → Prometheus, Cloud Monitoring, etc.
- Traces → Jaeger, Zipkin, or other tracing backends
- Logs → Log aggregation tools or cloud logging platforms
The best part? You don’t need to modify your application every time you want to switch or add a new backend. Just update the Collector’s config and you're good to go.
What Makes OpenTelemetry Different?
So maybe you’re thinking, “Why bother with OpenTelemetry? I already use Prometheus for metrics or Jaeger for tracing isn’t that enough?”
Fair question. But here’s the thing: OpenTelemetry isn’t here to replace those tools it’s here to bring them together.
- Unified Telemetry Framework: Instead of juggling separate tooling for traces, metrics, and logs, OpenTelemetry gives you a single, consistent way to collect all three. Same concepts, same configuration patterns, less cognitive load for your team.
- Vendor-Neutral by Design:
OpenTelemetry is vendor-neutral by design. You can pipe your data to Prometheus today, switch to Datadog next week, or go full open-source with Jaeger and Loki and your application code stays exactly the same. No proprietary agents. No rewriting instrumentation. You own the pipeline, not the vendor.
- Pluggable and Extensible Pipeline:
The Collector acts as a configurable processing layer. Need to drop certain spans, mask sensitive fields, or add metadata before sending data out? Just plug in the processors you need no custom tooling required.
- Community-Driven and CNCF-Backed
OpenTelemetry isn’t a startup’s side project. It’s part of the Cloud Native Computing Foundation (same folks behind Kubernetes), and it’s backed by a huge community of engineers and observability vendors. That means fast updates, strong documentation, and wide adoption.
In summary OpenTelemetry doesn’t replace Prometheus or Jaeger, it complements and unifies them. It gives you a consistent, flexible foundation for observability, no matter what your stack looks like.
Thanks for reading. Let me know in the comments if there’s a topic you’d like me to cover next. I know it’s been a while since I last posted. I’m still working on those practical, hands-on articles I promised, so keep an eye out. They’re on the way.