


![[The AI Show Episode 144]: ChatGPT’s New Memory, Shopify CEO’s Leaked “AI First” Memo, Google Cloud Next Releases, o3 and o4-mini Coming Soon & Llama 4’s Rocky Launch](https://www.marketingaiinstitute.com/hubfs/ep%20144%20cover.png)


![yaps[dot]chat - one-time end-to-end encrypted anonymous chats. now Open-Source!!](https://media2.dev.to/dynamic/image/width%3D1000,height%3D500,fit%3Dcover,gravity%3Dauto,format%3Dauto/https:%2F%2Fdev-to-uploads.s3.amazonaws.com%2Fuploads%2Farticles%2F1m7ads99lbphtyw35iah.png)


_Olekcii_Mach_Alamy.jpg?width=1280&auto=webp&quality=80&disable=upscale#)


![M4 MacBook Air Drops to New All-Time Low of $912 [Deal]](https://www.iclarified.com/images/news/97108/97108/97108-640.jpg)
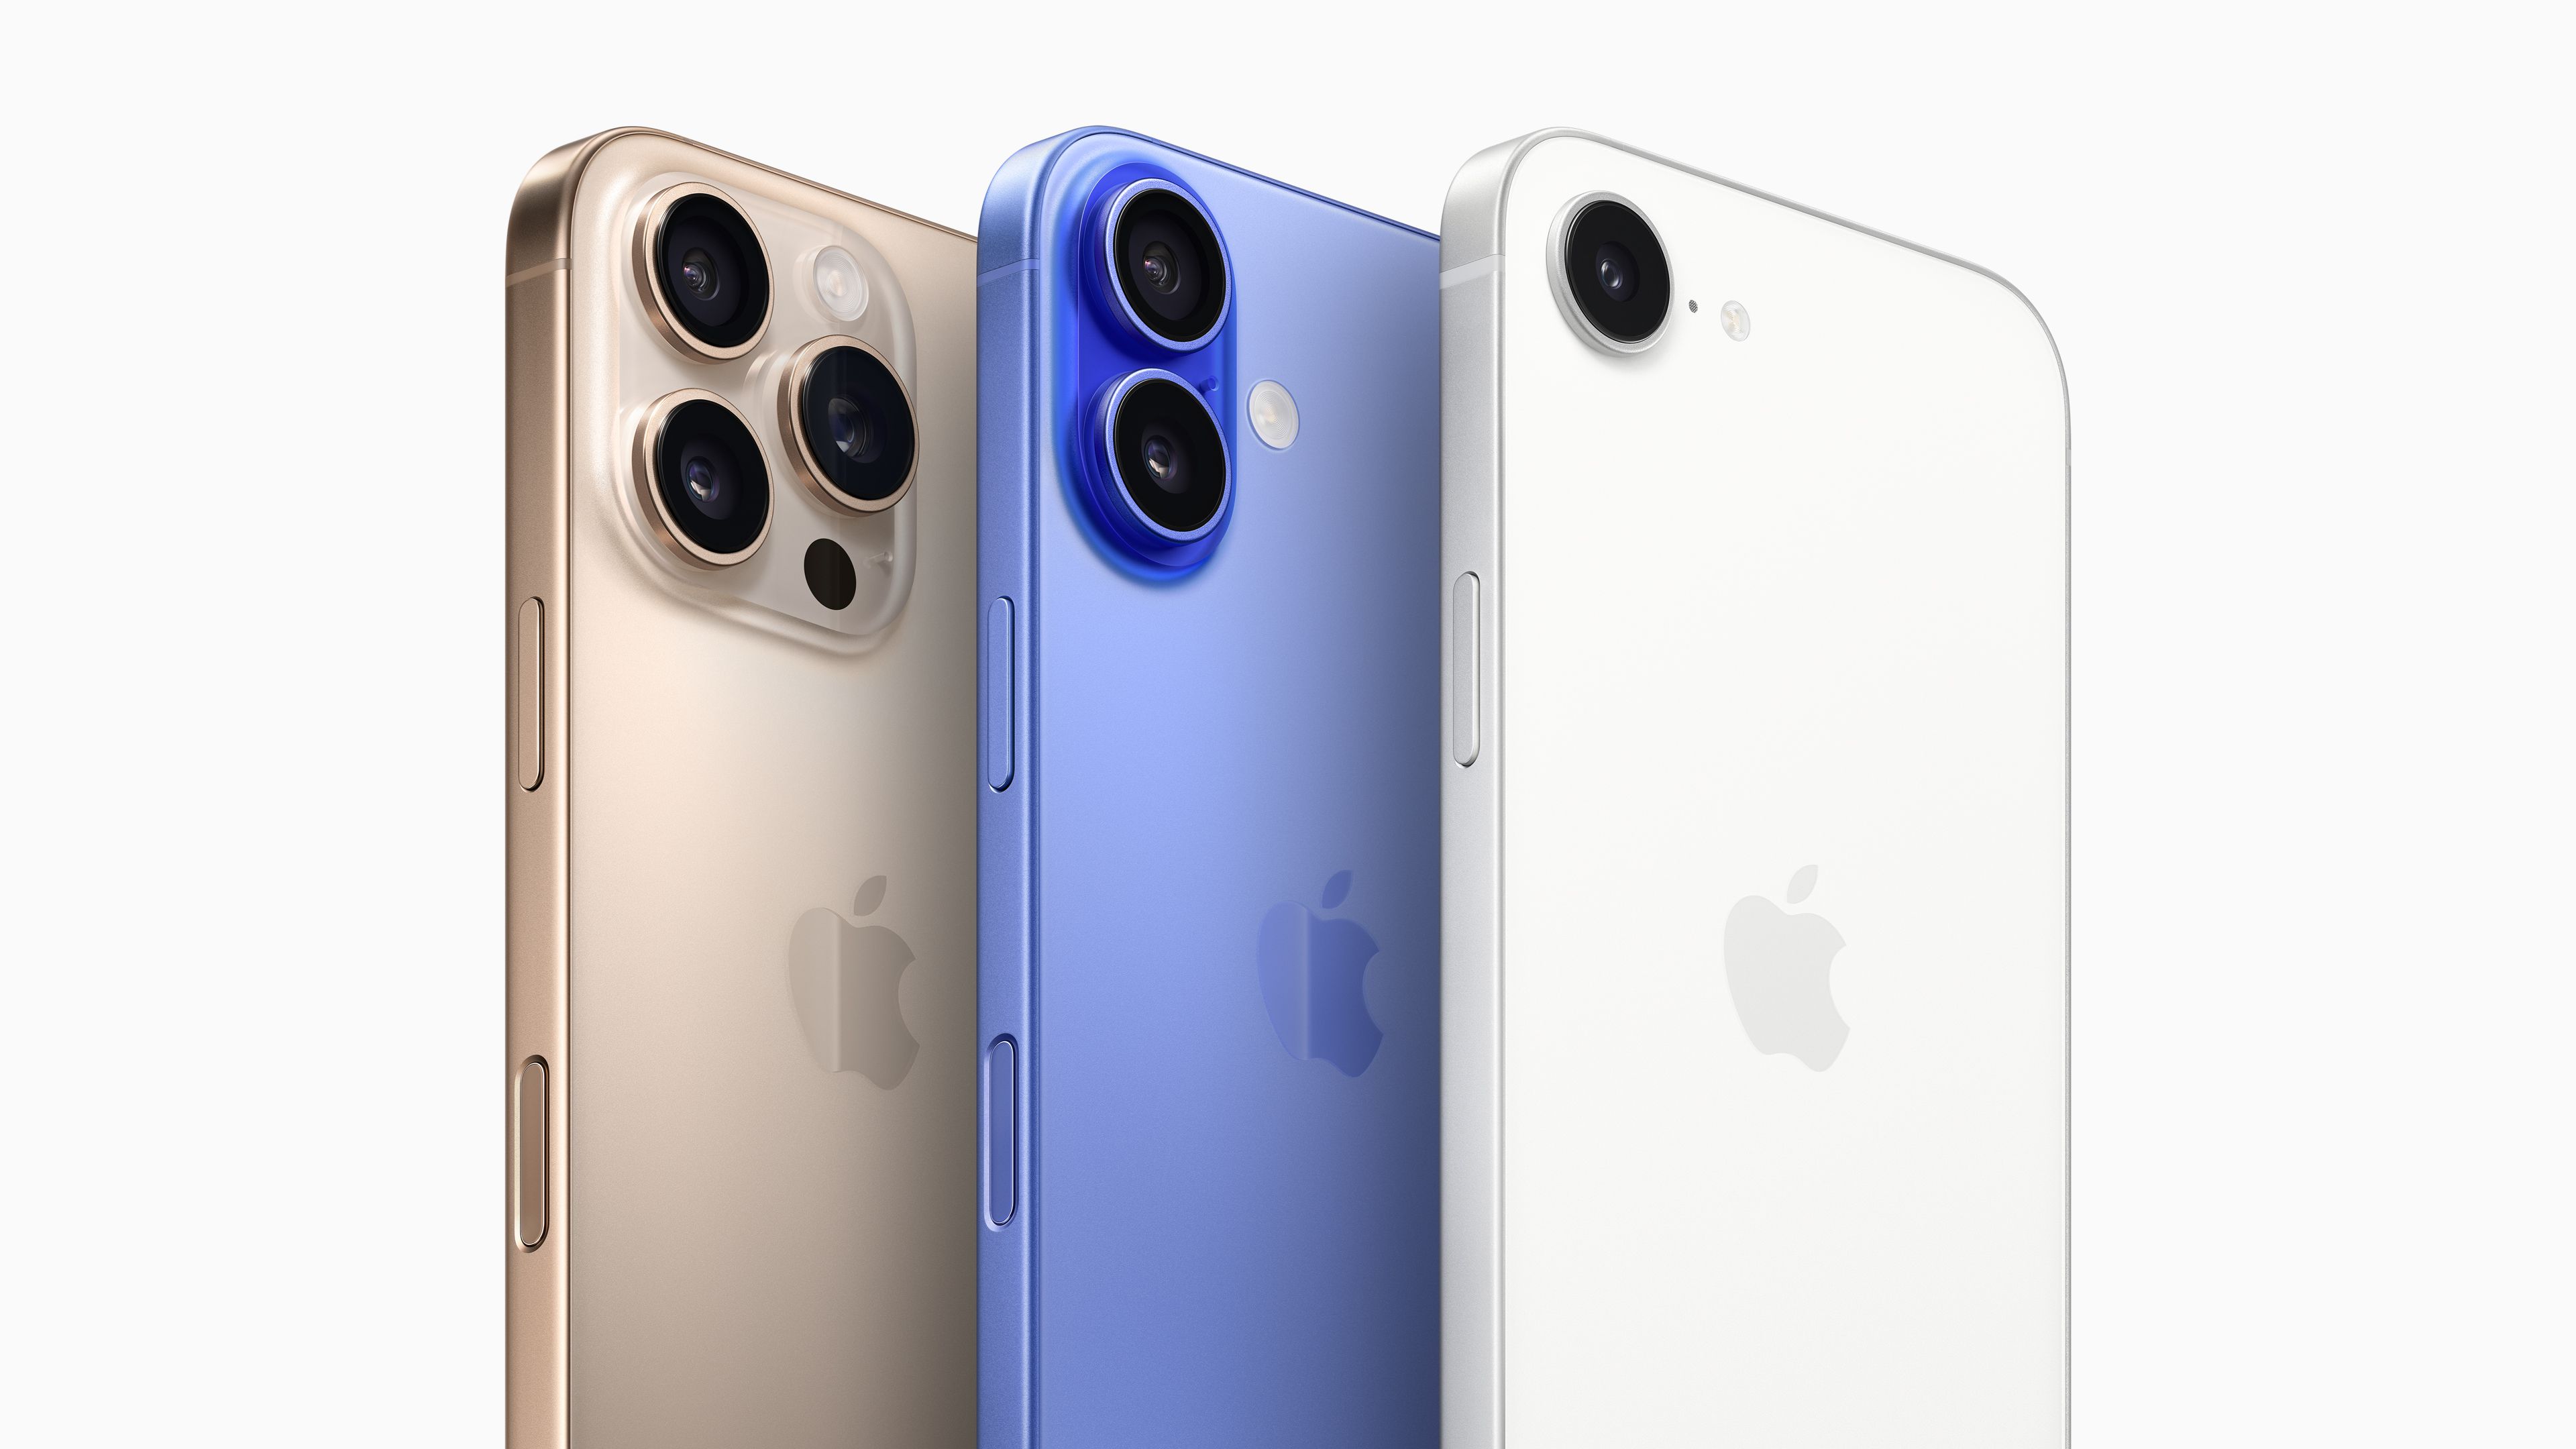
![New iPhone 17 Dummy Models Surface in Black and White [Images]](https://www.iclarified.com/images/news/97106/97106/97106-640.jpg)


Tuning OutOfMemoryError: Metaspace Size Problems
When it comes to tuning and troubleshooting memory issues in Java, many people think only of the Java heap. However, the metaspace is also an important consideration. Metaspace memory is managed separately from the heap. Issues in this area can lead to performance problems and even system crashes, such as java.lang.outofmemoryerror: metaspace. What is the metaspace? How do we troubleshoot and tune it? In this article, we’ll answer those questions. What is the Metaspace? First let’s review the JVM memory model. The diagram below shows the various memory pools. Some of these are managed by the JVM, whereas others are stored in native memory managed by the operating system. Fig: JVM Memory Model Highlighting Metaspace The metaspace is highlighted in red. It was introduced in Java 8 to replace the JVM-managed permanent generation (permgen) space. The metaspace is held in native memory allocated by the operating system as needed. It’s held as a collection of metaspace chunks, which are contiguous sections of memory. The metaspace stores class definitions, including: Name; Byte code for each method; Constants. It may also hold other information, such as string pools. Causes of the Error: java.lang.outofmemoryerror: metaspace If the metaspace exceeds its size limit, the application will crash with the error: java.lang.outofmemoryerror: metaspace. This is likely to be caused by either too many classes being created, or, in rare cases, by using too many class loaders. Why is an application likely to have too many classes? The reasons include: Dynamic class loading, typically when using either Java Reflection or Groovy Scripting; Extensive use of large 3rd-party libraries; Memory leaks, which happen either because classes are not dereferenced when no longer in use, or because a method that creates classes is repeated without a valid termination condition. Troubleshooting java.lang.outofmemoryerror: metaspace There are many ways of troubleshooting and monitoring metaspace usage. This article, How to Inspect the Contents of the Java Metaspace Region, covers several tools that provide useful information. From JDK 11 onwards, the following JDK command is a quick way to summarize metaspace usage: jcmd VM.metaspace It gives details of class usage, non-class usage and totals. For a worked example, including a sample program and a step-by-step guide to troubleshooting with the HeapHero tool, read: Java Out of Memory: Metaspace. Tuning the Metaspace When we experience the error: java.lang.outofmemoryerror: metaspace, the first step is to ensure there are no memory leaks. As shown in the article linked above, HeapHero is an excellent tool for identifying application errors that affect memory. If the program is running as it should, the next step is to make the metaspace bigger. The following JVM switches can be used to adjust the size: -XX:MetaspaceSize=: Sets the initial size of the metaspace; -XX:MaxMetaspaceSize: Sets the maximum size to which the metaspace is allowed to grow. The metaspace is cleaned by the JVM’s garbage collector, but only during full GC events. When using dynamic classes, it may not be cleared quickly enough to avoid Out of Memory errors. We can tune the garbage collection by setting the maximum and minimum fill percentages at which GC is triggered: -XX:MaxMetaspaceFreeRatio= -XX:MinMetaspaceFreeRatio= A good tool for analyzing the efficiency of the garbage collector is GCeasy. Conclusion The metaspace is often left out of account when tuning and troubleshooting Java applications. This can lead to performance issues and errors such as java.lang.outofmemoryerror: metaspace. In this article, we’ve looked at what the metaspace is used for and how it’s managed. We’ve seen some of the causes of memory problems in the metaspace, and learned how to tune its size and garbage collection policy. I hope you find this article useful. If you have any comments, suggestions or additional information, your input will be most welcome.
When it comes to tuning and troubleshooting memory issues in Java, many people think only of the Java heap. However, the metaspace is also an important consideration. Metaspace memory is managed separately from the heap. Issues in this area can lead to performance problems and even system crashes, such as java.lang.outofmemoryerror: metaspace.
What is the metaspace? How do we troubleshoot and tune it? In this article, we’ll answer those questions.
What is the Metaspace?
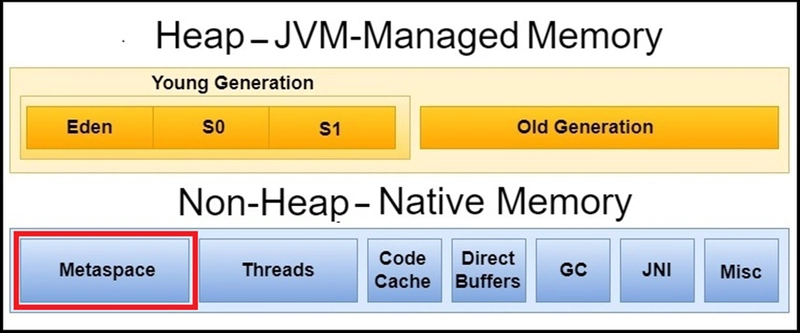
First let’s review the JVM memory model. The diagram below shows the various memory pools. Some of these are managed by the JVM, whereas others are stored in native memory managed by the operating system.
Fig: JVM Memory Model Highlighting Metaspace
The metaspace is highlighted in red. It was introduced in Java 8 to replace the JVM-managed permanent generation (permgen) space. The metaspace is held in native memory allocated by the operating system as needed. It’s held as a collection of metaspace chunks, which are contiguous sections of memory.
The metaspace stores class definitions, including:
Name;
Byte code for each method;
Constants.
It may also hold other information, such as string pools.
Causes of the Error: java.lang.outofmemoryerror: metaspace
If the metaspace exceeds its size limit, the application will crash with the error: java.lang.outofmemoryerror: metaspace. This is likely to be caused by either too many classes being created, or, in rare cases, by using too many class loaders.
Why is an application likely to have too many classes? The reasons include:
Dynamic class loading, typically when using either Java Reflection or Groovy Scripting;
Extensive use of large 3rd-party libraries;
Memory leaks, which happen either because classes are not dereferenced when no longer in use, or because a method that creates classes is repeated without a valid termination condition.
Troubleshooting java.lang.outofmemoryerror: metaspace
There are many ways of troubleshooting and monitoring metaspace usage. This article, How to Inspect the Contents of the Java Metaspace Region, covers several tools that provide useful information.
From JDK 11 onwards, the following JDK command is a quick way to summarize metaspace usage:
jcmd VM.metaspace
It gives details of class usage, non-class usage and totals.
For a worked example, including a sample program and a step-by-step guide to troubleshooting with the HeapHero tool, read: Java Out of Memory: Metaspace.
Tuning the Metaspace
When we experience the error: java.lang.outofmemoryerror: metaspace, the first step is to ensure there are no memory leaks. As shown in the article linked above, HeapHero is an excellent tool for identifying application errors that affect memory.
If the program is running as it should, the next step is to make the metaspace bigger.
The following JVM switches can be used to adjust the size:
-
XX:MetaspaceSize=: Sets the initial size of the metaspace;-XX:MaxMetaspaceSize: Sets the maximum size to which the metaspace is allowed to grow.
The metaspace is cleaned by the JVM’s garbage collector, but only during full GC events. When using dynamic classes, it may not be cleared quickly enough to avoid Out of Memory errors. We can tune the garbage collection by setting the maximum and minimum fill percentages at which GC is triggered:
-XX:MaxMetaspaceFreeRatio=-XX:MinMetaspaceFreeRatio=
A good tool for analyzing the efficiency of the garbage collector is GCeasy.
Conclusion
The metaspace is often left out of account when tuning and troubleshooting Java applications. This can lead to performance issues and errors such as java.lang.outofmemoryerror: metaspace.
In this article, we’ve looked at what the metaspace is used for and how it’s managed. We’ve seen some of the causes of memory problems in the metaspace, and learned how to tune its size and garbage collection policy.
I hope you find this article useful. If you have any comments, suggestions or additional information, your input will be most welcome.