


![[The AI Show Episode 143]: ChatGPT Revenue Surge, New AGI Timelines, Amazon’s AI Agent, Claude for Education, Model Context Protocol & LLMs Pass the Turing Test](https://www.marketingaiinstitute.com/hubfs/ep%20143%20cover.png)


.jpg?#)


_Muhammad_R._Fakhrurrozi_Alamy.jpg?width=1280&auto=webp&quality=80&disable=upscale#)
_NicoElNino_Alamy.jpg?width=1280&auto=webp&quality=80&disable=upscale#)


![New iPad 11 (A16) On Sale for Just $299! [Lowest Price Ever]](https://www.iclarified.com/images/news/97144/97144/97144-640.jpg)

![M4 MacBook Air Drops to Just $849 - Act Fast! [Lowest Price Ever]](https://www.iclarified.com/images/news/97140/97140/97140-640.jpg)
![Apple Smart Glasses Not Close to Being Ready as Meta Targets 2025 [Gurman]](https://www.iclarified.com/images/news/97139/97139/97139-640.jpg)


Top 10 Web Application Monitoring Tools in 2025
Web applications play a vital role in modern business as they deliver services, manage internal systems, or support customer experiences. As your application development scales, keeping tabs on performance, security, and uptime becomes mission-critical. That’s where web app monitoring tools come in. These platforms offer robust monitoring capabilities that help ensure smooth functionality, reliable performance, and strong security, day and night. Whether you’re looking for a simple uptime checker or an all-in-one monitoring solution, the right tool can help you stay ahead of issues before they impact your users. By the way, make sure you check out our guide to web application monitoring best practices to get your monitoring system set up for success. List of Solutions to Monitoring Web Applications Before we dive into the best web app monitoring tools, it’s worth highlighting StatusGator, a solution that can significantly enhance your monitoring system. StatusGator tracks the status of your web applications, websites, and the third-party SaaS platforms they depend on. It monitors over 5,000 services and delivers real-time updates on uptime, downtime, maintenance, and incidents. With StatusGator, you can aggregate the statuses of all your web apps and services into a single, unified status page. It’s perfect for keeping internal teams and external users informed at a glance. You can filter updates by specific components or regions, ensuring that the information you receive is highly relevant. Plus, StatusGator’s Early Warning Signals feature alerts you to potential outages even before official status pages confirm the issue. No matter which web apps power your operations, StatusGator’s monitoring capabilities help you stay ahead of disruptions and maintain a smooth user experience. Now, we can proceed with the list of selected application monitoring software. 1. New Relic New Relic is a comprehensive observability platform that collects and analyzes data from web apps, mobile apps, infrastructure, and networks, helping engineers and data scientists monitor performance and detect issues early. Why choose New Relic? Its Errors Inbox feature is a powerful full-stack error management tool. It groups similar errors by severity, reducing notification noise and ensuring that critical issues are prioritized. New Relic offers the ability to route specific error alerts to the appropriate teams in Slack, improving response times. Key features and integrations New Relic is an ideal all-in-one monitoring solution for error tracking, offering pre-production workload monitoring that flags potential issues before deployment. Error data is retained even after resolution, giving teams the ability to review attachments, comments, and contextual details to better understand past incidents. Pre-built integrations are available for VMware vSphere, Kafka, Apache Cassandra, Amazon ECS, Oracle Database, and NGINX. Pros: ✔️ Retains detailed error data for future review ✔️ Customizable, team-specific notifications ✔️ Smart error grouping to minimize alert fatigue Cons: ❌ Pricing can become high at scale ❌ Feature-rich platform may overwhelm beginners 2. Site24x7 Site24x7 offers an all-in-one monitoring solution for applications, websites, servers, networks, public and private clouds, and synthetic transactions. This includes application performance monitoring (APM), an AI-powered tool that analyses critical performance metrics in real-time. Why choose Site24x7? Site24x7 complies with SOC 2 and ISO 27001 standards, making it a trusted choice for industries like education, where data security is critical. Key features and integrations Site24x7's elastic infrastructure allows it to automatically scale resources based on demand. It’s good for fluctuating traffic patterns. It also connects seamlessly with popular communication and service management tools, including Slack, Microsoft Teams, ServiceNow, Freshdesk, Jira, GitHub, and others. This broad integration support makes it easy to collect feedback, manage incidents, and keep both users and IT teams informed. Pros: ✔️ Unified monitoring across web apps, servers, networks, and clouds ✔️ Pre-built integrations with top communication and ITSM platforms ✔️ Meets industry standards for security and compliance Cons: ❌ Crowded interface can feel overwhelming ❌ Lacks automatic grouping of notifications, which may lead to alert fatigue 3. Datadog Datadog is an all-in-one monitoring and security platform that provides visibility across applications, infrastructure, networks, containers, and logs. So it’s a powerful tool for end-to-end observability. Why choose Datadog? Datadog unifies app, network, and infrastructure monitoring into a single, intuitive dashboard. Its collaboration features are valuable for aligning developers and business teams around shared insights.
Web applications play a vital role in modern business as they deliver services, manage internal systems, or support customer experiences. As your application development scales, keeping tabs on performance, security, and uptime becomes mission-critical.
That’s where web app monitoring tools come in. These platforms offer robust monitoring capabilities that help ensure smooth functionality, reliable performance, and strong security, day and night.
Whether you’re looking for a simple uptime checker or an all-in-one monitoring solution, the right tool can help you stay ahead of issues before they impact your users.
By the way, make sure you check out our guide to web application monitoring best practices to get your monitoring system set up for success.
List of Solutions to Monitoring Web Applications
Before we dive into the best web app monitoring tools, it’s worth highlighting StatusGator, a solution that can significantly enhance your monitoring system.
StatusGator tracks the status of your web applications, websites, and the third-party SaaS platforms they depend on. It monitors over 5,000 services and delivers real-time updates on uptime, downtime, maintenance, and incidents.
With StatusGator, you can aggregate the statuses of all your web apps and services into a single, unified status page. It’s perfect for keeping internal teams and external users informed at a glance.
You can filter updates by specific components or regions, ensuring that the information you receive is highly relevant. Plus, StatusGator’s Early Warning Signals feature alerts you to potential outages even before official status pages confirm the issue.
No matter which web apps power your operations, StatusGator’s monitoring capabilities help you stay ahead of disruptions and maintain a smooth user experience.
Now, we can proceed with the list of selected application monitoring software.
1. New Relic
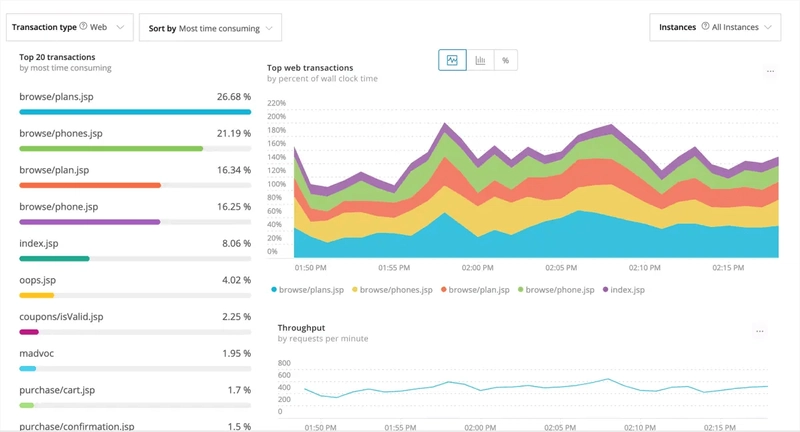
New Relic is a comprehensive observability platform that collects and analyzes data from web apps, mobile apps, infrastructure, and networks, helping engineers and data scientists monitor performance and detect issues early.
Why choose New Relic?
Its Errors Inbox feature is a powerful full-stack error management tool. It groups similar errors by severity, reducing notification noise and ensuring that critical issues are prioritized. New Relic offers the ability to route specific error alerts to the appropriate teams in Slack, improving response times.
Key features and integrations
New Relic is an ideal all-in-one monitoring solution for error tracking, offering pre-production workload monitoring that flags potential issues before deployment.
Error data is retained even after resolution, giving teams the ability to review attachments, comments, and contextual details to better understand past incidents.
Pre-built integrations are available for VMware vSphere, Kafka, Apache Cassandra, Amazon ECS, Oracle Database, and NGINX.
Pros:
✔️ Retains detailed error data for future review
✔️ Customizable, team-specific notifications
✔️ Smart error grouping to minimize alert fatigue
Cons:
❌ Pricing can become high at scale
❌ Feature-rich platform may overwhelm beginners
2. Site24x7
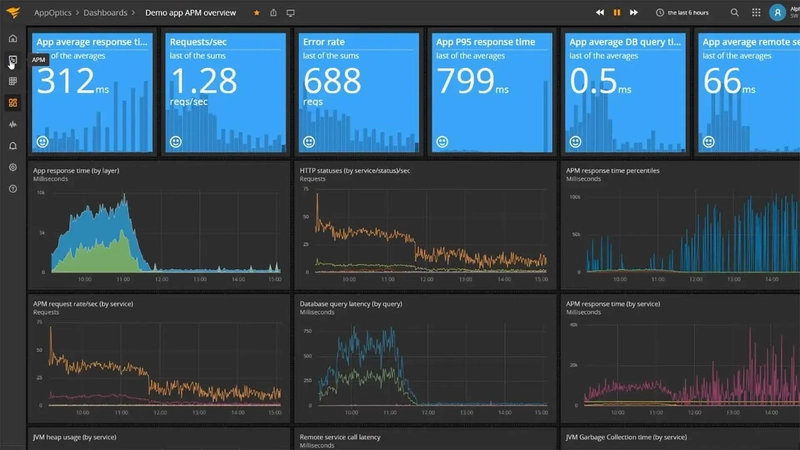
Site24x7 offers an all-in-one monitoring solution for applications, websites, servers, networks, public and private clouds, and synthetic transactions. This includes application performance monitoring (APM), an AI-powered tool that analyses critical performance metrics in real-time.
Why choose Site24x7?
Site24x7 complies with SOC 2 and ISO 27001 standards, making it a trusted choice for industries like education, where data security is critical.
Key features and integrations
Site24x7's elastic infrastructure allows it to automatically scale resources based on demand. It’s good for fluctuating traffic patterns. It also connects seamlessly with popular communication and service management tools, including Slack, Microsoft Teams, ServiceNow, Freshdesk, Jira, GitHub, and others.
This broad integration support makes it easy to collect feedback, manage incidents, and keep both users and IT teams informed.
Pros:
✔️ Unified monitoring across web apps, servers, networks, and clouds
✔️ Pre-built integrations with top communication and ITSM platforms
✔️ Meets industry standards for security and compliance
Cons:
❌ Crowded interface can feel overwhelming
❌ Lacks automatic grouping of notifications, which may lead to alert fatigue
3. Datadog

Datadog is an all-in-one monitoring and security platform that provides visibility across applications, infrastructure, networks, containers, and logs. So it’s a powerful tool for end-to-end observability.
Why choose Datadog?
Datadog unifies app, network, and infrastructure monitoring into a single, intuitive dashboard. Its collaboration features are valuable for aligning developers and business teams around shared insights.
Key features and integrations
Datadog stands out with its advanced logging features, offering audit trails, observability pipelines, and sensitive data scanning. For digital experience management, it supports session recording and replay, error tracking, real user monitoring (RUM), and synthetic monitoring.
Datadog offers pre-built integrations for CircleCI, Travis CI, Azure DevOps, GitHub, Jira, and more.
Pros:
✔️ Strong digital experience monitoring tools
✔️ Deep, flexible log management capabilities
✔️ Unified view across your tech stack
Cons:
❌ Steeper learning curve
❌ Documentation can be limited
4. Sentry
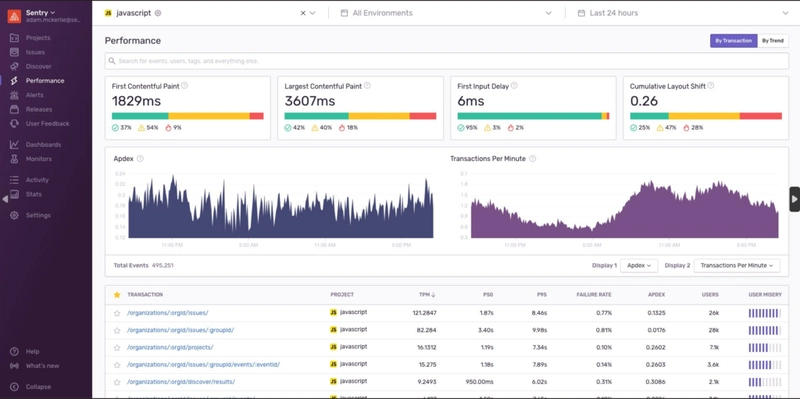
Sentry is an open-source monitoring platform designed to help developers identify, diagnose, and fix issues in real-time across web, mobile, and desktop applications.
Why choose Sentry?
The platform’s focus is on application error monitoring and performance tracking. Sentry’s ability to capture detailed stack traces, contextual data, and user sessions made debugging much faster and more precise.
Key features and integrations
Sentry’s standout features include real-time error tracking, performance monitoring for slow transactions, and release health analytics that help pinpoint problems tied to specific deployments.
Pre-built integrations are available for GitHub, GitLab, Bitbucket, Jira, Slack, Trello, Azure DevOps, AWS Lambda, Vercel, and more.
Pros:
✔️ Real-time, actionable error monitoring
✔️ Strong performance tracing for apps
✔️ Easy integration with developer tools
Cons:
❌ Best suited for error and performance monitoring rather than full infrastructure observability
❌ Advanced features can get pricey for large teams
5. Dynatrace
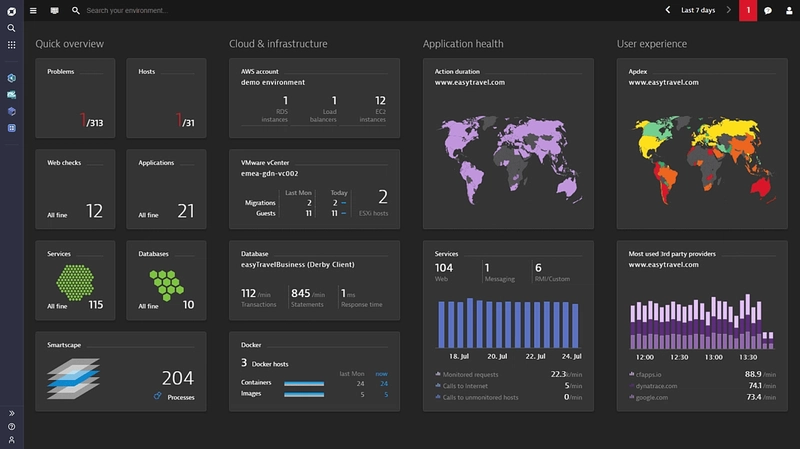
Dynatrace is a unified observability platform offering modules for application security, digital experience monitoring, infrastructure observability, automation, and business insights.
Why choose Dynatrace?
Dynatrace’s standout feature, Grail, collects and analyzes causal data at scale, providing AI-driven insights with full business context. This could be valuable for data-intensive industries like fintech, where rapid, informed decision-making is crucial.
Its ability to define custom parameters for flagging unusual behavior also adds an extra layer of protection against potential threats.
Key features and integrations
Dynatrace offers built-in BI tools that bring business and development teams together essential for aligning product performance with business goals.
Targeted notifications ensure the right teams, such as finance or security, are alerted about specific incidents, like potential fraud, without overwhelming development teams.
It offers native integrations with Jenkins, GitLab, JFrog, Microsoft Teams, Mulesoft, LaunchDarkly, ServiceNow, Jira, Prometheus, and Grafana.
Pros:
✔️ AI-powered insights with contextual analysis
✔️ Targeted, role-specific alerting
✔️ Strong support for BizDevOps collaboration
Cons:
❌ Steep learning curve for new users
❌ Inconsistent customer support experience
6. Uptrends
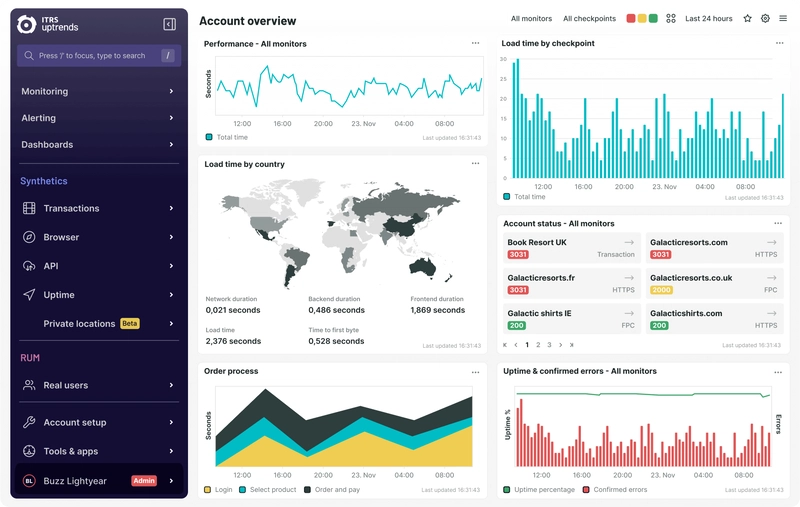
Uptrends is a cloud-based monitoring platform that specializes in website, API, and web application monitoring, with a strong focus on performance, uptime, and user experience.
Why choose Uptrends?
Because of its detailed synthetic monitoring and real browser testing capabilities. Uptrends' ability to simulate user journeys through web apps helps uncover issues before they impact real users.
Key features and integrations
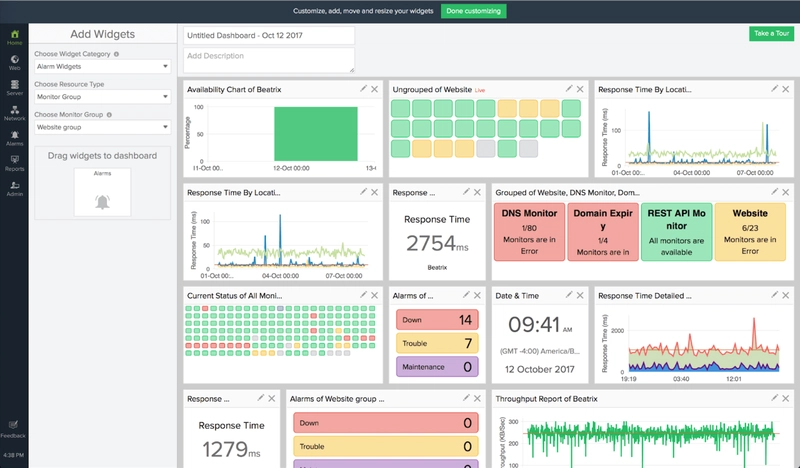
Uptrends stands out for its global network of checkpoints, allowing you to monitor web apps from dozens of locations worldwide.
It offers customizable dashboards, real-time alerting, multi-step transaction monitoring, and comprehensive SLA reporting. Plus, it can monitor both public-facing sites and private (internal) applications.
Integrations are available for Microsoft Teams, Slack, PagerDuty, ServiceNow, Opsgenie, and webhooks for custom workflows.
Pros:
✔️ Global monitoring network
✔️ Strong synthetic transaction testing
✔️ Detailed performance and uptime reporting
Cons:
❌ Limited support for infrastructure monitoring
❌ Some learning curve when setting up complex transaction scripts
7. Dotcom-Monitor
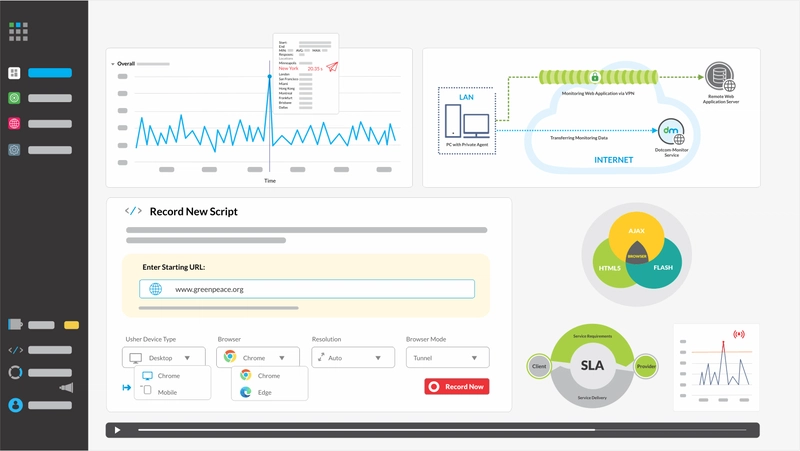
Dotcom-Monitor is a performance and uptime monitoring platform designed to track the availability, speed, and functionality of websites, web applications, APIs, servers, and network services.
Why choose Dotcom-Monitor?
It has a flexible real browser monitoring and multi-step user journey testing. It’s particularly strong at emulating real-world user interactions across different browsers, making it a smart choice for teams focused on optimizing the end-user experience during application development and deployment.
Key features and integrations
Dotcom-Monitor offers an all-in-one monitoring solution that includes web app performance monitoring, full-page load testing, mobile website monitoring, and API monitoring. Its scripting tool allows you to create complex transaction monitors without heavy coding.
The platform’s global network covers more than 30 monitoring locations, helping you catch regional performance issues early.
Pre-built integrations include PagerDuty, Slack, Microsoft Teams, Opsgenie, and webhooks, making it easy to automate alerts and connect with your existing toolset.
Pros:
✔️ Powerful real browser testing
✔️ Easy-to-use scripting for transaction monitoring
✔️ Extensive global testing network
Cons:
❌ Dashboard UI can feel a bit dated
❌ Pricing can get high for large-scale monitoring needs
8. AppDynamics
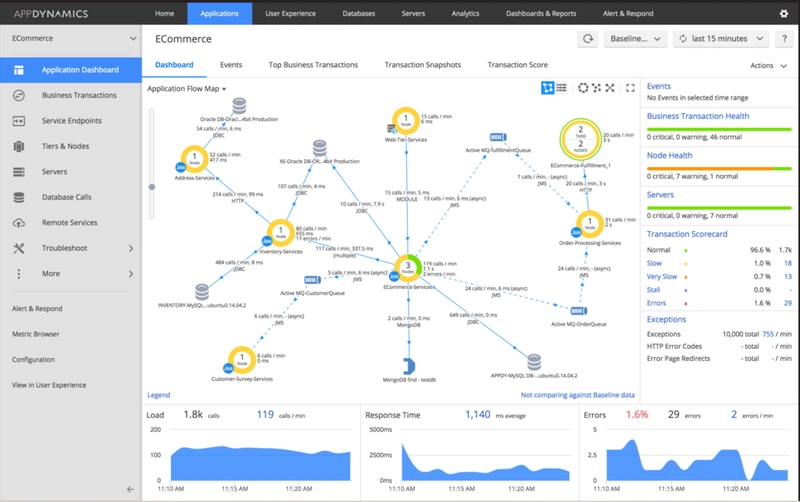
AppDynamics is an enterprise-grade application performance monitoring platform that delivers deep visibility into complex application environments, helping IT teams ensure smooth operations and better user experiences.
Why choose AppDynamics?
AppDynamics offers a unified observability approach. It combines application, infrastructure, and end-user performance monitoring into a single platform. Its application mapping capabilities make it easier to spot dependencies and bottlenecks, while real-time business metrics link performance issues directly to business outcomes, making it a strong fit for organizations seeking an all-in-one monitoring solution.
Key features and integrations
AppDynamics offers end-to-end transaction tracing to monitor the full user journey across your systems.
Dynamic baselining automatically sets performance benchmarks and flags anomalies. The platform also stands out with its business impact analysis, allowing teams to assess how tech issues impact revenue and operations.
AppDynamics integrates with AWS, Microsoft Azure, Google Cloud Platform, Docker, Kubernetes, ServiceNow, PagerDuty, Slack, Jira, and Microsoft Teams.
Pros:
✔️ Clear application dependency mapping
✔️ Real-time correlation between performance and business outcomes
✔️ Broad, unified monitoring capabilities
Cons:
❌ Can be resource-heavy
❌ Initial setup and configuration can be complex
9. Pingdom
Pingdom is a website and web application monitoring tool from SolarWinds, designed to help businesses track uptime, performance, and user experience from a global network of servers.
Why choose Pingdom?
It’s a great choice if you want straightforward, reliable web app monitoring with minimal setup time.
It’s particularly useful for teams that need real-time uptime checks, fast page load insights, and user experience monitoring without the complexity of heavier enterprise solutions.
Key features and integrations
Pingdom offers synthetic monitoring, real user monitoring (RUM), and detailed performance reports. You can simulate user interactions from multiple locations worldwide to catch issues before they impact real users. Its alert system integrates easily with communication tools, helping you stay ahead of downtime or slowdowns.
Pingdom integrates with Slack, Microsoft Teams, PagerDuty, Opsgenie, VictorOps, Webhooks, and many more platforms, ensuring your team is always in the loop.
Pros:
✔️ Easy to set up and use
✔️ Real user and synthetic monitoring
✔️ Reliable uptime and performance alerts
Cons:
❌ Limited support for monitoring complex application environments
❌ Fewer advanced features compared to other enterprise-focused monitoring tools
10. Honeycomb
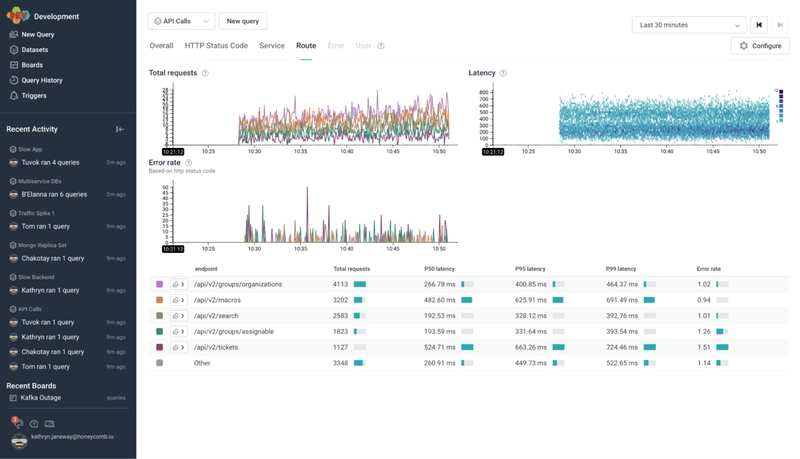
Honeycomb is an event management platform designed to help teams gain deep insights into distributed systems by centralizing data into a single hub.
Why choose Honeycomb?
Honeycomb is well-suited for complex, distributed systems like gaming applications. Its BubbleUp feature analyzes data across various teams (development, design, audio, etc.) to uncover common trends, offering a comprehensive view of user interactions. This makes it ideal for game development, where data from multiple sources can be aggregated to understand player behavior.
Key features and integrations
Honeycomb’s Service Map creates a visual representation of your app's linked services, making it easy to monitor microservices-based applications like games.
This visualization also supports debugging, helping you quickly identify issues. Another key feature is OpenTelemetry, which allows you to instrument your code and generate telemetry data that can be used across any back-end service without vendor lock-in.
Honeycomb integrates with tools like GitHub, LaunchDarkly, CircleCI, Terraform, AWS Lambda, Slack, PagerDuty, Chef, and GitLab, ensuring seamless workflows for development teams.
Pros:
✔️ Excellent for managing microservices and game development workflows
✔️ Strong distributed tracing and visual debugging
✔️ Customizable telemetry data
Cons:
❌ Requires significant setup time
❌ Pricing can be high for small teams
What Are the Key Features to Look for in Monitoring Software?
Alert Mechanisms and Notifications
Effective alerting is crucial for keeping administrators and end users informed about performance issues or unexpected disruptions. Look for monitoring tools that offer flexible notification channels (like SMS and email) and allow you to customize alerts based on specific thresholds or incidents.
Monitoring Web Transactions and Metrics
To ensure a seamless user experience, choose tools that provide deep insights into transaction metrics. Key factors to monitor include response times, error rates, and throughput to identify any performance bottlenecks in real-time.
User Experience Monitoring
User experience is a key factor for success, especially for web applications. Consider monitoring tools that track metrics like page load times, transaction completion rates, and user interactions, offering insights into how users engage with your web app and where improvements may be needed.
How to Choose the Right Monitoring Tool for Your Web Application
When evaluating monitoring solutions, it’s important to compare the following features:
Scalability: Can the tool handle the growing demands of your application?
Ease of Use: Is the tool user-friendly and intuitive?
Integration Capabilities: Does it integrate easily with other tools in your tech stack?
Cost: Is the pricing model affordable for your business needs?
Look for solutions that are easy to scale, have a smooth learning curve, and integrate well with your existing systems. Don't forget to check subscription plans and pricing to ensure it fits within your budget.
Benefits of Using a Specialized Monitoring Tool
Specialized monitoring tools offer in-depth features tailored to web applications, providing valuable insights, advanced customization, and dedicated support.
Choose a provider that offers responsive customer service to quickly address any issues specific to your app and ensure optimal website or web application performance.
Summary
In today’s digital landscape, effective web application performance monitoring is essential for ensuring your applications run smoothly, securely, and efficiently. With a variety of tools in the market, choosing the right application monitoring solution for your business depends on factors like scalability, ease of use, and integration capabilities.
Whether you're seeking simple uptime tracking or a robust, all-in-one monitoring platform, the tools we've explored provide a wide range of features that can help optimize performance, enhance security, and improve user experience.
By selecting the right monitoring solution, you can stay ahead of potential issues, quickly address performance bottlenecks, and keep your web applications operating at peak efficiency.
With tools like StatusGator, New Relic, and Honeycomb leading the way in advanced monitoring capabilities, your team will have the necessary insights to prevent disruptions and deliver exceptional experiences to your users.
Ultimately, investing in the right monitoring tool is a crucial step toward ensuring your web applications are always performing at their best, empowering your team to take proactive action and maintain a seamless user experience.