MICROSOFT POWER BI: How Power BI Helps to Fall in Love with Data!
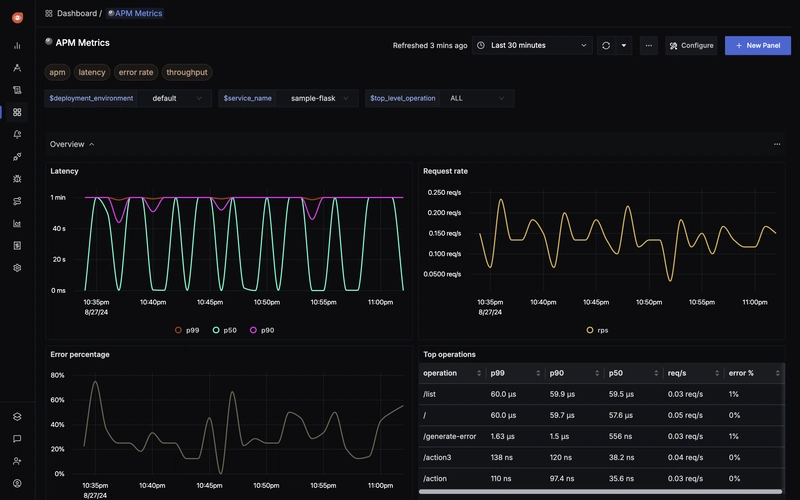
When people talk about Power BI, they usually thinking of the desktop app, where you build reports by dragging and dropping charts and visuals. But that’s just one piece of the puzzle. Power BI is a whole ecosystem. Once the report is built, the real magic happens when you publish it to the Power BI Service, which is Microsoft’s cloud platform for sharing and collaborating on dashboards. It’s where a team can view live reports, leave comments, set up updates, and make sure everyone’s working from the same table. If Power BI Desktop is a creative studio, the Power BI Service is a stage where your work reaches the people who need it. Power BI Desktop is a tool for data investigation and visualization. Analysts can take data and create interactive reports that enable end users to garner previously buried insights. In finance, Power BI is used to automate the generation of profit and loss (P&L) statements or analyze costs over time. In construction, you could use Power BI to identify variances in times to complete projects based on team composition or geographical factors. In retail, you might identify which products are the most successful, while pinpointing which ones might be on the cusp of taking off if given a bit more of a push via a whatif analysis. Below is how Power BI transforms cold, hard numbers into something engaging and insightful. It makes data exploration genuinely enjoyable in businesses and organizations 1. Visualisation: Watch Your Data Come Alive Spreadsheets can be a snoozefest. Power BI changes the game by turning your data into vibrant, interactive stories that are fun to explore. Imagine seeing your sales and profits hotspots light up on a map, tracking your team’s progress in real time, or clicking through a dashboard that responds instantly to your curiosity. These visuals just look good, they help you get what’s happening in your business and organisation. An analyst doesn’t need to be a data wizard. With easy drag-and-drop features, a beginner analys can create stunning, smart visuals that do more than report,they reveal, explain, and inspire action. 2. Greater Decisions with AI Insights Analysts should listen to what the data is saying, and understand to what the data entails. That's where Power BI's powerful AI-driven insights come into play. It helps an analysts understand why it happened and what might happen next. Imagine being able to ask your dashboard questions like, "What caused last quarter’s sales drop?" or "Which product is most likely to drive revenue next month?"—and getting meaningful, easy-to-understand answers. With features like natural language queries, even non-technical users can interact with data conversationally, skipping complex formulas and diving straight into insights. Power BI also leverages machine learning to highlight key influencers, spot trends, and even detect anomalies before they become problems. It turns reactive decisions into proactive strategies hence allowing you to address risks, seize opportunities, and impress stakeholders with data backed foresight. Whether you’re a marketer tracking campaign performance or a finance lead forecasting revenue, Power BI becomes your built-in data analyst, alerting you to the insights you might have missed. No coding. No spreadsheets overload. Just smart, intuitive intelligence served up exactly when and where you need it. With Power BI, your data it becomes a strategic partner in every decision you make. 3. Connect Everything Data is scattered across CRM platforms, spreadsheets, cloud storage, web analytics tools, and countless other apps. Managing it all can feel like piecing together a puzzle without the picture on the box. That’s where Power BI steps in as the ultimate connector. It acts like a data diplomat, bringing harmony to your information chaos by integrating effortlessly with hundreds of data sources such as SQL databases, Excel files, SharePoint, Azure, Google Analytics, Salesforce. Power BI breaks down traditional data silos that keep your insights trapped in separate systems. An analyst gets a centralized, real-time view of everything that matters sales, customer behaviour, marketing performance, inventory, and beyond. Whether you’re a decisionmaker who needs a big perspective or an analyst tracking granular metrics, Power BI creates one unified source of truth for your entire organisation. Power BI is designed to sync, update, and visualize your data automatically. Just one powerful platform that lets all your data speak the same language, confidently, and beautifully. 4. Easy Accessible Work doesn’t just happen at your desk and office anymore. Sometimes you're deep in a presentation at the office. Other times, you're sipping coffee at a café, checking in on numbers from your phone. Or maybe you're on the couch at 10 p.m., making last-minute tweaks before a big meeting. Power BI makes sure your data is right there with you wherever you are.

When people talk about Power BI, they usually thinking of the desktop app, where you build reports by dragging and dropping charts and visuals. But that’s just one piece of the puzzle. Power BI is a whole ecosystem. Once the report is built, the real magic happens when you publish it to the Power BI Service, which is Microsoft’s cloud platform for sharing and collaborating on dashboards. It’s where a team can view live reports, leave comments, set up updates, and make sure everyone’s working from the same table. If Power BI Desktop is a creative studio, the Power BI Service is a stage where your work reaches the people who need it.
Power BI Desktop is a tool for data investigation and visualization. Analysts can take data and create interactive reports that enable end users to garner previously buried insights. In finance, Power BI is used to automate the generation of profit and loss (P&L) statements or analyze costs over time. In construction, you could use Power BI to identify variances in times to complete projects based on team composition or geographical factors. In retail, you might identify which products are the most successful, while pinpointing which ones might be on the cusp of taking off if given a bit more of a push via a whatif analysis.
Below is how Power BI transforms cold, hard numbers into something engaging and insightful. It makes data exploration genuinely enjoyable in businesses and organizations
1. Visualisation: Watch Your Data Come Alive
Spreadsheets can be a snoozefest. Power BI changes the game by turning your data into vibrant, interactive stories that are fun to explore. Imagine seeing your sales and profits hotspots light up on a map, tracking your team’s progress in real time, or clicking through a dashboard that responds instantly to your curiosity. These visuals just look good, they help you get what’s happening in your business and organisation. An analyst doesn’t need to be a data wizard. With easy drag-and-drop features, a beginner analys can create stunning, smart visuals that do more than report,they reveal, explain, and inspire action.
2. Greater Decisions with AI Insights
Analysts should listen to what the data is saying, and understand to what the data entails. That's where Power BI's powerful AI-driven insights come into play. It helps an analysts understand why it happened and what might happen next. Imagine being able to ask your dashboard questions like, "What caused last quarter’s sales drop?" or "Which product is most likely to drive revenue next month?"—and getting meaningful, easy-to-understand answers. With features like natural language queries, even non-technical users can interact with data conversationally, skipping complex formulas and diving straight into insights.
Power BI also leverages machine learning to highlight key influencers, spot trends, and even detect anomalies before they become problems. It turns reactive decisions into proactive strategies hence allowing you to address risks, seize opportunities, and impress stakeholders with data backed foresight. Whether you’re a marketer tracking campaign performance or a finance lead forecasting revenue, Power BI becomes your built-in data analyst, alerting you to the insights you might have missed.
No coding. No spreadsheets overload. Just smart, intuitive intelligence served up exactly when and where you need it. With Power BI, your data it becomes a strategic partner in every decision you make.
3. Connect Everything
Data is scattered across CRM platforms, spreadsheets, cloud storage, web analytics tools, and countless other apps. Managing it all can feel like piecing together a puzzle without the picture on the box. That’s where Power BI steps in as the ultimate connector. It acts like a data diplomat, bringing harmony to your information chaos by integrating effortlessly with hundreds of data sources such as SQL databases, Excel files, SharePoint, Azure, Google Analytics, Salesforce.
Power BI breaks down traditional data silos that keep your insights trapped in separate systems. An analyst gets a centralized, real-time view of everything that matters sales, customer behaviour, marketing performance, inventory, and beyond. Whether you’re a decisionmaker who needs a big perspective or an analyst tracking granular metrics, Power BI creates one unified source of truth for your entire organisation.
Power BI is designed to sync, update, and visualize your data automatically. Just one powerful platform that lets all your data speak the same language, confidently, and beautifully.
4. Easy Accessible
Work doesn’t just happen at your desk and office anymore. Sometimes you're deep in a presentation at the office. Other times, you're sipping coffee at a café, checking in on numbers from your phone. Or maybe you're on the couch at 10 p.m., making last-minute tweaks before a big meeting. Power BI makes sure your data is right there with you wherever you are.
With a cloud-based platform, Power BI keeps everything synced in real time. No more emailing spreadsheets back and forth or wondering if you're looking at the latest version. Dashboards are mobile-friendly and beautifully responsive, so whether you’re using a tablet, phone, or laptop, your insights always look sharp and work smoothly. You can explore reports, spot trends, and share updates without needing to be at your desk or even in the office.
It’s built with security in mind, so while you enjoy the flexibility, your data stays protected. Power BI gives you the freedom to work the way you want, wherever you are. Because in today’s world, staying informed shouldn’t mean staying stuck in one place.
GETTING STARTED WITH POWER BI
Power BI is a lot easier than you might think,no technical wizardry required. You can begin by simply downloading Power BI Desktop (FREE), and within a blink of an eye , turning raw data into meaningful stories. Whether your data lives in Excel, SQL, SharePoint, or a cloud app, connecting it is as easy as clicking a few buttons. From there, you can clean and shape your data using intuitive, easy friendly tools, no complicated formulas or coding needed. The fun begins,building your first dashboard. Drag, drop, design,it’s that simple. Once you're happy with your visuals, you can publish them to the cloud and share them with your team .Power BI takes the mystery out of data and makes it something anyone can explore, understand, and actually enjoy.
Conclusion: It's Time to Date Your Data
Fall in love with data might sound like a bit much. But once you start using Power BI, it does change how you see things. Those endless spreadsheets you used to dread? They suddenly become stories filled with meaning. Numbers that once felt cold and confusing start making sense and even sparking ideas. Power BI takes the overwhelm out of data and replaces it with curiosity, clarity, and a sense of control.
Power BI is not just a tool for analysts or. It’s for anyone who’s ever looked at a report and thought, “There’s got to be a better way.” With Power BI, there is. It’s visual, it’s intuitive, and it’s surprisingly fun to use. Whether you're new to data or you've been wrangling reports for years, it makes the process feel less like work and more like discovery.
So give it a try. Play with your data. Ask questions. Build something. You might be surprised at how empowering it feels and how quickly you go from avoiding reports to actually looking forward to them.



















![[The AI Show Episode 146]: Rise of “AI-First” Companies, AI Job Disruption, GPT-4o Update Gets Rolled Back, How Big Consulting Firms Use AI, and Meta AI App](https://www.marketingaiinstitute.com/hubfs/ep%20146%20cover.png)


































































.jpg?width=1920&height=1920&fit=bounds&quality=70&format=jpg&auto=webp#)







_Steven_Jones_Alamy.jpg?width=1280&auto=webp&quality=80&disable=upscale#)
_Brian_Jackson_Alamy.jpg?width=1280&auto=webp&quality=80&disable=upscale#)


 Stolen 884,000 Credit Card Details on 13 Million Clicks from Users Worldwide.webp?#)








![Google Mocks Rumored 'iPhone 17 Air' Design in New Pixel Ad [Video]](https://www.iclarified.com/images/news/97224/97224/97224-640.jpg)

![Apple Shares Official Teaser for 'Highest 2 Lowest' Starring Denzel Washington [Video]](https://www.iclarified.com/images/news/97221/97221/97221-640.jpg)


