


![[The AI Show Episode 145]: OpenAI Releases o3 and o4-mini, AI Is Causing “Quiet Layoffs,” Executive Order on Youth AI Education & GPT-4o’s Controversial Update](https://www.marketingaiinstitute.com/hubfs/ep%20145%20cover.png)


_Inge_Johnsson-Alamy.jpg?width=1280&auto=webp&quality=80&disable=upscale#)


![Turn any iPad into a gaming display with this one simple trick [Video]](https://i0.wp.com/9to5mac.com/wp-content/uploads/sites/6/2025/05/iPad-as-console-FI.jpg?resize=1200%2C628&quality=82&strip=all&ssl=1)


![Apple Shares Official Teaser for 'Highest 2 Lowest' Starring Denzel Washington [Video]](https://www.iclarified.com/images/news/97221/97221/97221-640.jpg)

![Under-Display Face ID Coming to iPhone 18 Pro and Pro Max [Rumor]](https://www.iclarified.com/images/news/97215/97215/97215-640.jpg)
![New Powerbeats Pro 2 Wireless Earbuds On Sale for $199.95 [Lowest Price Ever]](https://www.iclarified.com/images/news/97217/97217/97217-640.jpg)


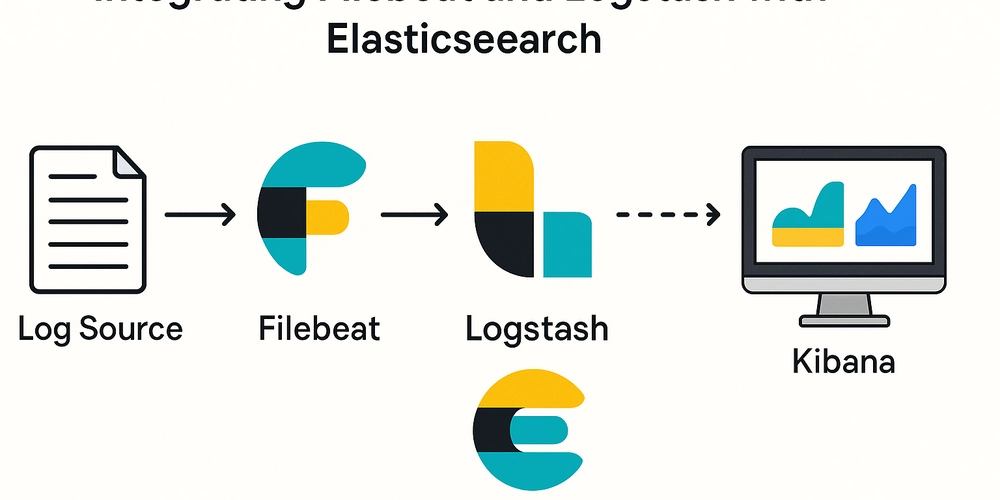
Integrating Filebeat and Logstash with Elasticsearch
In today's fast-paced digital landscape, efficient log management is not just a convenience—it's a necessity. Logs are fundamental to diagnosing errors, tracking performance, and ensuring the overall health of infrastructure and applications. One of the most effective and scalable solutions for centralized logging is the combination of Filebeat, Logstash, and Elasticsearch, commonly referred to as part of the ELK stack. When used together, they provide a flexible pipeline for shipping, transforming, and storing logs, which can then be analyzed and visualized using Kibana. This comprehensive guide walks you through a practical setup of Filebeat and Logstash integration, with step-by-step instructions, configuration samples, troubleshooting tips, and best practices to help you get the most out of your logging infrastructure. Brief Overview of Technologies Let’s start by understanding the roles each tool plays in the pipeline: Filebeat: A lightweight data shipper designed to forward and centralize log data. It reads logs from files, tailing them in near-real-time, and forwards them to Logstash or Elasticsearch. Logstash: A flexible data processing pipeline capable of ingesting data from multiple sources. It transforms and enriches the data using a powerful plugin system before sending it to Elasticsearch. Elasticsearch: A distributed search and analytics engine. It indexes the incoming structured data and makes it queryable with high performance. Kibana: A web-based frontend that connects to Elasticsearch and provides visualization, dashboards, and powerful querying tools. Setting Up the Environment Pre-requisites To follow along with this guide, make sure you have the following components: Two servers or virtual machines: Server A: Hosts the ELK stack (Elasticsearch, Logstash, Kibana). Server B: Acts as the log source and hosts Filebeat. Filebeat installed on Server B. Logstash, Elasticsearch, and Kibana installed and running on Server A. Basic familiarity with YAML, Linux CLI, and service management (systemctl). Open TCP port 5044 on Server A (for Logstash to receive Filebeat logs). Pro tip: Consider using Docker or Docker Compose to quickly spin up the ELK stack for testing purposes. Configuration Directory Structure It’s essential to know where configuration files live on your system: Logstash configs: /etc/logstash/conf.d/ Filebeat config: /etc/filebeat/filebeat.yml Log files: Typically in /var/log/ Configuring Logstash to Receive Logs We’ll begin by setting up Logstash to listen for incoming data from Filebeat. Navigate to Logstash’s configuration directory: cd /etc/logstash/conf.d Create a new configuration file, e.g., filebeat-input.conf: nano filebeat-input.conf Insert the following configuration to define input and output: input { beats { port => 5044 } } filter { # Optional: add filters here } output { elasticsearch { hosts => ["http://localhost:9200"] index => "filebeat-%{+YYYY.MM.dd}" } } Restart Logstash: systemctl restart logstash Confirm that Logstash is listening on port 5044: netstat -tulnp | grep 5044 Configuring Filebeat to Ship Logs Edit Filebeat's main configuration file: nano /etc/filebeat/filebeat.yml Comment out the Elasticsearch output to avoid direct shipping: #output.elasticsearch: # hosts: ["localhost:9200"] Enable the Logstash output and specify the Logstash server: output.logstash: hosts: [":5044"] Optionally define inputs explicitly: filebeat.inputs: - type: log enabled: true paths: - /var/log/syslog - /var/log/auth.log Restart Filebeat to apply the configuration: systemctl restart filebeat Check Filebeat logs for errors: tail -f /var/log/filebeat/filebeat.log Sending Sample Logs to Validate the Setup You can simulate logs manually: logger "This is a test log from Filebeat" Then navigate to Kibana: Open Kibana in your browser: http://:5601 Go to "Stack Management > Index Patterns" and create a new pattern: filebeat-* Head to "Discover" and search for your sample log. Parsing and Transforming Logs with Logstash Filters Logstash allows you to extract fields and format logs for improved querying. Example: Parsing Nginx Logs filter { grok { match => { "message" => "%{IPORHOST:client} %{USER:ident} %{USER:id} \[%{HTTPDATE:timestamp}\] \"%{WORD:method} %{URIPATHPARAM:request} HTTP/%{NUMBER:httpversion}\" %{NUMBER:response} %{NUMBER:bytes}" } } date { match => ["timestamp", "dd/MMM/yyyy:HH:mm:ss Z"] } } Example: JSON Logs filter { json { source => "message" } } Tip: Always test you
In today's fast-paced digital landscape, efficient log management is not just a convenience—it's a necessity. Logs are fundamental to diagnosing errors, tracking performance, and ensuring the overall health of infrastructure and applications. One of the most effective and scalable solutions for centralized logging is the combination of Filebeat, Logstash, and Elasticsearch, commonly referred to as part of the ELK stack. When used together, they provide a flexible pipeline for shipping, transforming, and storing logs, which can then be analyzed and visualized using Kibana.
This comprehensive guide walks you through a practical setup of Filebeat and Logstash integration, with step-by-step instructions, configuration samples, troubleshooting tips, and best practices to help you get the most out of your logging infrastructure.
Brief Overview of Technologies
Let’s start by understanding the roles each tool plays in the pipeline:
- Filebeat: A lightweight data shipper designed to forward and centralize log data. It reads logs from files, tailing them in near-real-time, and forwards them to Logstash or Elasticsearch.
- Logstash: A flexible data processing pipeline capable of ingesting data from multiple sources. It transforms and enriches the data using a powerful plugin system before sending it to Elasticsearch.
- Elasticsearch: A distributed search and analytics engine. It indexes the incoming structured data and makes it queryable with high performance.
- Kibana: A web-based frontend that connects to Elasticsearch and provides visualization, dashboards, and powerful querying tools.
Setting Up the Environment
Pre-requisites
To follow along with this guide, make sure you have the following components:
-
Two servers or virtual machines:
- Server A: Hosts the ELK stack (Elasticsearch, Logstash, Kibana).
- Server B: Acts as the log source and hosts Filebeat.
Filebeat installed on Server B.
Logstash, Elasticsearch, and Kibana installed and running on Server A.
Basic familiarity with YAML, Linux CLI, and service management (systemctl).
Open TCP port 5044 on Server A (for Logstash to receive Filebeat logs).
Pro tip: Consider using Docker or Docker Compose to quickly spin up the ELK stack for testing purposes.
Configuration Directory Structure
It’s essential to know where configuration files live on your system:
-
Logstash configs:
/etc/logstash/conf.d/ -
Filebeat config:
/etc/filebeat/filebeat.yml -
Log files: Typically in
/var/log/
Configuring Logstash to Receive Logs
We’ll begin by setting up Logstash to listen for incoming data from Filebeat.
- Navigate to Logstash’s configuration directory:
cd /etc/logstash/conf.d
- Create a new configuration file, e.g.,
filebeat-input.conf:
nano filebeat-input.conf
- Insert the following configuration to define input and output:
   input {
     beats {
       port => 5044
     }
   }

   filter {
     # Optional: add filters here
   }

   output {
     elasticsearch {
       hosts => ["http://localhost:9200"]
       index => "filebeat-%{+YYYY.MM.dd}"
     }
   }
- Restart Logstash:
systemctl restart logstash
- Confirm that Logstash is listening on port 5044:
netstat -tulnp | grep 5044
Configuring Filebeat to Ship Logs
- Edit Filebeat's main configuration file:
nano /etc/filebeat/filebeat.yml
- Comment out the Elasticsearch output to avoid direct shipping:
   #output.elasticsearch:
   #  hosts: ["localhost:9200"]
- Enable the Logstash output and specify the Logstash server:
output.logstash:
hosts: [":5044" ]
- Optionally define inputs explicitly:
   filebeat.inputs:
     - type: log
       enabled: true
       paths:
         - /var/log/syslog
         - /var/log/auth.log
- Restart Filebeat to apply the configuration:
systemctl restart filebeat
- Check Filebeat logs for errors:
tail -f /var/log/filebeat/filebeat.log
Sending Sample Logs to Validate the Setup
You can simulate logs manually:
logger "This is a test log from Filebeat"
Then navigate to Kibana:
- Open Kibana in your browser:
http://:5601
- Go to "Stack Management > Index Patterns" and create a new pattern:
filebeat-*
- Head to "Discover" and search for your sample log.
Parsing and Transforming Logs with Logstash Filters
Logstash allows you to extract fields and format logs for improved querying.
Example: Parsing Nginx Logs
filter {
  grok {
    match => {
      "message" => "%{IPORHOST:client} %{USER:ident} %{USER:id} \[%{HTTPDATE:timestamp}\] \"%{WORD:method} %{URIPATHPARAM:request} HTTP/%{NUMBER:httpversion}\" %{NUMBER:response} %{NUMBER:bytes}"
    }
  }
  date {
    match => ["timestamp", "dd/MMM/yyyy:HH:mm:ss Z"]
  }
}
Example: JSON Logs
filter {
  json {
    source => "message"
  }
}
Tip: Always test your filters using the Grok Debugger in Kibana or online.
Working with Filebeat Modules
Filebeat includes modules for common applications like Nginx, Apache, MySQL, and System logs.
- Enable a module:
filebeat modules enable nginx
- List enabled modules:
filebeat modules list
- Test configuration:
filebeat test config
- Run Filebeat setup:
filebeat setup --dashboards
This automatically configures dashboards and parsers for supported logs.
Monitoring and Troubleshooting
Key Log Locations
- Filebeat logs:
/var/log/filebeat/filebeat.log - Logstash logs:
/var/log/logstash/logstash-plain.log - Elasticsearch logs:
/var/log/elasticsearch/
Use tail -f to monitor logs in real time:
tail -f /var/log/logstash/logstash-plain.log
Common Issues
- Connection Refused: Check if Logstash is listening on the right port.
- Permission Denied: Ensure Filebeat has access to log files.
-
Pipeline Errors: Validate Logstash config with
--config.test_and_exit
Creating Dashboards in Kibana
- Navigate to Dashboard > Create New Dashboard
- Add visualizations like:
- Line chart of logs over time
- Pie chart of log sources
- Table of error messages
Best Practices
- Use structured logs: JSON logs are easier to parse and index.
- Limit fields: Reduce unnecessary fields to improve indexing performance.
-
Secure communication:
- Use TLS for Filebeat to Logstash
- Enable Elasticsearch authentication
- Use API keys or users with limited permissions
Conclusion
Integrating Filebeat with Logstash and Elasticsearch provides a robust, scalable logging solution. Whether you're debugging a failed deployment or analyzing traffic spikes, a centralized logging pipeline helps you act fast and make informed decisions. With modules, filters, and dashboards, you can tailor the solution to any infrastructure.
Invest the time to monitor, fine-tune, and secure your pipeline—it will pay off in visibility and system reliability.
FAQs
What benefits does this integration provide?
Centralization, consistency, and query power.Can it handle high-volume logs?
Yes, with proper tuning, buffering, and horizontal scaling.How can I enrich logs with metadata?
Use theadd_fieldsprocessor in Filebeat or enrichments in Logstash.Is there a way to archive old logs?
Use Elasticsearch ILM (Index Lifecycle Management).How to make this setup production-ready?
Add monitoring (Metricbeat), enable security features, and use backups.