


![[The AI Show Episode 144]: ChatGPT’s New Memory, Shopify CEO’s Leaked “AI First” Memo, Google Cloud Next Releases, o3 and o4-mini Coming Soon & Llama 4’s Rocky Launch](https://www.marketingaiinstitute.com/hubfs/ep%20144%20cover.png)


.jpg?#)


![Apple to Shift Robotics Unit From AI Division to Hardware Engineering [Report]](https://www.iclarified.com/images/news/97128/97128/97128-640.jpg)

![Apple Shares New Ad for iPhone 16: 'Trust Issues' [Video]](https://www.iclarified.com/images/news/97125/97125/97125-640.jpg)


Analyzing OutOfMemoryError: GC Overhead Limit Exceeded
In this article, we’ll be taking a look at the Java runtime error: java.lang.outofmemoryerror: gc overhead limit exceeded. It’s a fairly common error, but it can be confusing, because the same program can throw either java.lang.outofmemoryerror: gc overhead limit exceeded, or java.lang.outofmemoryerror: java heap space. This can even happen when the program is running with exactly the same data. What causes the error? How can we fix it, and why does the same program sometimes alternate between two different error messages? Let’s look for some answers. What is GC, and What Causes a Program to Crash With java.lang.outofmemoryerror: gc overhead limit exceeded? Garbage Collection (GC) is a process that runs periodically within the JVM to clean up items in memory that are no longer needed. For a full description of GC, and how to tune it, read this article: What is Java Garbage Collection? The error java.lang.outofmemoryerror: gc overhead limit exceeded occurs when: GC is using 98% or more of the available CPU time, preventing the application from doing any actual work AND GC is releasing less that 2% of memory on each cycle AND This has happened consistently for the last 5 GC cycles. In simple terms, this means GC is continually running, but not freeing a significant amount of memory. Application performance degrades dramatically, and the JVM aborts the program to prevent it hogging CPU time to no purpose. The reason it may alternate with throwing java.lang.outofmemoryerror: java heap space is that in both cases, available memory is dangerously low. Depending on what else is happening on the machine, it’s a matter of chance which error is thrown first. Causes A few different issues may cause this error, including: The application has a memory leak. Either unused memory is not released in a timely manner, or the program is looping on a method that uses a lot of memory; Traffic has spiked; The application has been moved to the production environment without carrying out adequate load testing; The heap has not been configured large enough for the application’s needs. Troubleshooting Out of Memory Errors Affecting the Heap For these errors, we need to analyze: GC efficiency; Heap contents. It’s worth obtaining and analyzing a GC log. A good tool for this is GCeasy. It helps determine whether the problem is likely to be caused by a memory leak, and whether GC is working correctly. Looking at graphs of memory freed on each GC cycle, we can see a definite pattern that indicates a memory leak. Fig: Comparing a healthy GC pattern with a memory leak pattern using GCeasy The diagram at the top shows a graph of GC functioning efficiently. Memory increases, but decreases back to the same level after each GC cycle. The bottom diagram shows a typical memory leak pattern. The GC is releasing some memory, but overall, memory usage keeps increasing with time. Next, we need to take a heap dump. A heap dump is a snapshot of heap memory, holding details of each item. It includes both the parents and children of each object in the heap. We can analyze it to determine: What objects are occupying the most space? What parts of the source code reference those objects? The easiest way to do this is to use the HeapHero tool. This article, Java OutOfMemoryError: GC Overhead Limit Exceeded, contains a sample program that throws the error, and a detailed explanation of how to trace the problem using HeapHero. Solutions Once we’ve identified the problem, we can decide on a solution. This may be one of the following: Fix memory leaks; Increase the heap size using the JVM switches -Xms (Initial size) and -Xmx (Maximum size); Upgrade to a newer version of Java. GC is progressively more efficient in each new release; Tune GC. Conclusion The error java.lang.outofmemoryerror: gc overhead limit exceeded occurs when the heap is short of space, and may alternate with the error java.lang.outofmemoryerror: java heap space. To solve it, we need to analyze the heap, as well as looking at GC efficiency. We can then either fix the application, or increase memory limits.
In this article, we’ll be taking a look at the Java runtime error: java.lang.outofmemoryerror: gc overhead limit exceeded. It’s a fairly common error, but it can be confusing, because the same program can throw either java.lang.outofmemoryerror: gc overhead limit exceeded, or java.lang.outofmemoryerror: java heap space. This can even happen when the program is running with exactly the same data.
What causes the error? How can we fix it, and why does the same program sometimes alternate between two different error messages? Let’s look for some answers.
What is GC, and What Causes a Program to Crash With java.lang.outofmemoryerror: gc overhead limit exceeded?
Garbage Collection (GC) is a process that runs periodically within the JVM to clean up items in memory that are no longer needed. For a full description of GC, and how to tune it, read this article: What is Java Garbage Collection?
The error java.lang.outofmemoryerror: gc overhead limit exceeded occurs when:
GC is using 98% or more of the available CPU time, preventing the application from doing any actual work AND
GC is releasing less that 2% of memory on each cycle AND
This has happened consistently for the last 5 GC cycles.
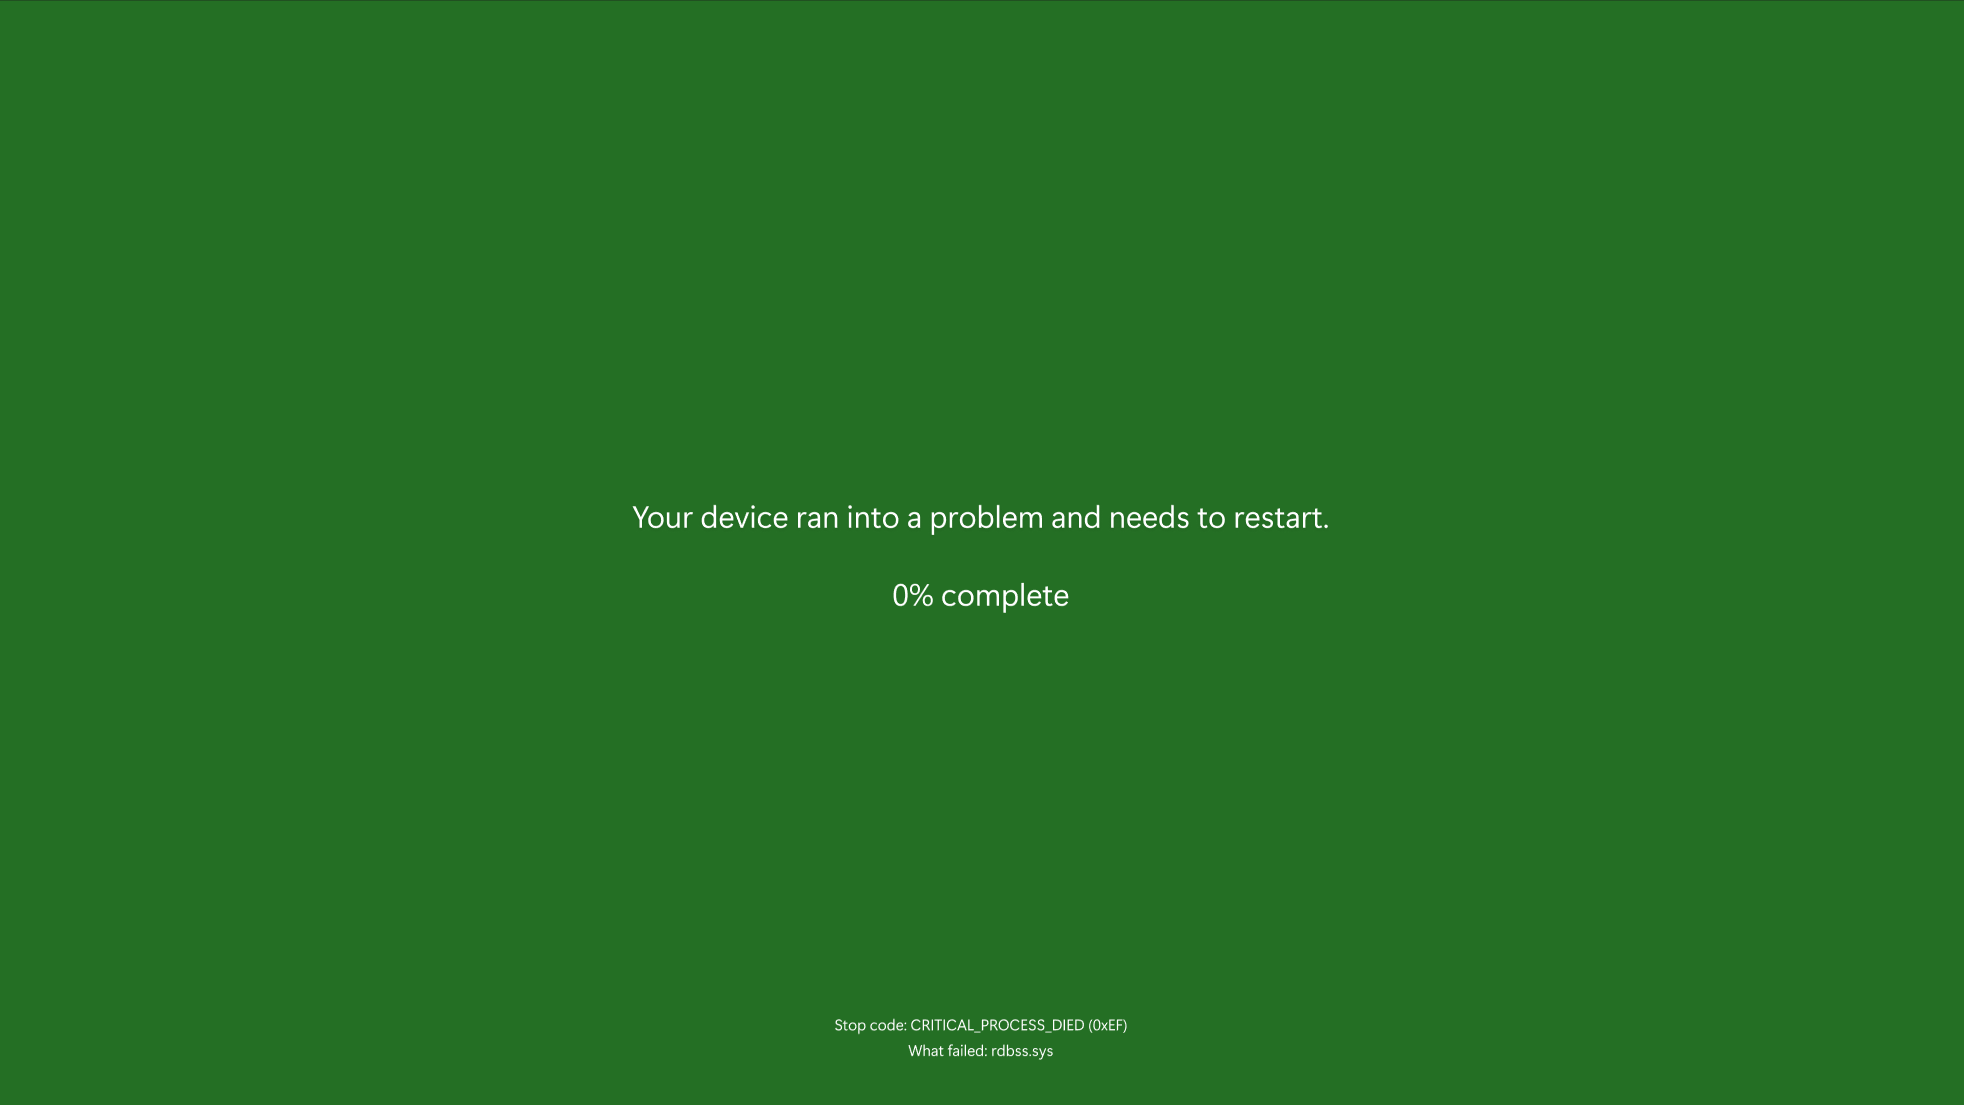
In simple terms, this means GC is continually running, but not freeing a significant amount of memory. Application performance degrades dramatically, and the JVM aborts the program to prevent it hogging CPU time to no purpose.
The reason it may alternate with throwing java.lang.outofmemoryerror: java heap space is that in both cases, available memory is dangerously low. Depending on what else is happening on the machine, it’s a matter of chance which error is thrown first.
Causes
A few different issues may cause this error, including:
The application has a memory leak. Either unused memory is not released in a timely manner, or the program is looping on a method that uses a lot of memory;
Traffic has spiked;
The application has been moved to the production environment without carrying out adequate load testing;
The heap has not been configured large enough for the application’s needs.
Troubleshooting Out of Memory Errors Affecting the Heap
For these errors, we need to analyze:
GC efficiency;
Heap contents.
It’s worth obtaining and analyzing a GC log. A good tool for this is GCeasy. It helps determine whether the problem is likely to be caused by a memory leak, and whether GC is working correctly.
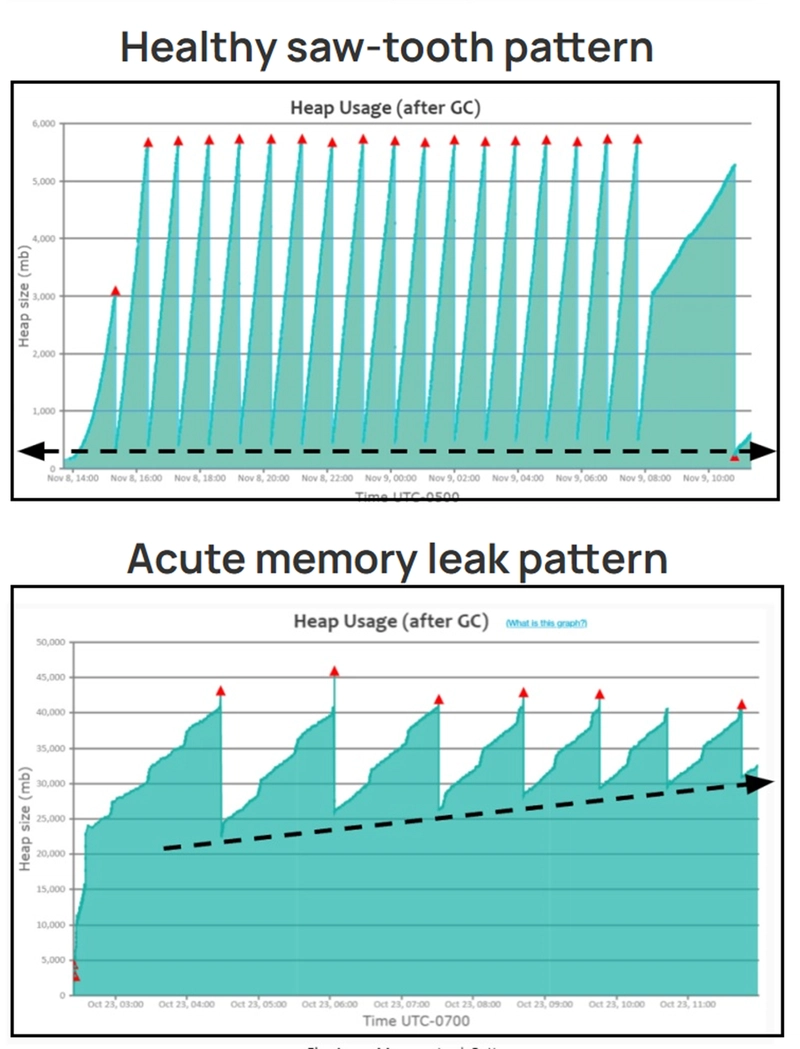
Looking at graphs of memory freed on each GC cycle, we can see a definite pattern that indicates a memory leak.
Fig: Comparing a healthy GC pattern with a memory leak pattern using GCeasy
The diagram at the top shows a graph of GC functioning efficiently. Memory increases, but decreases back to the same level after each GC cycle.
The bottom diagram shows a typical memory leak pattern. The GC is releasing some memory, but overall, memory usage keeps increasing with time.
Next, we need to take a heap dump. A heap dump is a snapshot of heap memory, holding details of each item. It includes both the parents and children of each object in the heap. We can analyze it to determine:
What objects are occupying the most space?
What parts of the source code reference those objects?
The easiest way to do this is to use the HeapHero tool. This article, Java OutOfMemoryError: GC Overhead Limit Exceeded, contains a sample program that throws the error, and a detailed explanation of how to trace the problem using HeapHero.
Solutions
Once we’ve identified the problem, we can decide on a solution. This may be one of the following:
Fix memory leaks;
Increase the heap size using the JVM switches
-Xms(Initial size) and-Xmx(Maximum size);Upgrade to a newer version of Java. GC is progressively more efficient in each new release;
Tune GC.
Conclusion
The error java.lang.outofmemoryerror: gc overhead limit exceeded occurs when the heap is short of space, and may alternate with the error java.lang.outofmemoryerror: java heap space.
To solve it, we need to analyze the heap, as well as looking at GC efficiency. We can then either fix the application, or increase memory limits.