


.jpg?width=1920&height=1920&fit=bounds&quality=70&format=jpg&auto=webp#)


_Olekcii_Mach_Alamy.jpg?width=1280&auto=webp&quality=80&disable=upscale#)


![Apple Drops New Immersive Adventure Episode for Vision Pro: 'Hill Climb' [Video]](https://www.iclarified.com/images/news/97133/97133/97133-640.jpg)

![Most iPhones Sold in the U.S. Will Be Made in India by 2026 [Report]](https://www.iclarified.com/images/news/97130/97130/97130-640.jpg)
![Apple to Shift Robotics Unit From AI Division to Hardware Engineering [Report]](https://www.iclarified.com/images/news/97128/97128/97128-640.jpg)


TryHackMe: Snort
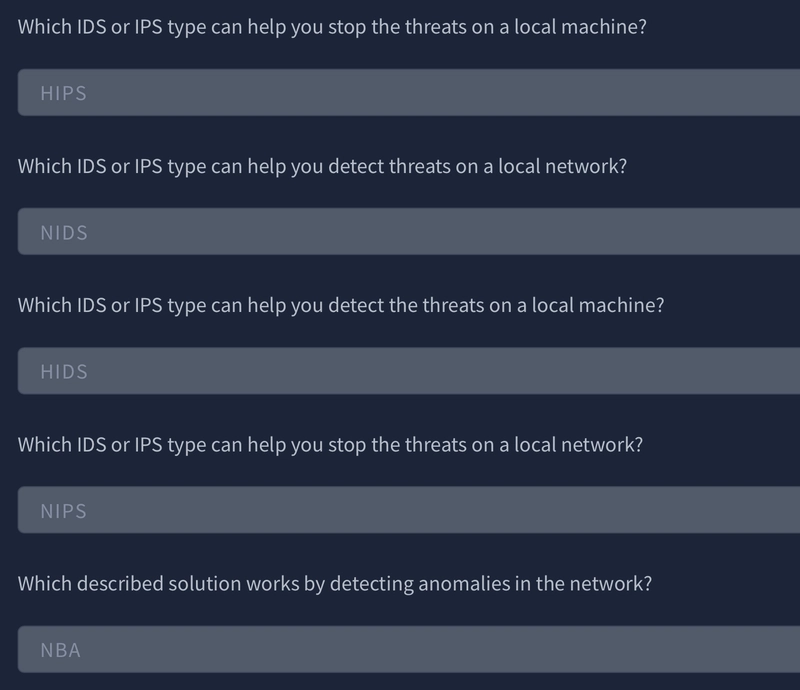
1. Snort Before diving into Snort and analysing traffic, let's have a brief overview of what an Intrusion Detection System (IDS) and Intrusion Prevention System (IPS) is. It is possible to configure your network infrastructure and use both of them, but before starting to use any of them, let's learn the differences. Intrusion Detection System (IDS) IDS is a passive monitoring solution for detecting possible malicious activities/patterns, abnormal incidents, and policy violations. It is responsible for generating alerts for each suspicious event. There are two main types of IDS systems; Network Intrusion Detection System (NIDS) - NIDS monitors the traffic flow from various areas of the network. The aim is to investigate the traffic on the entire subnet. If a signature is identified, an alert is created. Host-based Intrusion Detection System (HIDS) - HIDS monitors the traffic flow from a single endpoint device. The aim is to investigate the traffic on a particular device. If a signature is identified, an alert is created.\ Intrusion Prevention System (IPS) IPS is an active protecting solution for preventing possible malicious activities/patterns, abnormal incidents, and policy violations. It is responsible for stopping/preventing/terminating the suspicious event as soon as the detection is performed. There are four main types of IPS systems; Network Intrusion Prevention System (NIPS) - NIPS monitors the traffic flow from various areas of the network. The aim is to protect the traffic on the entire subnet. If a signature is identified, the connection is terminated. Behaviour-based Intrusion Prevention System (Network Behaviour Analysis - NBA) - Behaviour-based systems monitor the traffic flow from various areas of the network. The aim is to protect the traffic on the entire subnet. If an anomaly is identified, the connection is terminated. Network Behaviour Analysis System works similar to NIPS. The difference between NIPS and Behaviour-based is that behaviour based systems require a training period (also known as "baselining") to learn the normal traffic and differentiate the malicious traffic and threats. This model provides more efficient results against new and unknown threats. The system is trained to know the "normal" to detect "abnormal". The training period is crucial to avoid any false positives. In case of any security breach during the training period, the results will be highly problematic. Another critical point is to ensure that the system is well trained to recognise benign activities. Wireless Intrusion Prevention System (WIPS) - WIPS monitors the traffic flow from of wireless network. The aim is to protect the wireless traffic and stop possible attacks launched from there. If a signature is identified, the connection is terminated. Host-based Intrusion Prevention System (HIPS) - HIPS actively protects the traffic flow from a single endpoint device. The aim is to investigate the traffic on a particular device. If a signature is identified, the connection is terminated. HIPS working mechanism is similar to HIDS. The difference between them is that while HIDS creates alerts for threats, HIPS stops the threats by terminating the connection. Detection/Prevention Techniques There are three main detection and prevention techniques used in IDS and IPS solutions; Technique Approach Signature-Based This technique relies on rules that identify the specific patterns of known malicious behavior. This model helps detect known threats. Behavior-Based This technique identifies new threats with new patterns that pass through signatures. The model compares the known/normal with unknown/abnormal behaviors. This model helps detect previously unknown or new threats. Policy-Based This technique compares detected activities with system configuration and security policies. This model helps detect policy violations. Summary Phew! That was a long ride and lots of information. Let's summarise the overall functions of the IDS and IPS in a nutshell. IDS can identify threats but require user assistance to stop them. IPS can identify and block the threats with less user assistance at the detection time. Now let's talk about Snort. Here is the rest of the official description of the snort; "Snort can be deployed inline to stop these packets, as well. Snort has three primary uses: As a packet sniffer like tcpdump, as a packet logger --- which is useful for network traffic debugging, or it can be used as a full-blown network intrusion prevention system. Snort can be downloaded and configured for personal and business use alike." SNORT is an open-source, rule-based Network Intrusion Detection and Prevention System (NIDS/NIPS). It was developed and still maintained by Martin Roesch, open-source contributors, and the Cisco Talos team. Capabilities of Snort; Live traffic analysis Attack and probe detection Packet logging Prot

1. Snort
Before diving into Snort and analysing traffic, let's have a brief overview of what an Intrusion Detection System (IDS) and Intrusion Prevention System (IPS) is. It is possible to configure your network infrastructure and use both of them, but before starting to use any of them, let's learn the differences.
Intrusion Detection System (IDS)
IDS is a passive monitoring solution for detecting possible malicious activities/patterns, abnormal incidents, and policy violations. It is responsible for generating alerts for each suspicious event.
There are two main types of IDS systems;
- Network Intrusion Detection System (NIDS) - NIDS monitors the traffic flow from various areas of the network. The aim is to investigate the traffic on the entire subnet. If a signature is identified, an alert is created.
- Host-based Intrusion Detection System (HIDS) - HIDS monitors the traffic flow from a single endpoint device. The aim is to investigate the traffic on a particular device. If a signature is identified, an alert is created.\ Intrusion Prevention System (IPS)
IPS is an active protecting solution for preventing possible malicious activities/patterns, abnormal incidents, and policy violations. It is responsible for stopping/preventing/terminating the suspicious event as soon as the detection is performed.
There are four main types of IPS systems;
- Network Intrusion Prevention System (NIPS) - NIPS monitors the traffic flow from various areas of the network. The aim is to protect the traffic on the entire subnet. If a signature is identified, the connection is terminated.
- Behaviour-based Intrusion Prevention System (Network Behaviour Analysis - NBA) - Behaviour-based systems monitor the traffic flow from various areas of the network. The aim is to protect the traffic on the entire subnet. If an anomaly is identified, the connection is terminated.
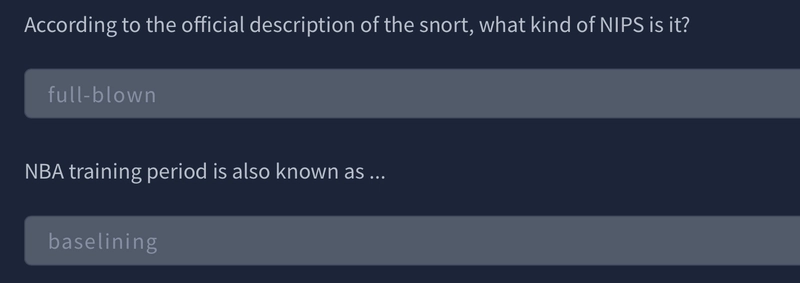
Network Behaviour Analysis System works similar to NIPS. The difference between NIPS and Behaviour-based is that behaviour based systems require a training period (also known as "baselining") to learn the normal traffic and differentiate the malicious traffic and threats. This model provides more efficient results against new and unknown threats.
The system is trained to know the "normal" to detect "abnormal". The training period is crucial to avoid any false positives. In case of any security breach during the training period, the results will be highly problematic. Another critical point is to ensure that the system is well trained to recognise benign activities.
- Wireless Intrusion Prevention System (WIPS) - WIPS monitors the traffic flow from of wireless network. The aim is to protect the wireless traffic and stop possible attacks launched from there. If a signature is identified, the connection is terminated.
- Host-based Intrusion Prevention System (HIPS) - HIPS actively protects the traffic flow from a single endpoint device. The aim is to investigate the traffic on a particular device. If a signature is identified, the connection is terminated.
HIPS working mechanism is similar to HIDS. The difference between them is that while HIDS creates alerts for threats, HIPS stops the threats by terminating the connection.
Detection/Prevention Techniques
There are three main detection and prevention techniques used in IDS and IPS solutions;
| Technique | Approach |
|---|---|
| Signature-Based | This technique relies on rules that identify the specific patterns of known malicious behavior. This model helps detect known threats. |
| Behavior-Based | This technique identifies new threats with new patterns that pass through signatures. The model compares the known/normal with unknown/abnormal behaviors. This model helps detect previously unknown or new threats. |
| Policy-Based | This technique compares detected activities with system configuration and security policies. This model helps detect policy violations. |
Summary
Phew! That was a long ride and lots of information. Let's summarise the overall functions of the IDS and IPS in a nutshell.
- IDS can identify threats but require user assistance to stop them.
- IPS can identify and block the threats with less user assistance at the detection time.
Now let's talk about Snort. Here is the rest of the official description of the snort;
"Snort can be deployed inline to stop these packets, as well. Snort has three primary uses: As a packet sniffer like tcpdump, as a packet logger --- which is useful for network traffic debugging, or it can be used as a full-blown network intrusion prevention system. Snort can be downloaded and configured for personal and business use alike."
SNORT is an open-source, rule-based Network Intrusion Detection and Prevention System (NIDS/NIPS). It was developed and still maintained by Martin Roesch, open-source contributors, and the Cisco Talos team.
Capabilities of Snort;
- Live traffic analysis
- Attack and probe detection
- Packet logging
- Protocol analysis
- Real-time alerting
- Modules & plugins
- Pre-processors
- Cross-platform support! (Linux & Windows)
Snort has three main use models;
- Sniffer Mode - Read IP packets and prompt them in the console application.
- Packet Logger Mode - Log all IP packets (inbound and outbound) that visit the network.
- NIDS (Network Intrusion Detection System) and NIPS (Network Intrusion Prevention System) Modes - Log/drop the packets that are deemed as malicious according to the user-defined rules.
Flags
2. First Interaction with Snort
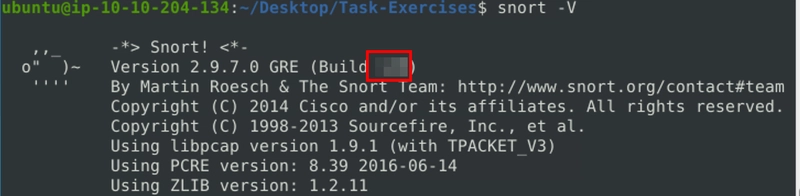
Verify Snort Installation
user@ubuntu$ snort -V

   ,,_     -*> Snort! <*-
  o"  )~   Version 2.9.7.0 GRE (Build XXXXXX)
   ''''    By Martin Roesch & The Snort Team: http://www.snort.org/contact#team
           Copyright (C) 2014 Cisco and/or its affiliates. All rights reserved.
           Copyright (C) 1998-2013 Sourcefire, Inc., et al.
           Using libpcap version 1.9.1 (with TPACKET_V3)
           Using PCRE version: 8.39 2016-06-14
           Using ZLIB version: 1.2.11
Check Snort Config File
Before getting your hands dirty, we should ensure our configuration file is valid.
Here -T is used for testing configuration, and -c is identifying the configuration file (snort.conf).
Note that it is possible to use an additional configuration file by pointing it with -c.
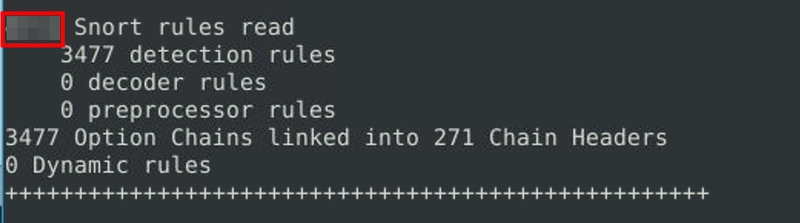
user@ubuntu$ sudo snort -c /etc/snort/snort.conf -T

        --== Initializing Snort ==--
Initializing Output Plugins!
Initializing Preprocessors!
Initializing Plug-ins!
... [Output truncated]
        --== Initialization Complete ==--

   ,,_     -*> Snort! <*-
  o"  )~   Version 2.9.7.0 GRE (Build XXXX)
   ''''    By Martin Roesch & The Snort Team: http://www.snort.org/contact#team
           Copyright (C) 2014 Cisco and/or its affiliates. All rights reserved.
           Copyright (C) 1998-2013 Sourcefire, Inc., et al.
           Using libpcap version 1.9.1 (with TPACKET_V3)
           Using PCRE version: 8.39 2016-06-14
           Using ZLIB version: 1.2.11

           Rules Engine: SF_SNORT_DETECTION_ENGINE  Version 2.4
           Preprocessor Object: SF_GTP  Version 1.1
           Preprocessor Object: SF_SIP  Version 1.1
           Preprocessor Object: SF_SSH  Version 1.1
           Preprocessor Object: SF_SMTP  Version 1.1
           Preprocessor Object: SF_POP  Version 1.0
           Preprocessor Object: SF_DCERPC2  Version 1.0
           Preprocessor Object: SF_IMAP  Version 1.0
           Preprocessor Object: SF_DNP3  Version 1.1
           Preprocessor Object: SF_SSLPP  Version 1.1
           Preprocessor Object: SF_MODBUS  Version 1.1
           Preprocessor Object: SF_SDF  Version 1.1
           Preprocessor Object: SF_REPUTATION  Version 1.1
           Preprocessor Object: SF_DNS  Version 1.1
           Preprocessor Object: SF_FTPTELNET  Version 1.2
... [Output truncated]
Snort successfully validated the configuration!
Snort exiting
Once we use a configuration file, snort got much more power! The configuration file is an all-in-one management file of the snort. Rules, plugins, detection mechanisms, default actions and output settings are identified here. It is possible to have multiple configuration files for different purposes and cases but can only use one at runtime.
Note that every time you start the Snort, it will automatically show the default banner and initial information about your setup. You can prevent this by using the -q parameter.
| Parameter | Description |
|---|---|
| -V / --version | This parameter provides information about your instance version. |
| -c | Identifying the configuration file. |
| -T | Snort's self-test parameter, you can test your setup with this parameter. |
| -q | Quiet mode prevents Snort from displaying the default banner and initial information about your setup. |
Flag 1
Run the Snort instance and check the build number.
Flag 2
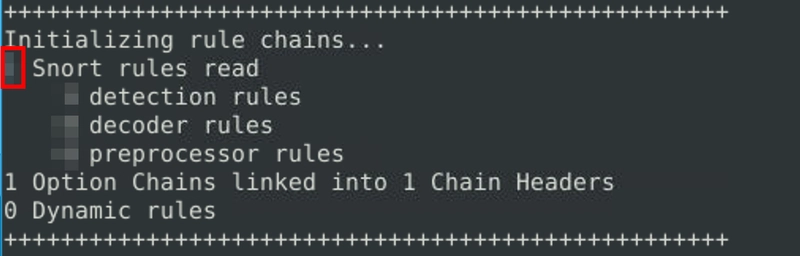
Examine the output after running sudo snort -c /etc/snort/snort.conf -T.
Flag 3
Examine the output after running sudo snort -c /etc/snort/snortv2.conf -T.
3. Operation Mode 1: Sniffer Mode
Like tcpdump, Snort has various flags capable of viewing various data about the packet it is ingesting.
Sniffer mode parameters are explained in the table below;
| Parameter | Description |
|---|---|
| -v | Verbose. Display the TCP/IP output in the console. |
| -d | Display the packet data (payload). |
| -e | Display the link-layer (TCP/IP/UDP/ICMP) headers. |
| -X | Display the full packet details in HEX. |
| -i | This parameter helps to define a specific network interface to listen/sniff. Once you have multiple interfaces, you can choose a specific interface to sniff. |
Sniffing with parameter "-i"
Start the Snort instance in verbose mode (-v) and use the interface (-i) "eth0"; sudo snort -v -i eth0
In case you have only one interface, Snort uses it by default. The above example demonstrates to sniff on the interface named "eth0". Once you simulate the parameter -v, you will notice it will automatically use the "eth0" interface and prompt it.
Sniffing with parameter "-v"
Start the Snort instance in verbose mode (-v); sudo snort -v
Now run the traffic-generator script as sudo and start ICMP/HTTP traffic. Once the traffic is generated, snort will start showing the packets in verbosity mode as follows.
user@ubuntu$ sudo snort -v

Running in packet dump mode

        --== Initializing Snort ==--
...
Commencing packet processing (pid=64)
12/01-20:10:13.846653 192.168.175.129:34316 -> 192.168.175.2:53
UDP TTL:64 TOS:0x0 ID:23826 IpLen:20 DgmLen:64 DF
Len: 36
=+=+=+=+=+=+=+=+=+=+=+=+=+=+=+=+=+=+=+=+=+=+=+=+=+=+=+=+=+=+=+=+=+=+=+=+=+

12/01-20:10:13.846794 192.168.175.129:38655 -> 192.168.175.2:53
UDP TTL:64 TOS:0x0 ID:23827 IpLen:20 DgmLen:64 DF
Len: 36
===============================================================================
Snort exiting
As you can see in the given output, verbosity mode provides tcpdump like output information. Once we interrupt the sniffing with CTRL+C, it stops and summarises the sniffed packets.
Sniffing with parameter "-d"
Start the Snort instance in dumping packet data mode (-d); sudo snort -d
Now run the traffic-generator script as sudo and start ICMP/HTTP traffic. Once the traffic is generated, snort will start showing the packets in verbosity mode as follows.
user@ubuntu$ sudo snort -d

Running in packet dump mode

        --== Initializing Snort ==--
...
Commencing packet processing (pid=67)

12/01-20:45:42.068675 192.168.175.129:37820 -> 192.168.175.2:53
UDP TTL:64 TOS:0x0 ID:53099 IpLen:20 DgmLen:56 DF
Len: 28
99 A5 01 00 00 01 00 00 00 00 00 00 06 67 6F 6F  .............goo
67 6C 65 03 63 6F 6D 00 00 1C 00 01              gle.com.....

=+=+=+=+=+=+=+=+=+=+=+=+=+=+=+=+=+=+=+=+=+=+=+=+=+=+=+=+=+=+=+=+=+=+=+=+=+

WARNING: No preprocessors configured for policy 0.
12/01-20:45:42.070742 192.168.175.2:53 -> 192.168.175.129:44947
UDP TTL:128 TOS:0x0 ID:63307 IpLen:20 DgmLen:72
Len: 44
FE 64 81 80 00 01 00 01 00 00 00 00 06 67 6F 6F  .d...........goo
67 6C 65 03 63 6F 6D 00 00 01 00 01 C0 0C 00 01  gle.com.........
00 01 00 00 00 05 00 04 D8 3A CE CE              .........:..

=+=+=+=+=+=+=+=+=+=+=+=+=+=+=+=+=+=+=+=+=+=+=+=+=+=+=+=+=+=+=+=+=+=+=+=+=+
As you can see in the given output, packet data payload mode covers the verbose mode and provides more data.
Sniffing with parameter "-de"
Start the Snort instance in dump (-d) and link-layer header grabbing (-e) mode; snort -d -e
Now run the traffic-generator script as sudo and start ICMP/HTTP traffic. Once the traffic is generated, snort will start showing the packets in verbosity mode as follows.
user@ubuntu$ sudo snort -de

Running in packet dump mode

        --== Initializing Snort ==--
...
Commencing packet processing (pid=70)
12/01-20:55:26.958773 00:0C:29:A5:B7:A2 -> 00:50:56:E1:9B:9D type:0x800 len:0x46
192.168.175.129:47395 -> 192.168.175.2:53 UDP TTL:64 TOS:0x0 ID:64294 IpLen:20 DgmLen:56 DF
Len: 28
6D 9C 01 00 00 01 00 00 00 00 00 00 06 67 6F 6F  m............goo
67 6C 65 03 63 6F 6D 00 00 01 00 01              gle.com.....

=+=+=+=+=+=+=+=+=+=+=+=+=+=+=+=+=+=+=+=+=+=+=+=+=+=+=+=+=+=+=+=+=+=+=+=+=+

WARNING: No preprocessors configured for policy 0.
12/01-20:55:26.965226 00:50:56:E1:9B:9D -> 00:0C:29:A5:B7:A2 type:0x800 len:0x56
192.168.175.2:53 -> 192.168.175.129:47395 UDP TTL:128 TOS:0x0 ID:63346 IpLen:20 DgmLen:72
Len: 44
6D 9C 81 80 00 01 00 01 00 00 00 00 06 67 6F 6F  m............goo
67 6C 65 03 63 6F 6D 00 00 01 00 01 C0 0C 00 01  gle.com.........
00 01 00 00 00 05 00 04 D8 3A D6 8E              .........:..
Sniffing with parameter "-X"
Start the Snort instance in full packet dump mode (-X); sudo snort -X
Now run the traffic-generator script as sudo and start ICMP/HTTP traffic. Once the traffic is generated, snort will start showing the packets in verbosity mode as follows.
user@ubuntu$ sudo snort -X

Running in packet dump mode

        --== Initializing Snort ==--
...
Commencing packet processing (pid=76)
WARNING: No preprocessors configured for policy 0.
12/01-21:07:56.806121 192.168.175.1:58626 -> 239.255.255.250:1900
UDP TTL:1 TOS:0x0 ID:48861 IpLen:20 DgmLen:196
Len: 168
0x0000: 01 00 5E 7F FF FA 00 50 56 C0 00 08 08 00 45 00  ..^....PV.....E.
0x0010: 00 C4 BE DD 00 00 01 11 9A A7 C0 A8 AF 01 EF FF  ................
0x0020: FF FA E5 02 07 6C 00 B0 85 AE 4D 2D 53 45 41 52  .....l....M-SEAR
0x0030: 43 48 20 2A 20 48 54 54 50 2F 31 2E 31 0D 0A 48  CH * HTTP/1.1..H
0x0040: 4F 53 54 3A 20 32 33 39 2E 32 35 35 2E 32 35 35  OST: 239.255.255
0x0050: 2E 32 35 30 3A 31 39 30 30 0D 0A 4D 41 4E 3A 20  .250:1900..MAN:
0x0060: 22 73 73 64 70 3A 64 69 73 63 6F 76 65 72 22 0D  "ssdp:discover".
0x0070: 0A 4D 58 3A 20 31 0D 0A 53 54 3A 20 75 72 6E 3A  .MX: 1..ST: urn:
0x0080: 64 69 61 6C 2D 6D 75 6C 74 69 73 63 72 65 65 6E  dial-multiscreen
0x0090: 2D 6F 72 67 3A 73 65 72 76 69 63 65 3A 64 69 61  -org:service:dia
0x00A0: 6C 3A 31 0D 0A 55 53 45 52 2D 41 47 45 4E 54 3A  l:1..USER-AGENT:
0x00B0: 20 43 68 72 6F 6D 69 75 6D 2F 39 35 2E 30 2E 34   Chromium/95.0.4
0x00C0: 36 33 38 2E 36 39 20 57 69 6E 64 6F 77 73 0D 0A  638.69 Windows..
0x00D0: 0D 0A                                            ..

=+=+=+=+=+=+=+=+=+=+=+=+=+=+=+=+=+=+=+=+=+=+=+=+=+=+=+=+=+=+=+=+=+=+=+=+=+

WARNING: No preprocessors configured for policy 0.
12/01-21:07:57.624205 216.58.214.142 -> 192.168.175.129
ICMP TTL:128 TOS:0x0 ID:63394 IpLen:20 DgmLen:84
Type:0  Code:0  ID:15  Seq:1  ECHO REPLY
0x0000: 00 0C 29 A5 B7 A2 00 50 56 E1 9B 9D 08 00 45 00  ..)....PV.....E.
0x0010: 00 54 F7 A2 00 00 80 01 24 13 D8 3A D6 8E C0 A8  .T......$..:....
0x0020: AF 81 00 00 BE B6 00 0F 00 01 2D E4 A7 61 00 00  ..........-..a..
0x0030: 00 00 A4 20 09 00 00 00 00 00 10 11 12 13 14 15  ... ............
0x0040: 16 17 18 19 1A 1B 1C 1D 1E 1F 20 21 22 23 24 25  .......... !"#$%
0x0050: 26 27 28 29 2A 2B 2C 2D 2E 2F 30 31 32 33 34 35  &'()*+,-./012345
0x0060: 36 37                                            67

=+=+=+=+=+=+=+=+=+=+=+=+=+=+=+=+=+=+=+=+=+=+=+=+=+=+=+=+=+=+=+=+=+=+=+=+=+
4. Operation Mode 2: Packet Logger Mode
You can use Snort as a sniffer and log the sniffed packets via logger mode. You only need to use the packet logger mode parameters, and Snort does the rest to accomplish this.
Packet logger parameters are explained in the table below;
| Parameter | Description |
|---|---|
| -l | Logger mode, target log and alert output directory. Default output folder is /var/log/snort. The default action is to dump as tcpdump format in /var/log/snort. |
| -K ASCII | Log packets in ASCII format. |
| -r | Reading option, read the dumped logs in Snort. |
| -n | Specify the number of packets that will process/read. Snort will stop after reading the specified number of packets. |
Logfile Ownership
Before generating logs and investigating them, we must remember the Linux file ownership and permissions. No need to deep dive into user types and permissions. The fundamental file ownership rule; whoever creates a file becomes the owner of the corresponding file.
Snort needs superuser (root) rights to sniff the traffic, so once you run the snort with the "sudo" command, the "root" account will own the generated log files. Therefore you will need "root" rights to investigate the log files. There are two different approaches to investigate the generated log files;
Elevation of privileges - You can elevate your privileges to examine the files. You can use the "sudo" command to execute your command as a superuser with the following command
sudo command. You can also elevate the session privileges and switch to the superuser account to examine the generated log files with the following command:sudo suChanging the ownership of files/directories - You can also change the ownership of the file/folder to read it as your user:
sudo chown username fileorsudo chown username -R directoryThe "-R" parameter helps recursively process the files and directories.
Logging with parameter "-l"
First, start the Snort instance in packet logger mode; sudo snort -dev -l .
Now start ICMP/HTTP traffic with the traffic-generator script.
Once the traffic is generated, Snort will start showing the packets and log them in the target directory. You can configure the default output directory in snort.config file. However, you can use the -l parameter to set a target directory. Identifying the default log directory is useful for continuous monitoring operations, and the -l parameter is much more useful for testing purposes.
The -l . part of the command creates the logs in the current directory.
user@ubuntu$ sudo snort -dev -l .

Running in packet logging mode

        --== Initializing Snort ==--
Initializing Output Plugins!
Log directory = /var/log/snort
pcap DAQ configured to passive.
Acquiring network traffic from "ens33".
Decoding Ethernet

        --== Initialization Complete ==--
...
Commencing packet processing (pid=2679)
WARNING: No preprocessors configured for policy 0.
WARNING: No preprocessors configured for policy 0.
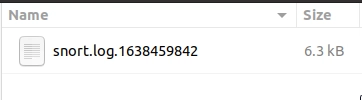
Now, let's check the generated log file.
As you can see, it is a single all-in-one log file. It is a binary/tcpdump format log. This is what it looks like in the folder view.
Logging with parameter "-K ASCII"
Start the Snort instance in packet logger mode; sudo snort -dev -K ASCII
Now run the traffic-generator script as sudo and start ICMP/HTTP traffic. Once the traffic is generated, Snort will start showing the packets in verbosity mode as follows.
user@ubuntu$ sudo snort -dev -K ASCII -l .

Running in packet logging mode

        --== Initializing Snort ==--
Initializing Output Plugins!
Log directory = /var/log/snort
pcap DAQ configured to passive.
Acquiring network traffic from "ens33".
Decoding Ethernet

        --== Initialization Complete ==--
...
Commencing packet processing (pid=2679)
WARNING: No preprocessors configured for policy 0.
WARNING: No preprocessors configured for policy 0.
Now, let's check the generated log file.
This is what it looks like in the folder view.
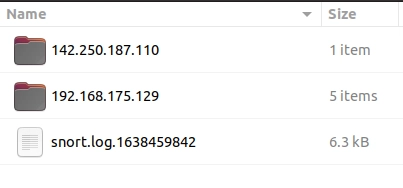
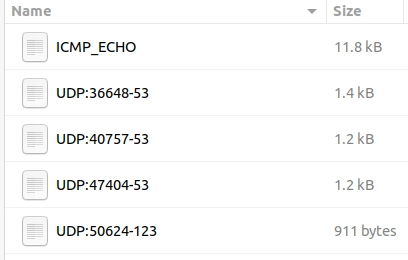
The logs created with -K ASCII parameter is entirely different. There are two folders with IP address names. Let's look into them.
Once we look closer at the created folders, we can see that the logs are in ASCII and categorised format, so it is possible to read them without using a Snort instance.
This is what it looks like in the folder view.
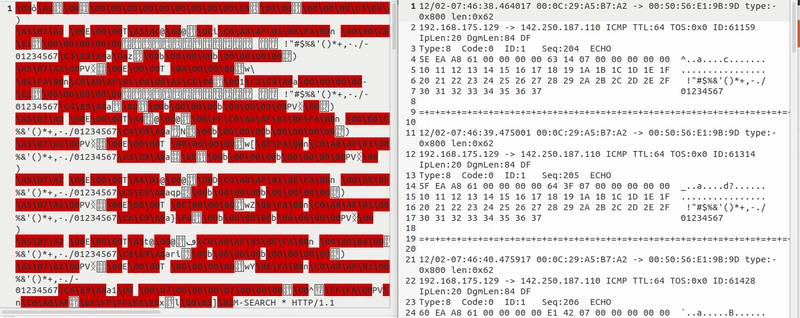
Let's compare the ASCII format with the binary format by opening both of them in a text editor. The difference between the binary log file and the ASCII log file is shown below. (Left side: binary format. Right side: ASCII format).
Reading generated logs with parameter "-r"
Start the Snort instance in packet reader mode; sudo snort -r
user@ubuntu$ sudo snort -r snort.log.1638459842
Running in packet dump mode
--== Initializing Snort ==--
Initializing Output Plugins!
pcap DAQ configured to read-file.
Acquiring network traffic from "snort.log.1638459842".
--== Initialization Complete ==--
...
Commencing packet processing (pid=3012)
WARNING: No preprocessors configured for policy 0.
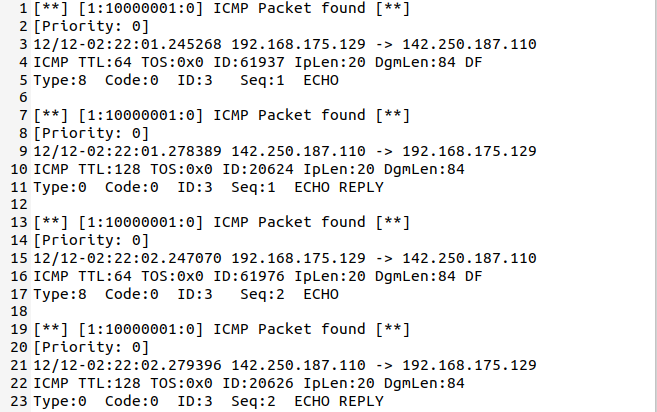
12/02-07:44:03.123225 192.168.175.129 -> 142.250.187.110
ICMP TTL:64 TOS:0x0 ID:41900 IpLen:20 DgmLen:84 DF
Type:8 Code:0 ID:1 Seq:49 ECHO
=+=+=+=+=+=+=+=+=+=+=+=+=+=+=+=+=+=+=+=+=+=+=+=+=+=+=+=+=+=+=+=+=+=+=+=+=+
WARNING: No preprocessors configured for policy 0.
12/02-07:44:26.169620 192.168.175.129 -> 142.250.187.110
ICMP TTL:64 TOS:0x0 ID:44765 IpLen:20 DgmLen:84 DF
Type:8 Code:0 ID:1 Seq:72 ECHO
===============================================================================
Packet I/O Totals:
Received: 51
Analyzed: 51 (100.000%)
Dropped: 0 ( 0.000%)
Filtered: 0 ( 0.000%)
Outstanding: 0 ( 0.000%)
Injected: 0
===============================================================================
Breakdown by protocol (includes rebuilt packets):
...
Total: 51
===============================================================================
Snort exiting
Read with tcpdump sudo tcpdump -r snort.log.1638459842 -ntc 10
-r parameter also allows users to filter the binary log files. You can filter the processed log to see specific packets with the -r parameter and Berkeley Packet Filters (BPF).
-
sudo snort -r logname.log -X -
sudo snort -r logname.log icmp -
sudo snort -r logname.log tcp -
sudo snort -r logname.log 'udp and port 53'
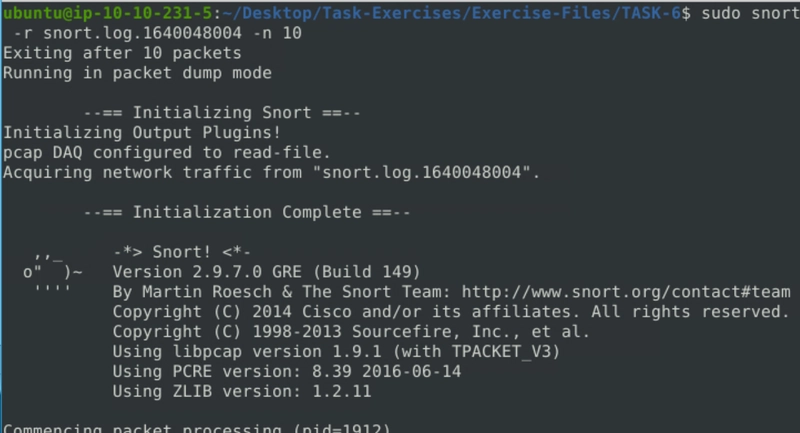
The output will be the same as the above, but only packets with the chosen protocol will be shown. Additionally, you can specify the number of processes with the parameter -n. The following command will process only the first 10 packets:
snort -dvr logname.log -n 10
Use the following resources to understand how the BPF works and its use.
- https://en.wikipedia.org/wiki/Berkeley_Packet_Filter
- https://biot.com/capstats/bpf.html
- https://www.tcpdump.org/manpages/tcpdump.1.html
Flag 1
Now, you should have the logs in the current directory. Navigate to folder "145.254.160.237". What is the source port used to connect port 53?
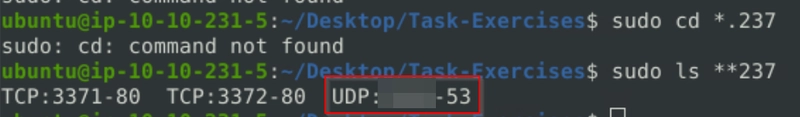
The error sudo: cd: command not found happens because cd is a shell built-in command, not a standalone executable. The sudo command is used to run programs with elevated privileges, but it only works with standalone executables, not shell built-ins.
Flag 2
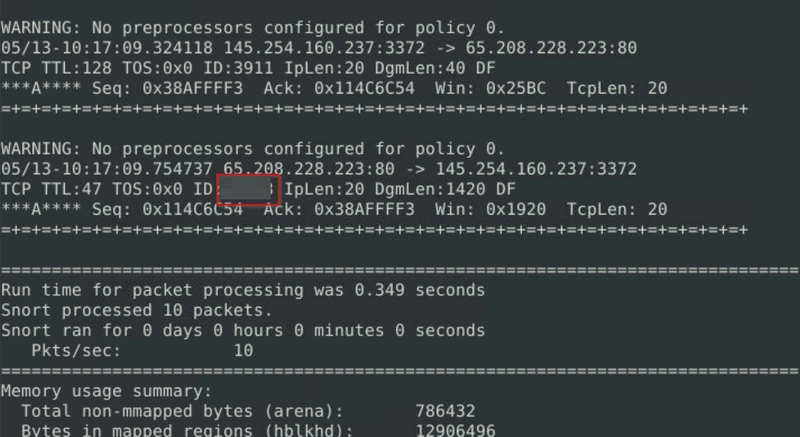
Scroll down for the last packet's details.
Flag 3
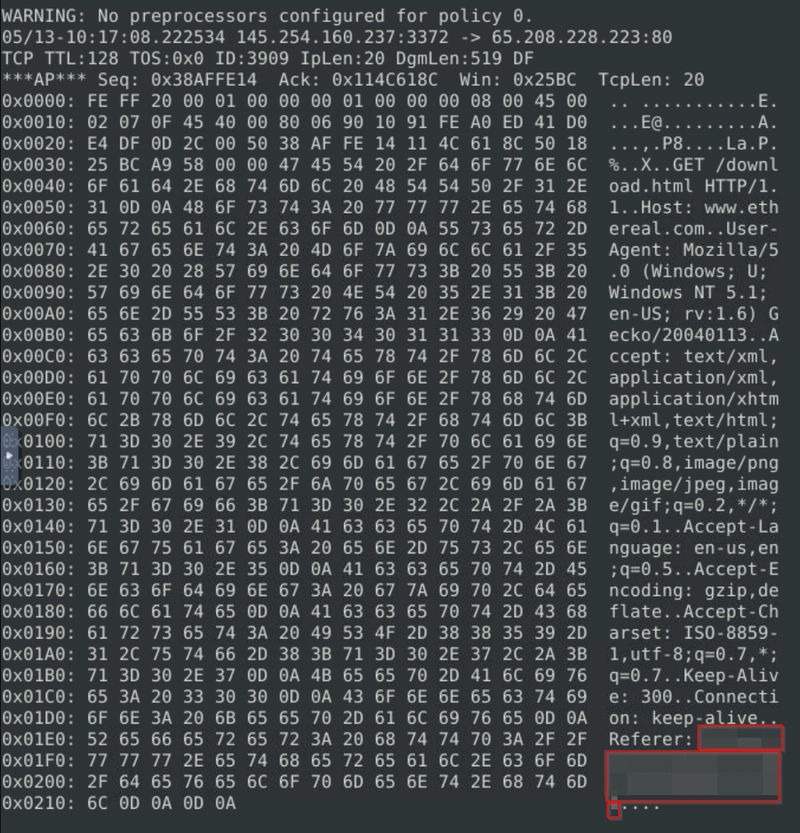
We add -X parameter to display full packet content.
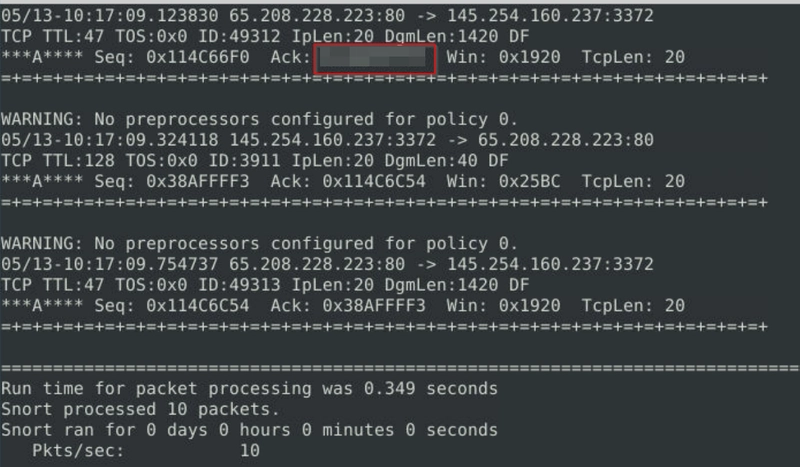
snort -Xr snort.log.1640048004 -n 4
Flag 4
Run snort -r snort.log.1640048004 -n 8
Flag 5
Run snort -r snort.log.1640048004 to display all packets.
5. Operation Mode 3: IDS IPS
Snort in IDS/IPS Mode
Capabilities of Snort are not limited to sniffing and logging the traffic. IDS/IPS mode helps you manage the traffic according to user-defined rules.
NIDS mode parameters:
| Parameter | Description |
|---|---|
-c |
Defining the configuration file. |
-T |
Testing the configuration file. |
-N |
Disable logging. |
-D |
Background mode. |
-A |
Alert modes; |
full: Full alert mode, providing all possible information about the alert. This one also is the default mode; once you use -A and don't specify any mode, Snort uses this mode. |
|
| fast: Fast mode shows the alert message, timestamp, source and destination IP, along with port numbers. | |
| console: Provides fast style alerts on the console screen. | |
| cmg: CMG style, basic header details with payload in hex and text format. | |
| none: Disabling alerting. |
Once you start running IDS/IPS mode, you need to use rules. As we mentioned earlier, we will use a pre-defined ICMP rule as an example. The defined rule will only generate alerts in any direction of ICMP packet activity.
alert icmp any any <> any any (msg: "ICMP Packet Found"; sid: 100001; rev:1;)
This rule is located in "/etc/snort/rules/local.rules".
Remember, in this module, we will focus only on the operating modes. The rules are covered in TASK9&10. **Snort will create an "alert" file if the traffic flow triggers an alert. ** **One last note; **once you start running IPS/IDS mode, the sniffing and logging mode will be semi-passive. However, you can activate the functions using the parameters discussed in previous tasks. **(-i, -v, -d, -e, -X, -l, -K ASCII) **If you don't remember the purpose of these commands, please revisit TASK4.
IDS/IPS mode with parameter "-c and -T"
Start the Snort instance and test the configuration file. sudo snort -c /etc/snort/snort.conf -T This command will check your configuration file and prompt it if there is any misconfiguratioın in your current setting. You should be familiar with this command if you covered TASK3. If you don't remember the output of this command, please revisit TASK4.
IDS/IPS mode with parameter "-N"
Start the Snort instance and disable logging by running the following command: sudo snort -c /etc/snort/snort.conf -N
Now run the traffic-generator script as sudo and start ICMP/HTTP traffic. This command will disable logging mode. The rest of the other functions will still be available (if activated).
The command-line output will provide the information requested with the parameters. So, if you activate verbosity (-v) or full packet dump (-X) you will still have the output in the console, but there will be no logs in the log folder.
IDS/IPS mode with parameter "-D"
Start the Snort instance in background mode with the following command: sudo snort -c /etc/snort/snort.conf -D
Now run the traffic-generator script as sudo and start ICMP/HTTP traffic. Once the traffic is generated, snort will start processing the packets and accomplish the given task with additional parameters.
user@ubuntu$ sudo snort -c /etc/snort/snort.conf -D

Spawning daemon child...
My daemon child 2898 lives...
Daemon parent exiting (0)
The command-line output will provide the information requested with the parameters. So, if you activate verbosity (-v) or full packet dump (-X) with packet logger mode (-l) you will still have the logs in the logs folder, but there will be no output in the console.
Once you start the background mode and want to check the corresponding process, you can easily use the ps command as shown below;
user@ubuntu$ ps -ef | grep snort

root        2898    1706  0 05:53 ?        00:00:00 snort -c /etc/snort/snort.conf -D
Can run kill to stop process, such as sudo kill -9 2898.
Note that daemon mode is mainly used to automate the Snort. This parameter is mainly used in scripts to start the Snort service in the background. It is not recommended to use this mode unless you have a working knowledge of Snort and stable configuration.
IDS/IPS mode with parameter "-A"
Remember that there are several alert modes available in snort;
- console: Provides fast style alerts on the console screen.
- cmg: Provides basic header details with payload in hex and text format.
- full: Full alert mode, providing all possible information about the alert.
- fast: Fast mode, shows the alert message, timestamp, source and destination ıp along with port numbers.
- none: Disabling alerting.
In this section, only the console and cmg parameters provide alert information in the console. It is impossible to identify the difference between the rest of the alert modes via terminal. Differences can be identified by looking at generated logs.
Generally console mode provides basic header and rule information. Cmg mode provides full packet details along with rule information.
Running console mode for example: sudo snort -c /etc/snort/snort.conf -A console
Let's check the alarm file after running fast mode.
As you can see in the given picture above, fast style alerts contain summary information on the action like direction and alert header.
Let's check the alarm file after running full mode.
As you can see in the given picture above, full style alerts contain all possible information on the action.
IDS/IPS mode: "Using rule file without configuration file"
It is possible to run the Snort only with rules without a configuration file. Running the Snort in this mode will help you test the user-created rules. However, this mode will provide less performance.
IPS mode and dropping packets
Snort IPS mode activated with -Q --daq afpacket parameters. You can also activate this mode by editing snort.conf file. However, you don't need to edit snort.conf file in the scope of this room. Review the bonus task or snort manual for further information on daq and advanced configuration settings: -Q --daq afpacket
Activate the Data Acquisition (DAQ) modules and use the afpacket module to use snort as an IPS: -i eth0:eth1
Identifying interfaces note that Snort IPS require at least two interfaces to work. Now run the traffic-generator script as sudo and start ICMP/HTTP traffic.
user@ubuntu$ sudo snort -c /etc/snort/snort.conf -q -Q --daq afpacket -i eth0:eth1 -A console
Running in IPS mode

12/18-07:40:01.527100  [Drop] [**] [1:1000001:0] ICMP Packet found [**] [Priority: 0] {ICMP} 192.168.175.131 -> 192.168.175.2
12/18-07:40:01.552811  [Drop] [**] [1:1000001:0] ICMP Packet found [**] [Priority: 0] {ICMP} 172.217.169.142 -> 192.168.1.18
12/18-07:40:01.566232  [Drop] [**] [1:1000001:0] ICMP Packet found [**] [Priority: 0] {ICMP} 192.168.175.131 -> 192.168.175.2
12/18-07:40:02.517903  [Drop] [**] [1:1000001:0] ICMP Packet found [**] [Priority: 0] {ICMP} 192.168.1.18 -> 172.217.169.142
12/18-07:40:02.550844  [Drop] [**] [1:1000001:0] ICMP Packet found [**] [Priority: 0] {ICMP} 172.217.169.142 -> 192.168.1.18
^C*** Caught Int-Signal
Flag 1
6. Operation Mode 4: PCAP Investigation
Reading a pcap without using any additional parameters we discussed before will only overview the packets and provide statistics about the file. In most cases, this is not very handy. We are investigating the pcap with Snort to benefit from the rules and speed up our investigation process by using the known patterns of threats.
PCAP mode parameters are explained in the table below.
| Parameter | Description |
|---|---|
-r / --pcap-single=
|
Read a single pcap. |
--pcap-list="" |
Read pcaps provided in command (space separated). |
--pcap-show |
Show pcap name on console during processing. |
Investigating single PCAP with parameter "-r"
For test purposes, you can still test the default reading option with pcap by using the following command snort -r icmp-test.pcap
Let's investigate the pcap with our configuration file and see what will happen. sudo snort -c /etc/snort/snort.conf -q -r icmp-test.pcap -A console -n 10
user@ubuntu$ sudo snort -c /etc/snort/snort.conf -q -r icmp-test.pcap -A console -n 10
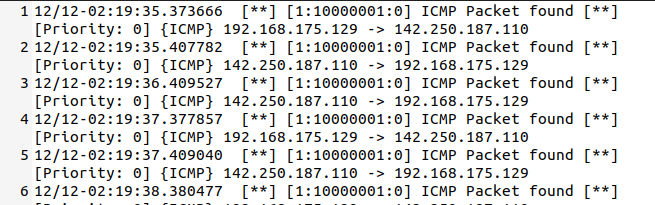
12/12-12:13:29.167955 [**] [1:10000001:0] ICMP Packet found [**] [Priority: 0] {ICMP} 192.168.175.129 -> 142.250.187.110
12/12-12:13:29.200543 [**] [1:10000001:0] ICMP Packet found [**] [Priority: 0] {ICMP} 142.250.187.110 -> 192.168.175.129
12/12-12:13:30.169785 [**] [1:10000001:0] ICMP Packet found [**] [Priority: 0] {ICMP} 192.168.175.129 -> 142.250.187.110
12/12-12:13:30.201470 [**] [1:10000001:0] ICMP Packet found [**] [Priority: 0] {ICMP} 142.250.187.110 -> 192.168.175.129
12/12-12:13:31.172101 [**] [1:10000001:0] ICMP Packet found [**] [Priority: 0] {ICMP} 192.168.175.129 -> 142.250.187.110
12/12-12:13:31.204104 [**] [1:10000001:0] ICMP Packet found [**] [Priority: 0] {ICMP} 142.250.187.110 -> 192.168.175.129
12/12-12:13:32.174106 [**] [1:10000001:0] ICMP Packet found [**] [Priority: 0] {ICMP} 192.168.175.129 -> 142.250.187.110
12/12-12:13:32.208683 [**] [1:10000001:0] ICMP Packet found [**] [Priority: 0] {ICMP} 142.250.187.110 -> 192.168.175.129
12/12-12:13:33.176920 [**] [1:10000001:0] ICMP Packet found [**] [Priority: 0] {ICMP} 192.168.175.129 -> 142.250.187.110
12/12-12:13:33.208359 [**] [1:10000001:0] ICMP Packet found [**] [Priority: 0] {ICMP} 142.250.187.110 -> 192.168.175.129
Our ICMP rule got a hit! As you can see in the given output, snort identified the traffic and prompted the alerts according to our ruleset.
Investigating multiple PCAPs with parameter "--pcap-list"
Let's investigate multiple pcaps with our configuration file and see what will happen. sudo snort -c /etc/snort/snort.conf -q --pcap-list="icmp-test.pcap http2.pcap" -A console -n 10
user@ubuntu$ sudo snort -c /etc/snort/snort.conf -q --pcap-list="icmp-test.pcap http2.pcap" -A console

12/12-12:13:29.167955  [**] [1:10000001:0] ICMP Packet found [**] [Priority: 0] {ICMP} 192.168.175.129 -> 142.250.187.110
12/12-12:13:29.200543  [**] [1:10000001:0] ICMP Packet found [**] [Priority: 0] {ICMP} 142.250.187.110 -> 192.168.175.129
12/12-12:13:30.169785  [**] [1:10000001:0] ICMP Packet found [**] [Priority: 0] {ICMP} 192.168.175.129 -> 142.250.187.110
12/12-12:13:30.201470  [**] [1:10000001:0] ICMP Packet found [**] [Priority: 0] {ICMP} 142.250.187.110 -> 192.168.175.129
12/12-12:13:31.172101  [**] [1:10000001:0] ICMP Packet found [**] [Priority: 0] {ICMP} 192.168.175.129 -> 142.250.187.110
...
12/12-12:13:31.204104  [**] [1:10000001:0] ICMP Packet found [**] [Priority: 0] {ICMP} 142.250.187.110 -> 192.168.175.129
12/12-12:13:32.174106  [**] [1:10000001:0] ICMP Packet found [**] [Priority: 0] {ICMP} 192.168.175.129 -> 142.250.187.110
12/12-12:13:32.208683  [**] [1:10000001:0] ICMP Packet found [**] [Priority: 0] {ICMP} 142.250.187.110 -> 192.168.175.129
12/12-12:13:33.176920  [**] [1:10000001:0] ICMP Packet found [**] [Priority: 0] {ICMP} 192.168.175.129 -> 142.250.187.110
12/12-12:13:33.208359  [**] [1:10000001:0] ICMP Packet found [**] [Priority: 0] {ICMP} 142.250.187.110 -> 192.168.175.129
Our ICMP rule got a hit! As you can see in the given output, snort identified the traffic and prompted the alerts according to our ruleset.
Investigating multiple PCAPs with parameter "--pcap-show"
Let's investigate multiple pcaps, distinguish each one, and see what will happen. sudo snort -c /etc/snort/snort.conf -q --pcap-list="icmp-test.pcap http2.pcap" -A console --pcap-show
user@ubuntu$ sudo snort -c /etc/snort/snort.conf -q --pcap-list="icmp-test.pcap http2.pcap" -A console --pcap-show

Reading network traffic from "icmp-test.pcap" with snaplen = 1514
12/12-12:13:29.167955  [**] [1:10000001:0] ICMP Packet found [**] [Priority: 0] {ICMP} 192.168.175.129 -> 142.250.187.110
12/12-12:13:29.200543  [**] [1:10000001:0] ICMP Packet found [**] [Priority: 0] {ICMP} 142.250.187.110 -> 192.168.175.129
12/12-12:13:30.169785  [**] [1:10000001:0] ICMP Packet found [**] [Priority: 0] {ICMP} 192.168.175.129 -> 142.250.187.110
...

Reading network traffic from "http2.pcap" with snaplen = 1514
12/12-12:13:35.213176  [**] [1:10000001:0] ICMP Packet found [**] [Priority: 0] {ICMP} 142.250.187.110 -> 192.168.175.129
12/12-12:13:36.182950  [**] [1:10000001:0] ICMP Packet found [**] [Priority: 0] {ICMP} 192.168.175.129 -> 142.250.187.110
12/12-12:13:38.223470  [**] [1:10000001:0] ICMP Packet found [**] [Priority: 0] {ICMP} 142.250.187.110 -> 192.168.175.129
...
Our ICMP rule got a hit! As you can see in the given output, snort identified the traffic, distinguished each pcap file and prompted the alerts according to our ruleset.
Flag 1
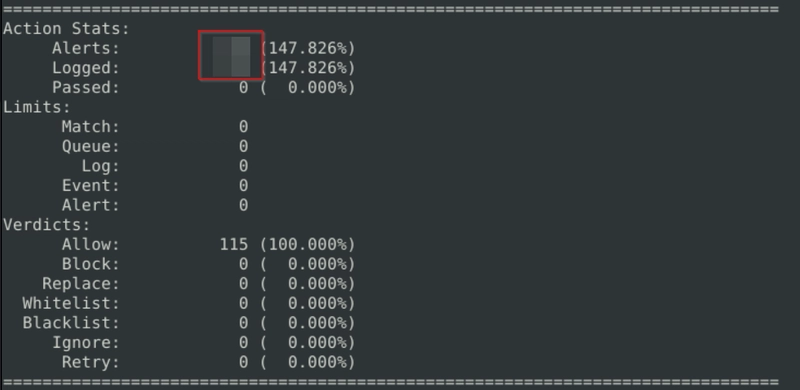
Investigate the mx-1.pcap file with the default configuration file.
sudo snort -c /etc/snort/snort.conf -A full -l . -r mx-1.pcap
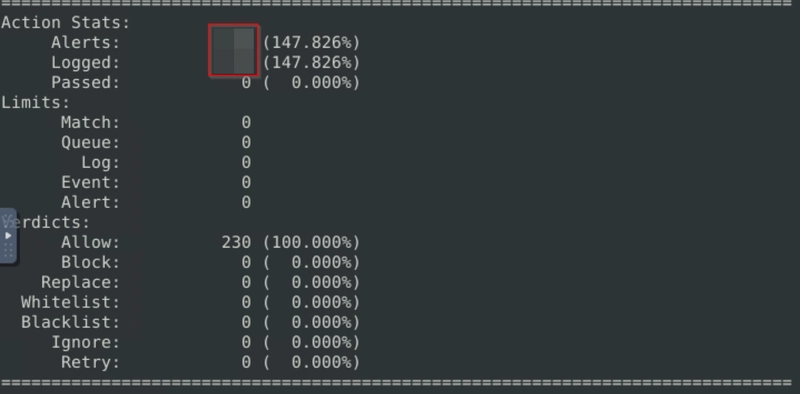
What is the number of the generated alerts?
Flag 2
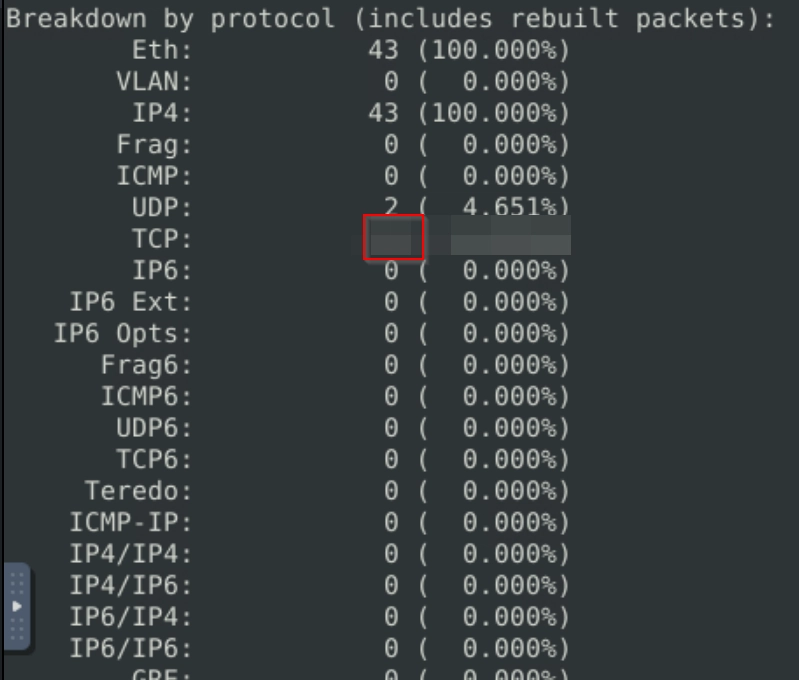
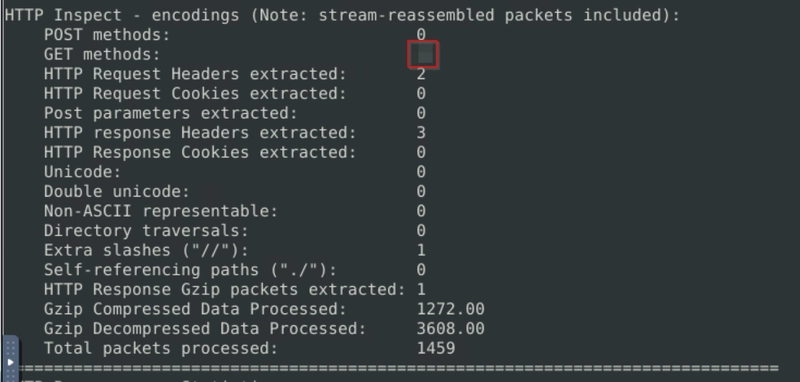
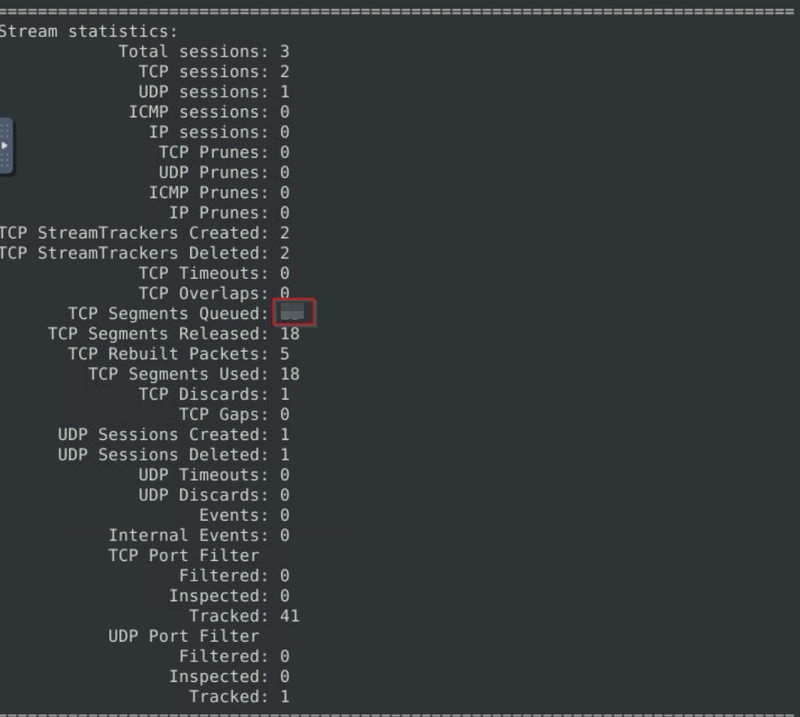
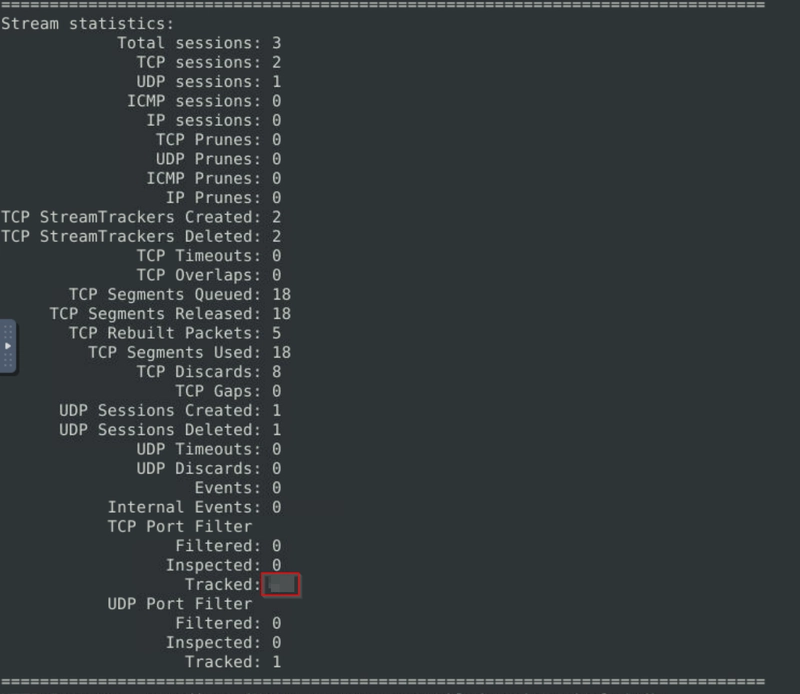
Keep reading the output. How many TCP Segments are Queued?
Flag 3
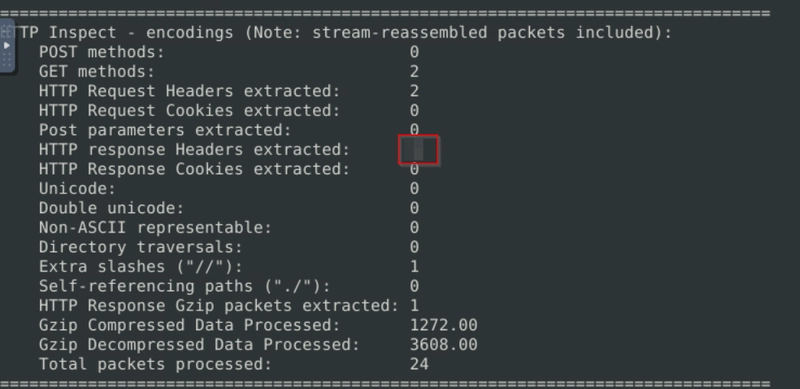
Keep reading the output.How many "HTTP response headers" were extracted?
Flag 4
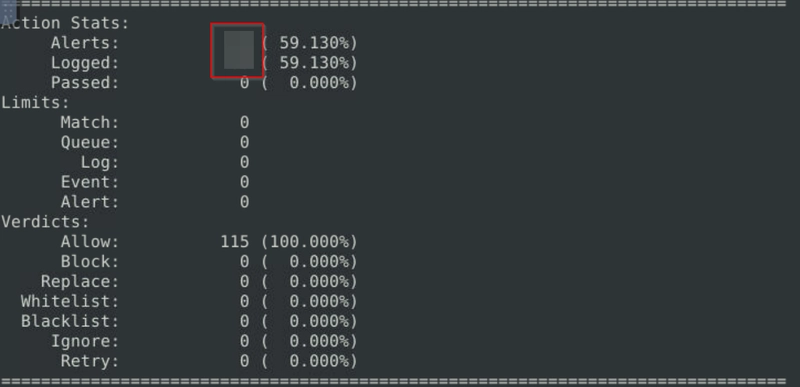
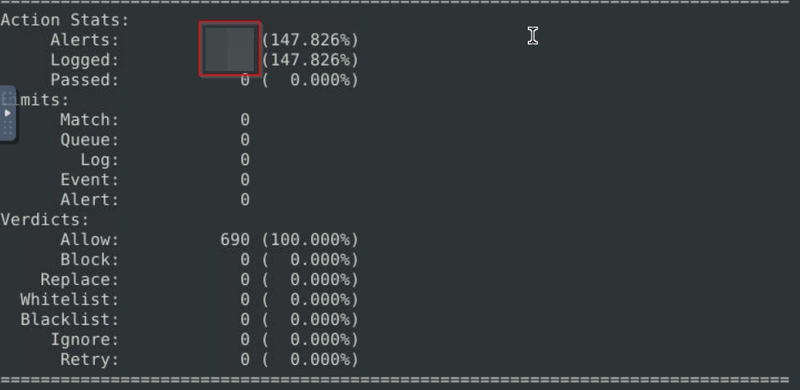
Investigate the mx-2.pcap file with the default configuration file.
sudo snort -c /etc/snort/snort.conf -A full -l . -r mx-2.pcap
What is the number of the generated alerts?
Flag 5
Investigate the mx-2.pcap file with the default configuration file.
sudo snort -c /etc/snort/snort.conf -A full -l . -r mx-2.pcap
What is the number of the generated alerts?
Flag 6
Keep reading the output. What is the number of the detected TCP packets?
Flag 7
Investigate the mx-2.pcap and mx-3.pcap files with the default configuration file.
sudo snort -c /etc/snort/snort.conf -A full -l . --pcap-list="mx-2.pcap mx-3.pcap"
What is the number of the generated alerts?
- Snort Rule Structure
Each rule should have a type of action, protocol, source and destination IP, source and destination port and an option. Remember, Snort is in passive mode by default. So most of the time, you will use Snort as an IDS. You will need to start "inline mode" to turn on IPS mode. But before you start playing with inline mode, you should be familiar with Snort features and rules.
The Snort rule structure is easy to understand but difficult to produce. You should be familiar with rule options and related details to create efficient rules. It is recommended to practice Snort rules and option details for different use cases.
Rules cannot be processed without a header. Rule options are "optional" parts. However, it is almost impossible to detect sophisticated attacks without using the rule options.
Action
| Action | Description | Additional Information |
|---|---|---|
alert |
Generate an alert and log the packet. | Commonly used for monitoring and forensic analysis. |
log |
Log the packet. | Does not generate an alert but stores the packet details. |
drop |
Block and log the packet. | The packet is silently discarded without notifying the sender, causing timeouts. Useful for stealthy blocking. |
reject |
Block the packet, log it, and terminate the session. | Unlike drop, this sends a TCP RST (for TCP) or ICMP Unreachable (for ICMP), informing the sender that the traffic is blocked. |
Protocol
| Protocol | Description | Additional Information |
|---|---|---|
IP |
Internet Protocol. Used for filtering at the network layer. | Can be used for general IP-based filtering but lacks granularity. |
TCP |
Transmission Control Protocol. Used for connection-based filtering. | Supports filtering based on ports and flags (e.g., SYN, ACK). |
UDP |
User Datagram Protocol. Used for filtering stateless traffic. | Typically used for DNS, VoIP, and streaming services. |
ICMP |
Internet Control Message Protocol. Used for network diagnostics. | Used to filter ping (echo request) or other ICMP messages. |
| Application Filtering | Detects application flows indirectly using ports and options. | Snort does not support direct application protocol filtering but can detect application traffic based on port numbers (e.g., FTP on TCP/21). |
IP Filtering
| Rule | Description |
|---|---|
alert icmp 192.168.1.56 any <> any any (msg: "ICMP Packet From"; sid: 100001; rev:1;) |
Creates an alert for each ICMP packet originating from the 192.168.1.56 IP address. |
alert icmp 192.168.1.0/24 any <> any any (msg: "ICMP Packet Found"; sid: 100001; rev:1;) |
Creates an alert for each ICMP packet originating from the 192.168.1.0/24 subnet. |
alert icmp [192.168.1.0/24, 10.1.1.0/24] any <> any any (msg: "ICMP Packet Found"; sid: 100001; rev:1;) |
Creates an alert for each ICMP packet originating from 192.168.1.0/24 and 10.1.1.0/24 subnets. |
alert icmp !192.168.1.0/24 any <> any any (msg: "ICMP Packet Found"; sid: 100001; rev:1;) |
Creates an alert for each ICMP packet not originating from the 192.168.1.0/24 subnet. |
Port Filtering
| Rule | Description |
|---|---|
alert tcp any any <> any 21 (msg: "FTP Port 21 Command Activity Detected"; sid: 100001; rev:1;) |
Creates an alert for each TCP packet sent to port 21 (FTP). |
alert tcp any any <> any !21 (msg: "Traffic Activity Without FTP Port 21 Command Channel"; sid: 100001; rev:1;) |
Creates an alert for each TCP packet not sent to port 21. |
alert tcp any any <> any 1:1024 (msg: "TCP 1-1024 System Port Activity"; sid: 100001; rev:1;) |
Creates an alert for each TCP packet sent to ports 1-1024. |
alert tcp any any <> any :1024 (msg: "TCP 0-1024 System Port Activity"; sid: 100001; rev:1;) |
Creates an alert for each TCP packet sent to ports ≤1024. |
alert tcp any any <> any 1025: (msg: "TCP Non-System Port Activity"; sid: 100001; rev:1;) |
Creates an alert for each TCP packet sent to ports ≥1025. |
alert tcp any any <> any [21,23] (msg: "FTP and Telnet Port 21-23 Activity Detected"; sid: 100001; rev:1;) |
Creates an alert for each TCP packet sent to ports 21 and 23 (FTP & Telnet). |
Direction
The direction operator indicates the traffic flow to be filtered by Snort. The left side of the rule shows the source, and the right side shows the destination.
- -> Source to destination flow.
- <>; Bidirectional flow
Note that there is no "<-" operator in Snort.
There are three main rule options in Snort;
- General Rule Options - Fundamental rule options for Snort.
- Payload Rule Options - Rule options that help to investigate the payload data. These options are helpful to detect specific payload patterns.
- Non-Payload Rule Options - Rule options that focus on non-payload data. These options will help create specific patterns and identify network issues.
| Field | Description |
|---|---|
msg |
The message field is a basic prompt and quick identifier of the rule. When the rule is triggered, this message appears in the console or log. Typically, it is a short summary of the event. |
sid |
Snort Rule ID (SID) is a unique identifier for each rule. SIDs have three scopes: |
| <100 → Reserved rules. | |
| 100-999,999 → Rules included with Snort. | |
| ≥1,000,000 → Custom user-created rules. | |
Each rule must have a unique SID, and custom rules should use a SID greater than 1,000,000. |
|
reference |
Provides additional information about the rule, such as links to external threat intelligence or CVE IDs (Common Vulnerabilities and Exposures). This helps analysts during investigations. |
rev |
Tracks rule revisions. Each rule has a unique rev number to indicate how many times it has been updated. Snort does not automatically keep a rule history, so analysts should maintain it manually. |
Example Snort Rule
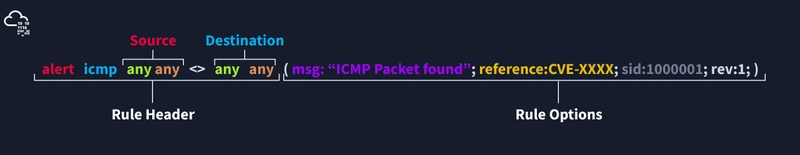
alert icmp any any <> any any (msg: "ICMP Packet Found"; sid: 100001; reference:cve,CVE-XXXX; rev:1;)
Payload Detection Rule Options
| Option | Description |
|---|---|
content |
Payload data. Matches specific payload data in ASCII, HEX, or both. Multiple content options can be used in a single rule, but more patterns increase processing time. Case-sensitive by default.
|
nocase |
Disables case sensitivity for content searches, allowing matches regardless of uppercase/lowercase letters. |
fast_pattern |
Prioritizes a specific content match to speed up packet inspection. Used when multiple content options exist. Case-insensitive by default and can only be used once per rule.
|
Examples
1. Content Matching (Case-Sensitive by Default)
- ASCII Mode:
alert tcp any any <> any 80 (msg: "GET Request Found"; content:"GET"; sid:100001; rev:1;)
- Hex Mode:
HEX mode - alert tcp any any <> any 80 (msg: "GET Request Found"; content:"|47 45 54|"; sid: 100001; rev:1;)
Non-Payload Detection Rule Options
These rule options focus on non-payload data, helping to create specific patterns and identify network issues.
| Option | Description |
|---|---|
id |
Filters packets based on the IP ID field. |
flags |
Filters packets based on TCP flags such as SYN, ACK, FIN, etc. |
dsize |
Filters packets based on payload size. Can specify an exact size, a range, or use < and > operators. |
sameip |
Detects if the source and destination IP addresses are identical (self-communication). |
Flag Reference Table
| Flag | Description |
|---|---|
| F | FIN - Connection termination. |
| S | SYN - Connection initiation. |
| R | RST - Connection reset. |
| P | PSH - Push function. |
| A | ACK - Acknowledgment. |
| U | URG - Urgent pointer. |
Examples
1. IP ID Filtering
alert tcp any any <> any any (msg: "ID TEST"; id:123456; sid: 100001; rev:1;)
Snort Rules All Options
| Option | Description | Example |
|---|---|---|
msg |
Message field that appears in alerts/logs. Used to describe the rule. | msg: "ICMP Packet Found"; |
sid |
Unique Snort Rule ID. User-defined SIDs should be ≥1,000,000. |
sid: 100001; |
reference |
Provides external references (e.g., CVE IDs). | reference:cve,CVE-XXXX; |
rev |
Tracks rule revisions. No auto-backup, must be managed manually. | rev:1; |
content |
Matches specific payload data (ASCII/HEX). Case-sensitive by default. | content:"GET"; |
nocase |
Disables case sensitivity for content matching. |
content:"GET"; nocase; |
fast_pattern |
Prioritizes content matching for efficiency. Used when multiple content options exist. |
content:"GET"; fast_pattern; content:"www"; |
id |
Filters packets based on the IP ID field. | id:123456; |
flags |
Filters packets based on TCP flags (SYN, ACK, FIN, etc.). | flags:S; |
dsize |
Filters packets based on payload size. Supports ranges (min<>max), <, >. |
dsize:100<>300; |
sameip |
Detects if source and destination IPs are identical. | sameip; |
Flag Reference Table
| Flag | Description |
|---|---|
| F | FIN - Connection termination. |
| S | SYN - Connection initiation. |
| R | RST - Connection reset. |
| P | PSH - Push function. |
| A | ACK - Acknowledgment. |
| U | URG - Urgent pointer. |
Example Snort Rules
1. Detect "GET" Requests (Case-Sensitive)
alert tcp any any <> any 80 (msg: "GET Request Found"; content:"GET"; sid:100001; rev:1;)
Remember, once you create a rule, it is a local rule and should be in your local.rules file. This file is located under /etc/snort/rules/local.rules. A quick reminder on how to edit your local rules is shown below.
sudo gedit /etc/snort/rules/local.rules
Snort manual for more information.
Flag 1
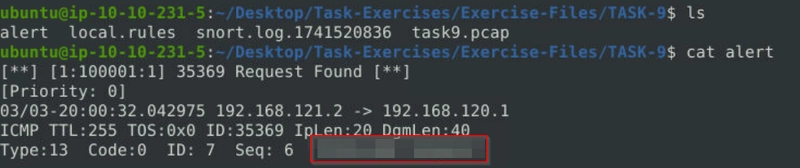
Use "task9.pcap". Write a rule to filter IP ID "35369" and run it against the given pcap file. What is the request name of the detected packet? You may use this command: "snort -c local.rules -A full -l . -r task9.pcap"
nano local.rules
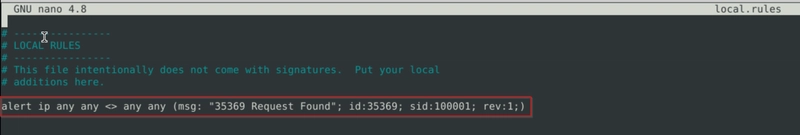
snort -c local.rules -A full -l . -r task9.pcap
A file names alert should be created in the same directory. cat it and we get the flag.
Flag 2
Clear the previous alert file and comment out the old rules. Create a rule to filter packets with Syn flag and run it against the given pcap file. What is the number of detected packets?
Comment out old rule and add a new one.
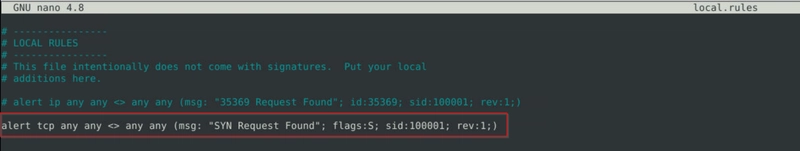
snort -c local.rules -A full -l . -r task9.pcap
Read the file alert, and the number of entries of SYN requests will be the flag.
Flag 3
Clear the previous alert file and comment out the old rules. Write a rule to filter packets with Push-Ack flags and run it against the given pcap file. What is the number of detected packets?
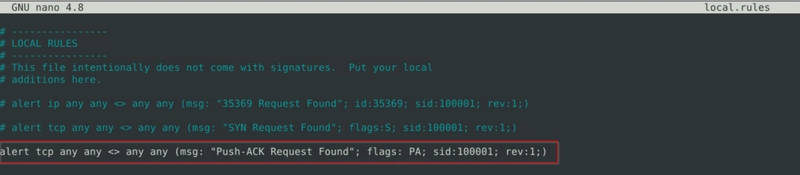
grep -o "Push-ACK" alert | wc -l
This command counts the number of the string "Push-ACK" in the file alert.
![]()
Flag 4
Clear the previous alert file and comment out the old rules. Create a rule to filter UDP packets with the same source and destination IP and run it against the given pcap file. What is the number of packets that show the same source and destination address?
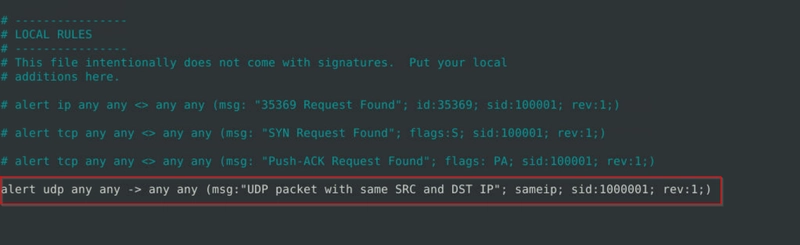
Count the number of UDP entries with same IP.
![]()
Flag 5
Case Example - An analyst modified an existing rule successfully. Which rule option must the analyst change after the implementation?
rev
8. Snort2 Operation Logic: Points to Remember
Points to Remember
**Main **Components of Snort
- **Packet Decoder - **Packet collector component of Snort. It collects and prepares the packets for pre-processing.
- **Pre-processors - **A component that arranges and modifies the packets for the detection engine.
- **Detection Engine - **The primary component that process, dissect and analyse the packets by applying the rules.
- Logging and Alerting - Log and alert generation component.
- Outputs and Plugins - Output integration modules (i.e. alerts to syslog/mysql) and additional plugin (rule management detection plugins) support is done with this component.
There are three types of rules available for snort
- Community Rules - Free ruleset under the GPLv2. Publicly accessible, no need for registration.
- Registered Rules - Free ruleset (requires registration). This ruleset contains subscriber rules with 30 days delay.
- Subscriber Rules (Paid) - Paid ruleset (requires subscription). This ruleset is the main ruleset and is updated twice a week (Tuesdays and Thursdays).
You can download and read more on the rules here.
**Note: **Once you install Snort2, it automatically creates the required directories and files. However, if you want to use the community or the paid rules, you need to indicate each rule in the snort.conf file.
Since it is a long, all-in-one configuration file, editing it without causing misconfiguration is troublesome for some users. **That is why Snort has several rule updating modules and integration tools. **To sum up, never replace your configured Snort configuration files; you must edit your configuration files manually or update your rules with additional tools and modules to not face any fail/crash or lack of feature.
- snort.conf: Main configuration file.
- local.rules: User-generated rules file.
*Let's start with overviewing the main configuration file (snort.conf) *sudo gedit /etc/snort/snort.conf
Navigate to the "Step #1: Set the network variables." section.
This section manages the scope of the detection and rule paths.
| TAG NAME | INFO | EXAMPLE |
|---|---|---|
| HOME_NET | That is where we are protecting. |
any OR 192.168.1.1/24
|
| EXTERNAL_NET | External network, usually set as 'any' or '!$HOME_NET'. |
any OR !$HOME_NET
|
| RULE_PATH | Hardcoded rule path. | /etc/snort/rules |
| SO_RULE_PATH | Rules that come with registered and subscriber rules. | $RULE_PATH/so_rules |
| PREPROC_RULE_PATH | Preprocessor rules for Snort. | $RULE_PATH/plugin_rules |
Navigate to the "Step #2: Configure the decoder." section.
In this section, you manage the IPS mode of snort. The single-node installation model IPS model works best with "afpacket" mode. You can enable this mode and run Snort in IPS.
| TAG NAME | INFO | EXAMPLE |
|---|---|---|
| #config daq: | IPS mode selection. | afpacket |
| #config daq_mode: | Activating the inline mode | inline |
| #config logdir: | Hardcoded default log path. | /var/logs/snort |
Data Acquisition Modules (DAQ) are specific libraries used for packet I/O, bringing flexibility to process packets. It is possible to select DAQ type and mode for different purposes.
There are six DAQ modules available in Snort;
- Pcap: Default mode, known as Sniffer mode.
- Afpacket: Inline mode, known as IPS mode.
- Ipq: Inline mode on Linux by using Netfilter. It replaces the snort_inline patch.
- Nfq: Inline mode on Linux.
- Ipfw: Inline on OpenBSD and FreeBSD by using divert sockets, with the pf and ipfw firewalls.
- Dump: Testing mode of inline and normalisation.
The most popular modes are the default (pcap) and inline/IPS (Afpacket).
Navigate to the "Step #6: Configure output plugins" section.
This section manages the outputs of the IDS/IPS actions, such as logging and alerting format details. The default action prompts everything in the console application, so configuring this part will help you use the Snort more efficiently.
Navigate to the "Step #7: Customise your ruleset" section.
| TAG NAME | INFO | EXAMPLE |
|---|---|---|
| # site specific rules | Hardcoded local and user-generated rules path. | include $RULE_PATH/local.rules |
| #include $RULE_PATH/ | Hardcoded default/downloaded rules path. | include $RULE_PATH/rulename |
Note that "#" is commenting operator. You should uncomment a line to activate it.