


![[The AI Show Episode 143]: ChatGPT Revenue Surge, New AGI Timelines, Amazon’s AI Agent, Claude for Education, Model Context Protocol & LLMs Pass the Turing Test](https://www.marketingaiinstitute.com/hubfs/ep%20143%20cover.png)


.jpg?#)


_Muhammad_R._Fakhrurrozi_Alamy.jpg?width=1280&auto=webp&quality=80&disable=upscale#)
_NicoElNino_Alamy.jpg?width=1280&auto=webp&quality=80&disable=upscale#)


![M4 MacBook Air Drops to Just $849 - Act Fast! [Lowest Price Ever]](https://www.iclarified.com/images/news/97140/97140/97140-640.jpg)
![Apple Smart Glasses Not Close to Being Ready as Meta Targets 2025 [Gurman]](https://www.iclarified.com/images/news/97139/97139/97139-640.jpg)
![iPadOS 19 May Introduce Menu Bar, iOS 19 to Support External Displays [Rumor]](https://www.iclarified.com/images/news/97137/97137/97137-640.jpg)


Real-Time Log Monitoring with "journalctl -f" in Linux Systems
When managing Linux systems powered by systemd, effective real-time monitoring of logs can dramatically accelerate troubleshooting and system stability. The journalctl tool, a vital part of the systemd ecosystem, enables not just basic log viewing but also live streaming of system logs with robust filtering capabilities. Using journalctl -f (where -f stands for "follow"), you can watch logs in real time—similar to tail -f—but with added power to filter by service, priority, time, and format. This article dives deep into how to use journalctl for live monitoring, practical examples, advanced filtering, and even visualization through dashboards. Getting Started: Live Monitoring Basics At its simplest, real-time log viewing is easy: journalctl -f This command starts a live stream of system logs, displaying entries as they occur until you manually stop it (Ctrl+C). It's invaluable during service updates, crashes, or while troubleshooting unexpected behavior. Monitoring Specific Services in Real-Time Sometimes you only want to monitor one service (e.g., Nginx, SSH, or a custom application). Here's how: journalctl -u service_name -f Examples: Watch the SSH service: journalctl -u ssh -f Observe Nginx behavior: journalctl -u nginx -f Monitor your custom application: journalctl -u my-app.service -f Targeted service monitoring is especially useful during deployments or debugging service restarts. Filtering Logs by Priority and Time Want to focus on only critical issues? Combine real-time following with priority filtering: View only error-level logs: journalctl -f -p err You can also filter by time to limit what you see: View logs from the last hour: journalctl --since="1 hour ago" -f View logs since the last boot: journalctl --since=boot -f If you don't want to be overwhelmed with old entries before real-time streaming begins, limit initial output: Show only the last 20 entries before live streaming: journalctl -n 20 -f Show SSH logs from the past 30 minutes and continue monitoring journalctl -u ssh --since="30 min ago" -f Advanced Real-Time Filtering and Highlighting When you're buried under a flood of logs, simple keyword highlighting can make the important information pop out: Highlight error messages: journalctl -f | grep --color "error" Match multiple critical terms: journalctl -f | grep --color -E "error|warning|critical" Search without case sensitivity: journalctl -f | grep --color -i "error" Display extra context around matches: journalctl -f | grep --color -A 2 -B 2 "failed" Exclude noisy messages: journalctl -f | grep --color -v "periodic" Practical Example: Monitoring Failed SSH Logins in Real Time journalctl -f | grep --color -E "Failed password|authentication failure|invalid user" This is particularly useful for detecting potential security incidents on your servers. Watching Multiple Services Together Complex troubleshooting often involves multiple interrelated services (e.g., web servers + databases). Monitor more than one service simultaneously: journalctl -u nginx -u mysql -f Want to track broader service groups? journalctl -f _SYSTEMD_UNIT=apache* Or watch an entire application stack: journalctl -u nginx -u php-fpm -u redis -u postgres -f Enhanced Visualization and Highlighting Techniques Logs from multiple services can be visually overwhelming. Here are ways to make it easier: Color-code different services (with grep and sed): journalctl -u nginx -u mysql -f | grep --color=always -E 'nginx|mysql|$' | \ sed 's/nginx/\x1b[36mnginx\x1b[0m/g; s/mysql/\x1b[33mmysql\x1b[0m/g' Use the ccze tool for colorful logs: sudo apt install ccze journalctl -u nginx -u mysql -f | ccze -A Split monitoring across terminals: Terminal 1: journalctl -u nginx -f Terminal 2: journalctl -u mysql -f Output Formatting: JSON and Beyond Need to feed logs into automated tools? Stream logs in structured formats like JSON: journalctl -f -o json Process JSON logs using jq: journalctl -f -o json | jq 'select(.PRIORITY=="3") | {time: ._SOURCE_REALTIME_TIMESTAMP, msg: .MESSAGE}' Other output options: Verbose (full details): journalctl -f -o verbose Compact with microsecond precision: journalctl -f -o short-precise Message-only (clean output): journalctl -f -o cat Custom timestamps: ISO 8601: journalctl -f --output=short-iso RFC 3339: journalctl -f --output=short-precise Visualizing Logs: Export to Grafana, Datadog, or New Relic While terminal monitoring is excellent for active troubleshooting, long-term insights demand dashboards. Send Logs to Grafana Loki Set
When managing Linux systems powered by systemd, effective real-time monitoring of logs can dramatically accelerate troubleshooting and system stability. The journalctl tool, a vital part of the systemd ecosystem, enables not just basic log viewing but also live streaming of system logs with robust filtering capabilities.
Using journalctl -f (where -f stands for "follow"), you can watch logs in real time—similar to tail -f—but with added power to filter by service, priority, time, and format. This article dives deep into how to use journalctl for live monitoring, practical examples, advanced filtering, and even visualization through dashboards.
Getting Started: Live Monitoring Basics
At its simplest, real-time log viewing is easy:
journalctl -f
This command starts a live stream of system logs, displaying entries as they occur until you manually stop it (Ctrl+C). It's invaluable during service updates, crashes, or while troubleshooting unexpected behavior.
Monitoring Specific Services in Real-Time
Sometimes you only want to monitor one service (e.g., Nginx, SSH, or a custom application). Here's how:
journalctl -u service_name -f
Examples:
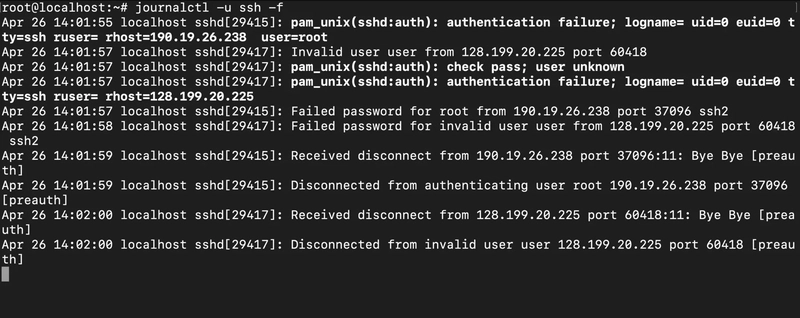
- Watch the SSH service:
journalctl -u ssh -f
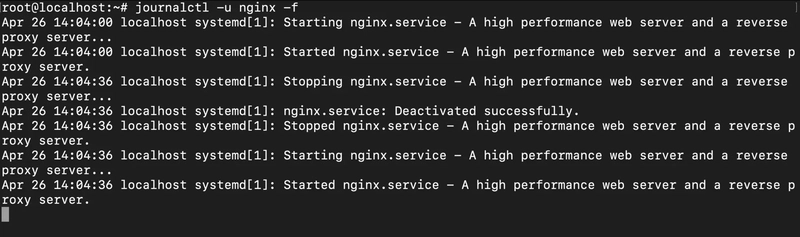
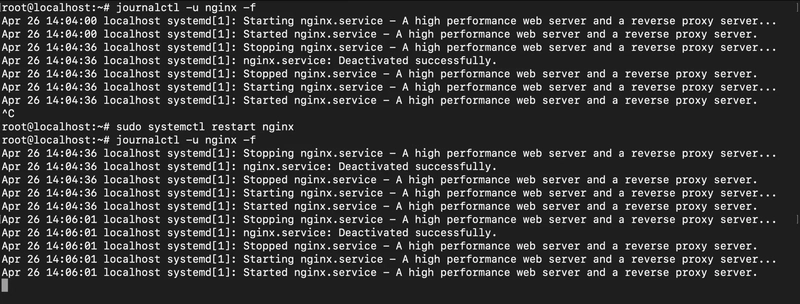
- Observe Nginx behavior:
journalctl -u nginx -f
- Monitor your custom application:
journalctl -u my-app.service -f
Targeted service monitoring is especially useful during deployments or debugging service restarts.
Filtering Logs by Priority and Time
Want to focus on only critical issues? Combine real-time following with priority filtering:
- View only error-level logs:
journalctl -f -p err
You can also filter by time to limit what you see:
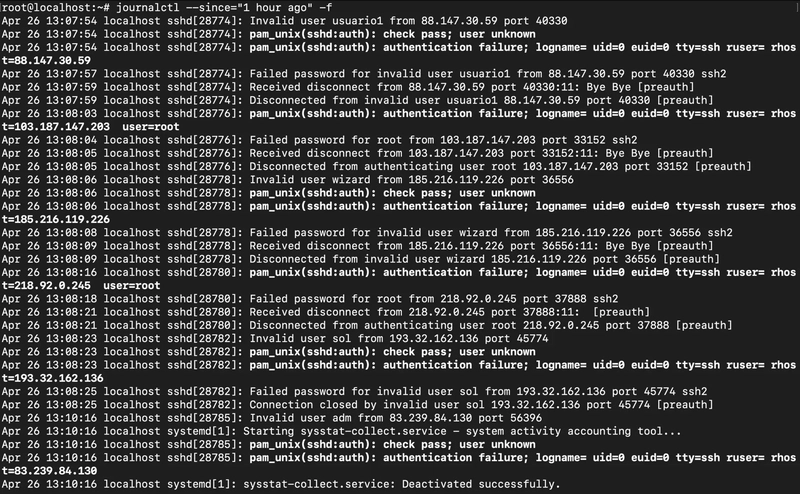
- View logs from the last hour:
journalctl --since="1 hour ago" -f
- View logs since the last boot:
journalctl --since=boot -f
If you don't want to be overwhelmed with old entries before real-time streaming begins, limit initial output:
- Show only the last 20 entries before live streaming:
journalctl -n 20 -f
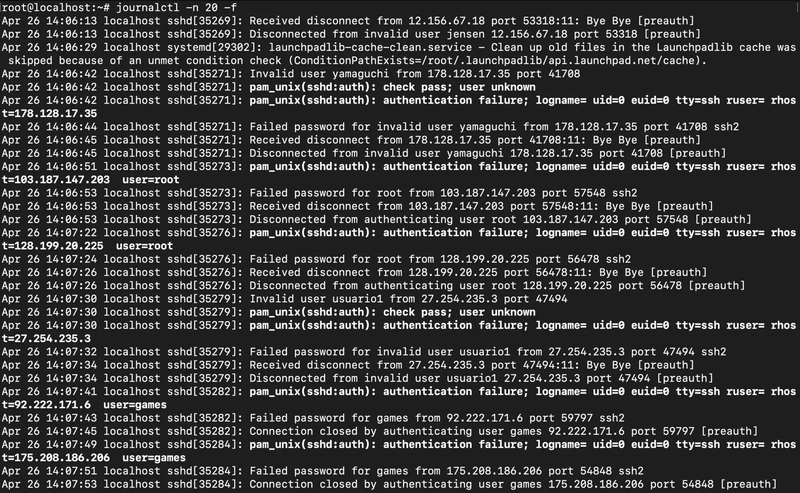
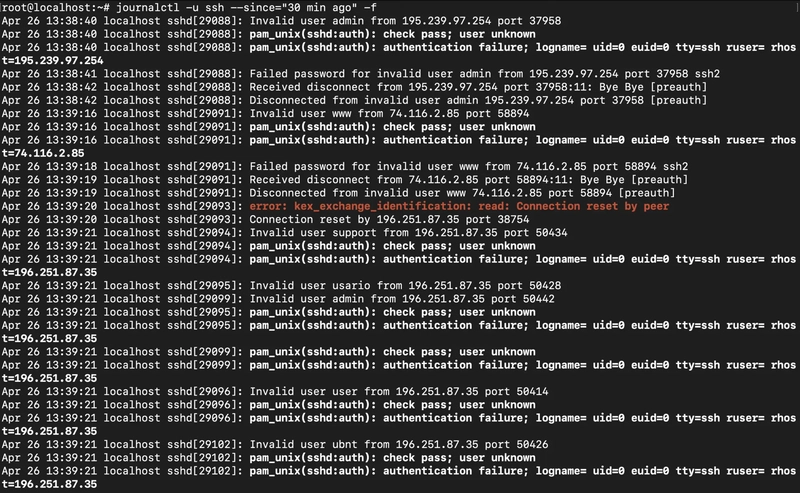
- Show SSH logs from the past 30 minutes and continue monitoring
journalctl -u ssh --since="30 min ago" -f
Advanced Real-Time Filtering and Highlighting
When you're buried under a flood of logs, simple keyword highlighting can make the important information pop out:
- Highlight error messages:
journalctl -f | grep --color "error"
- Match multiple critical terms:
journalctl -f | grep --color -E "error|warning|critical"
- Search without case sensitivity:
journalctl -f | grep --color -i "error"
- Display extra context around matches:
journalctl -f | grep --color -A 2 -B 2 "failed"
- Exclude noisy messages:
journalctl -f | grep --color -v "periodic"
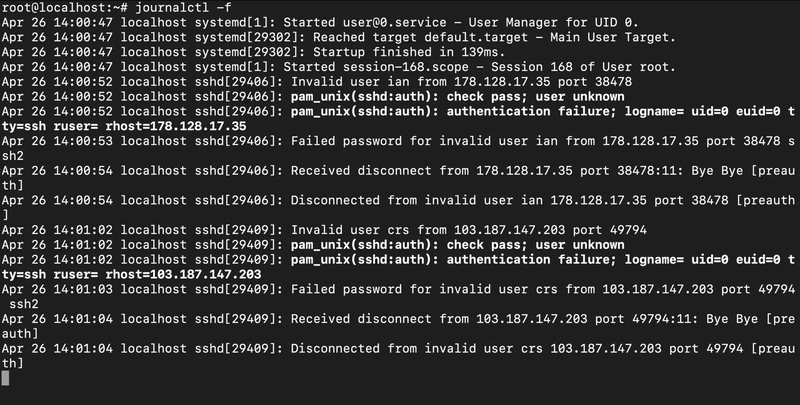
Practical Example:
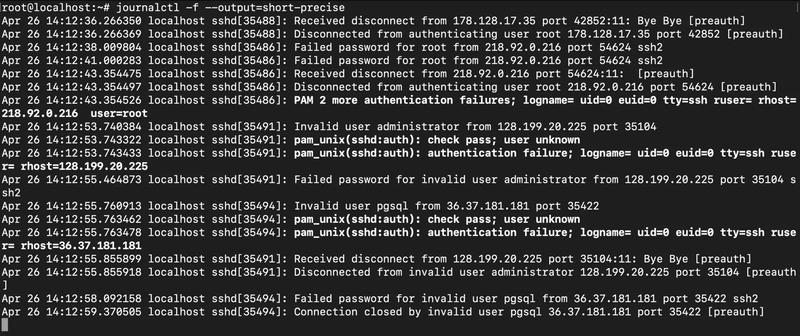
Monitoring Failed SSH Logins in Real Time
journalctl -f | grep --color -E "Failed password|authentication failure|invalid user"
This is particularly useful for detecting potential security incidents on your servers.
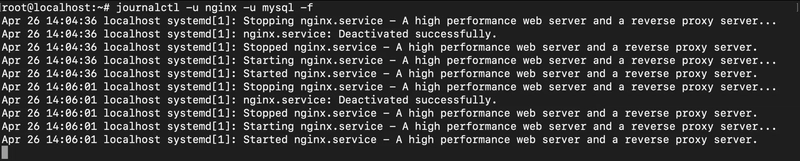
Watching Multiple Services Together
Complex troubleshooting often involves multiple interrelated services (e.g., web servers + databases).
Monitor more than one service simultaneously:
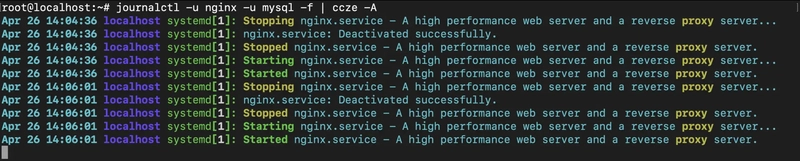
journalctl -u nginx -u mysql -f
Want to track broader service groups?
journalctl -f _SYSTEMD_UNIT=apache*
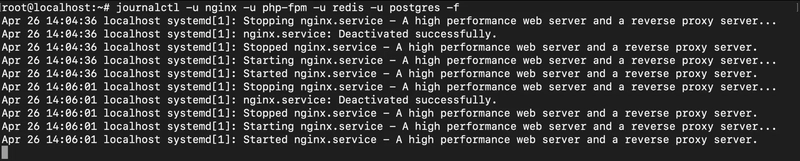
Or watch an entire application stack:
journalctl -u nginx -u php-fpm -u redis -u postgres -f
Enhanced Visualization and Highlighting Techniques
Logs from multiple services can be visually overwhelming. Here are ways to make it easier:
- Color-code different services (with grep and sed):
  journalctl -u nginx -u mysql -f | grep --color=always -E 'nginx|mysql|$' | \
  sed 's/nginx/\x1b[36mnginx\x1b[0m/g; s/mysql/\x1b[33mmysql\x1b[0m/g'
-
Use the
cczetool for colorful logs:
  sudo apt install ccze
  journalctl -u nginx -u mysql -f | ccze -A
-
Split monitoring across terminals:
- Terminal 1:
journalctl -u nginx -f- Terminal 2:
journalctl -u mysql -f
Output Formatting: JSON and Beyond
Need to feed logs into automated tools?
Stream logs in structured formats like JSON:
journalctl -f -o json
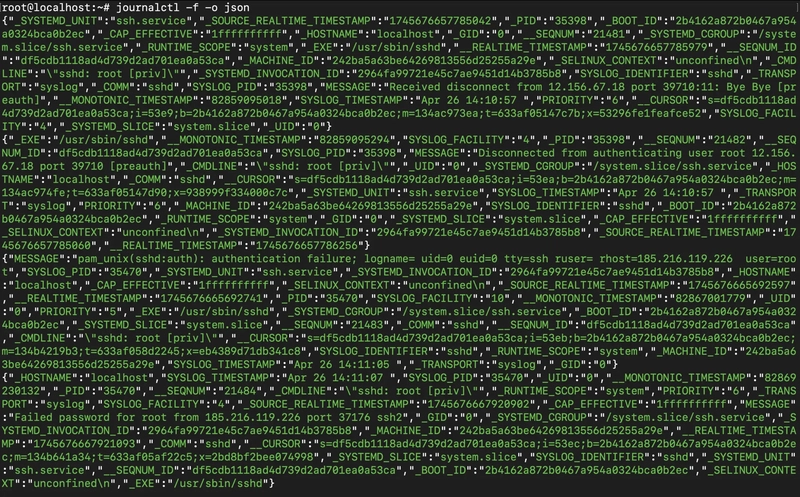
Process JSON logs using jq:
journalctl -f -o json | jq 'select(.PRIORITY=="3") | {time: ._SOURCE_REALTIME_TIMESTAMP, msg: .MESSAGE}'
Other output options:
- Verbose (full details):
journalctl -f -o verbose
- Compact with microsecond precision:
journalctl -f -o short-precise
- Message-only (clean output):
journalctl -f -o cat
Custom timestamps:
- ISO 8601:
journalctl -f --output=short-iso
- RFC 3339:
journalctl -f --output=short-precise
Visualizing Logs: Export to Grafana, Datadog, or New Relic
While terminal monitoring is excellent for active troubleshooting, long-term insights demand dashboards.
Send Logs to Grafana Loki
Set up Promtail to forward journal logs:
Example promtail configuration:
server:
  http_listen_port: 9080
positions:
  filename: /var/lib/promtail/positions.yaml
clients:
  - url: http://loki:3100/loki/api/v1/push
scrape_configs:
  - job_name: journal
    journal:
      max_age: 12h
      labels:
        job: systemd-journal
    relabel_configs:
      - source_labels: ['__journal__systemd_unit']
        target_label: 'unit'
Monitor Journald with Datadog
Install the Datadog agent and configure it:
logs:
  - type: journald
    service: "journald"
    source: "systemd"
New Relic Integration
Install New Relic's infrastructure agent and enable journald log collection.
Conclusion
Mastering real-time log monitoring with journalctl -f gives Linux admins, developers, and DevOps teams an edge in quickly diagnosing issues, understanding service behavior, and maintaining system health. Whether you're troubleshooting a failing service, monitoring security events, or proactively visualizing system health, journalctl offers a flexible and powerful solution.
Pair live terminal monitoring with smart filtering, highlighting, structured output, and modern dashboard integrations for the most robust Linux monitoring strategy.
Keep your systems transparent. Catch issues as they happen. Improve reliability.