


![[The AI Show Episode 143]: ChatGPT Revenue Surge, New AGI Timelines, Amazon’s AI Agent, Claude for Education, Model Context Protocol & LLMs Pass the Turing Test](https://www.marketingaiinstitute.com/hubfs/ep%20143%20cover.png)


![From drop-out to software architect with Jason Lengstorf [Podcast #167]](https://cdn.hashnode.com/res/hashnode/image/upload/v1743796461357/f3d19cd7-e6f5-4d7c-8bfc-eb974bc8da68.png?#)


.jpg?#)


_ArtemisDiana_Alamy.jpg?#)


 (1).webp?#)


-xl.jpg)


![Yes, the Gemini icon is now bigger and brighter on Android [U]](https://i0.wp.com/9to5google.com/wp-content/uploads/sites/4/2025/02/Gemini-on-Galaxy-S25.jpg?resize=1200%2C628&quality=82&strip=all&ssl=1)


![Apple Rushes Five Planes of iPhones to US Ahead of New Tariffs [Report]](https://www.iclarified.com/images/news/96967/96967/96967-640.jpg)
![Apple Vision Pro 2 Allegedly in Production Ahead of 2025 Launch [Rumor]](https://www.iclarified.com/images/news/96965/96965/96965-640.jpg)


How to use Elasticsearch and Grafana in a local environment
⚙️ Prerequisites: Docker installed and configured (I'm using wsl and ubuntu) Api using Elasticsearch for logging (I'm using Node.js) Create a shared newtwork using Docker docker network create monitoring Start the Elasticsearch container docker run -d --name=elasticsearch --network=monitoring -p 9200:9200 \ -e "discovery.type=single-node" \ -e "xpack.security.enabled=false" \ docker.elastic.co/elasticsearch/elasticsearch:8.12.0 Check if Elasticsearch is running curl -X GET "http://localhost:9200" Start the Grafana container docker run -d --name=grafana --network=monitoring -p 3003:3000 grafana/grafana Access Grafana using http:localhost:3003. The default user is "admin" and password is "admin" as well. Check if Grafana can connect to Elasticsearch by following these steps: docker exec -it grafana sh curl -X GET "http://elasticsearch:9200" If the DNS was not resolved, check the shared network again or try using Elasticsearch's IP instead of the DNS. Now, you can configure Elasticsearch in Grafana using the interface (http:localhost:3003). Go to: Configuration -> Data Sources -> Add data source -> Elasticsearch Fill in the information: URL Connection: http://elasticsearch:9200 or http://ip-addess:9200 Elasticsearch details according to your API configuration. ⚠️Remember that you should run your API first to generate logs and to register an index. ✅ Ok! to view your logs, go to 'Explore' in Grafana. ❌ If problems happen, you can investigate: You can check the available indexes in Elasticsearch using: curl -X GET "http://localhost:9200/_cat/indices?v" To see your specific index configuration (replace with your API's index name): curl -X GET "http://localhost:9200//_mapping?pretty" To see if logs are beeing registered in Elasticsearch: http://localhost:9200/_all/_search?pretty
⚙️ Prerequisites:
- Docker installed and configured (I'm using wsl and ubuntu)
- Api using Elasticsearch for logging (I'm using Node.js)
Create a shared newtwork using Docker
docker network create monitoring
Start the Elasticsearch container
docker run -d --name=elasticsearch --network=monitoring -p 9200:9200 \
  -e "discovery.type=single-node" \
  -e "xpack.security.enabled=false" \
  docker.elastic.co/elasticsearch/elasticsearch:8.12.0
Check if Elasticsearch is running
curl -X GET "http://localhost:9200"
Start the Grafana container
docker run -d --name=grafana --network=monitoring -p 3003:3000 grafana/grafana
Access Grafana using http:localhost:3003. The default user is "admin" and password is "admin" as well.
Check if Grafana can connect to Elasticsearch by following these steps:
docker exec -it grafana sh
curl -X GET "http://elasticsearch:9200"
If the DNS was not resolved, check the shared network again or try using Elasticsearch's IP instead of the DNS.
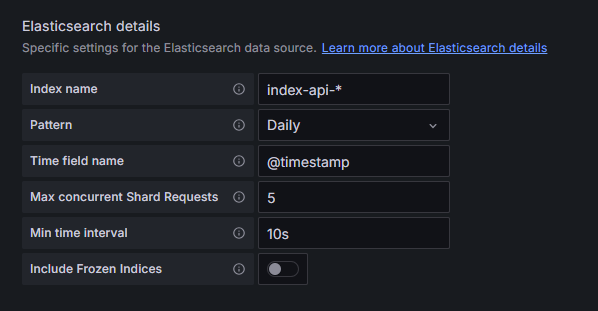
Now, you can configure Elasticsearch in Grafana using the interface (http:localhost:3003).
Go to: Configuration -> Data Sources -> Add data source -> Elasticsearch
Fill in the information:
- URL Connection: http://elasticsearch:9200 or http://ip-addess:9200
- Elasticsearch details according to your API configuration. ⚠️Remember that you should run your API first to generate logs and to register an index.
✅ Ok! to view your logs, go to 'Explore' in Grafana.
❌ If problems happen, you can investigate:
You can check the available indexes in Elasticsearch using:
curl -X GET "http://localhost:9200/_cat/indices?v"
To see your specific index configuration (replace with your API's index name):
curl -X GET "http://localhost:9200//_mapping?pretty"
To see if logs are beeing registered in Elasticsearch:
http://localhost:9200/_all/_search?pretty