


![[The AI Show Episode 146]: Rise of “AI-First” Companies, AI Job Disruption, GPT-4o Update Gets Rolled Back, How Big Consulting Firms Use AI, and Meta AI App](https://www.marketingaiinstitute.com/hubfs/ep%20146%20cover.png)


![How to make Developer Friends When You Don't Live in Silicon Valley, with Iraqi Engineer Code;Life [Podcast #172]](https://cdn.hashnode.com/res/hashnode/image/upload/v1747360508340/f07040cd-3eeb-443c-b4fb-370f6a4a14da.png?#)


-xl-(1)-xl-xl.jpg)


![How to upgrade the M4 Mac mini SSD and save hundreds [Video]](https://i0.wp.com/9to5mac.com/wp-content/uploads/sites/6/2025/05/M4-Mac-mini-SSD-Upgrade-Tutorial-2TB.jpg?resize=1200%2C628&quality=82&strip=all&ssl=1)
![‘Apple in China’ book argues that the iPhone could be killed overnight [Updated]](https://i0.wp.com/9to5mac.com/wp-content/uploads/sites/6/2025/05/Apple-in-China-review.jpg?resize=1200%2C628&quality=82&strip=all&ssl=1)


![iPhone 17 Air Could Get a Boost From TDK's New Silicon Battery Tech [Report]](https://www.iclarified.com/images/news/97344/97344/97344-640.jpg)
![Vision Pro Owners Say They Regret $3,500 Purchase [WSJ]](https://www.iclarified.com/images/news/97347/97347/97347-640.jpg)
![Apple Showcases 'Magnifier on Mac' and 'Music Haptics' Accessibility Features [Video]](https://www.iclarified.com/images/news/97343/97343/97343-640.jpg)
![Sony WH-1000XM6 Unveiled With Smarter Noise Canceling and Studio-Tuned Sound [Video]](https://www.iclarified.com/images/news/97341/97341/97341-640.jpg)


![Apple Stops Signing iPadOS 17.7.7 After Reports of App Login Issues [Updated]](https://images.macrumors.com/t/DoYicdwGvOHw-VKkuNvoxYs3pfo=/1920x/article-new/2023/06/ipados-17.jpg)


How to Set Up a Monitoring Stack with Prometheus, Grafana, and Node Exporter Using Docker Compose
Monitoring your infrastructure is crucial for reliability and performance. In this article, we'll walk through a simple and effective monitoring stack using Docker Compose, featuring Prometheus for metrics collection, Grafana for visualization, and Node Exporter for exposing host metrics. Project Structure . ├── docker-compose.yml ├── prometheus.yml └── provisioning/ └── datasources/ └── prometheus.yml Understanding the docker-compose.yml File Let's break down the main components of the docker-compose.yml file: services: prometheus: image: prom/prometheus:v3.3.1 container_name: prometheus ports: - "9090:9090" volumes: - ./prometheus.yml:/etc/prometheus/prometheus.yml - prometheus_data:/prometheus networks: - monitoring grafana: image: grafana/grafana:12.0.0 container_name: grafana ports: - "3000:3000" environment: - GF_SECURITY_ADMIN_PASSWORD=admin depends_on: - prometheus networks: - monitoring volumes: - ./provisioning/datasources:/etc/grafana/provisioning/datasources - grafana_data:/var/lib/grafana node_exporter: image: prom/node-exporter:v1.9.1 container_name: node_exporter ports: - "9100:9100" networks: - monitoring networks: monitoring: driver: bridge volumes: prometheus_data: driver: local grafana_data: driver: local Service Breakdown Prometheus Uses the official Prometheus image. Exposes port 9090. Mounts a local prometheus.yml config and a Docker volume for persistent data. Connected to a custom monitoring network. Grafana Uses the official Grafana image. Exposes port 3000. Sets the admin password via environment variable. Depends on Prometheus (starts after Prometheus is up). Mounts provisioning files and a persistent data volume. Connected to the monitoring network. Node Exporter Uses the official Node Exporter image. Exposes port 9100. Connected to the monitoring network. Networks and Volumes All services share the monitoring bridge network. Prometheus and Grafana use named volumes for data persistence. Step-by-Step Guide 1. Clone the Repository Github Link: https://github.com/rafi021/monitoring-stack-prometheus-grafana-node-exporter git clone cd 2. Review and Edit Configuration prometheus.yml: Make sure Prometheus is configured to scrape Node Exporter. provisioning/datasources/prometheus.yml: Ensures Grafana automatically adds Prometheus as a data source. The prometheus.yml file is the main configuration file for Prometheus. Here’s what each section does: global: scrape_interval: 5s global: Sets global configuration options. scrape_interval: 5s: Prometheus will scrape (collect) metrics from all configured targets every 5 seconds. scrape_configs: - job_name: 'node' static_configs: - targets: ['node_exporter:9100'] # This points to the Node Exporter container scrape_configs: Defines the list of jobs (sets of targets) Prometheus should scrape. job_name: 'node': Names this scrape job "node" (for Node Exporter). static_configs: Specifies static targets for this job. targets: ['node_exporter:9100']: Prometheus will scrape metrics from the Node Exporter container at port 9100. Summary: This config tells Prometheus to collect metrics from the Node Exporter container every 5 seconds. This file provisioning/datasources/prometheus.yml is a Grafana data source provisioning configuration. It tells Grafana to automatically add Prometheus as a data source when Grafana starts. apiVersion: 1 Specifies the version of the provisioning config format. datasources: A list of data sources to add. name: Prometheus The name that will appear in Grafana. type: prometheus Specifies the data source type (Prometheus). access: proxy Grafana will proxy requests to Prometheus (recommended for most setups). url: http://prometheus:9090 The URL where Prometheus is accessible from within the Docker network (using the service name). isDefault: true Sets this data source as the default in Grafana. Summary: This file ensures that Prometheus is pre-configured as the default data source in Grafana, so you don’t have to add it manually. 3. Start the Stack docker-compose up -d This command will pull the required images and start all services in the background. 4. Access the Services Prometheus UI: http://localhost:9090 Grafana UI: http://localhost:3000 Default login: admin / admin Node Exporter Metrics: http://localhost:9100/metrics Prometheus UI showing that the, node exporter endpoint is connected successfully. 5. Add Dashboards in Grafana Prometheus is already set as a data source. Import community dashboards or create your own to visualize Node Exporter metrics. Click + Create Dashboar

Monitoring your infrastructure is crucial for reliability and performance. In this article, we'll walk through a simple and effective monitoring stack using Docker Compose, featuring Prometheus for metrics collection, Grafana for visualization, and Node Exporter for exposing host metrics.
Project Structure
.
├── docker-compose.yml
├── prometheus.yml
└── provisioning/
    └── datasources/
        └── prometheus.yml
Understanding the docker-compose.yml File
Let's break down the main components of the docker-compose.yml file:
services:
  prometheus:
    image: prom/prometheus:v3.3.1
    container_name: prometheus
    ports:
      - "9090:9090"
    volumes:
      - ./prometheus.yml:/etc/prometheus/prometheus.yml
      - prometheus_data:/prometheus
    networks:
      - monitoring

  grafana:
    image: grafana/grafana:12.0.0
    container_name: grafana
    ports:
      - "3000:3000"
    environment:
      - GF_SECURITY_ADMIN_PASSWORD=admin
    depends_on:
      - prometheus
    networks:
      - monitoring
    volumes:
      - ./provisioning/datasources:/etc/grafana/provisioning/datasources
      - grafana_data:/var/lib/grafana

  node_exporter:
    image: prom/node-exporter:v1.9.1
    container_name: node_exporter
    ports:
      - "9100:9100"
    networks:
      - monitoring

networks:
  monitoring:
    driver: bridge

volumes:
  prometheus_data:
    driver: local
  grafana_data:
    driver: local
Service Breakdown
-
Prometheus
- Uses the official Prometheus image.
- Exposes port
9090. - Mounts a local
prometheus.ymlconfig and a Docker volume for persistent data. - Connected to a custom
monitoringnetwork.
-
Grafana
- Uses the official Grafana image.
- Exposes port
3000. - Sets the admin password via environment variable.
- Depends on Prometheus (starts after Prometheus is up).
- Mounts provisioning files and a persistent data volume.
- Connected to the
monitoringnetwork.
-
Node Exporter
- Uses the official Node Exporter image.
- Exposes port
9100. - Connected to the
monitoringnetwork.
-
Networks and Volumes
- All services share the
monitoringbridge network. - Prometheus and Grafana use named volumes for data persistence.
- All services share the
Step-by-Step Guide
1. Clone the Repository
Github Link: https://github.com/rafi021/monitoring-stack-prometheus-grafana-node-exporter
git clone
cd
2. Review and Edit Configuration
- prometheus.yml: Make sure Prometheus is configured to scrape Node Exporter.
- provisioning/datasources/prometheus.yml: Ensures Grafana automatically adds Prometheus as a data source.
The prometheus.yml file is the main configuration file for Prometheus. Here’s what each section does:
global:
  scrape_interval: 5s
- global: Sets global configuration options.
- scrape_interval: 5s: Prometheus will scrape (collect) metrics from all configured targets every 5 seconds.
scrape_configs:
  - job_name: 'node'
    static_configs:
      - targets: ['node_exporter:9100']  # This points to the Node Exporter container
- scrape_configs: Defines the list of jobs (sets of targets) Prometheus should scrape.
- job_name: 'node': Names this scrape job "node" (for Node Exporter).
- static_configs: Specifies static targets for this job.
- targets: ['node_exporter:9100']: Prometheus will scrape metrics from the Node Exporter container at port 9100.
Summary:
This config tells Prometheus to collect metrics from the Node Exporter container every 5 seconds.
This file provisioning/datasources/prometheus.yml is a Grafana data source provisioning configuration. It tells Grafana to automatically add Prometheus as a data source when Grafana starts.
apiVersion: 1
Specifies the version of the provisioning config format.-
datasources:
A list of data sources to add.- name: Prometheus The name that will appear in Grafana.
- type: prometheus Specifies the data source type (Prometheus).
- access: proxy Grafana will proxy requests to Prometheus (recommended for most setups).
- url: http://prometheus:9090 The URL where Prometheus is accessible from within the Docker network (using the service name).
- isDefault: true Sets this data source as the default in Grafana.
Summary:
This file ensures that Prometheus is pre-configured as the default data source in Grafana, so you don’t have to add it manually.
3. Start the Stack
docker-compose up -d
This command will pull the required images and start all services in the background.
4. Access the Services
- Prometheus UI: http://localhost:9090
-
Grafana UI: http://localhost:3000
- Default login:
admin/admin
- Default login:
- Node Exporter Metrics: http://localhost:9100/metrics
Prometheus UI showing that the, node exporter endpoint is connected successfully.
5. Add Dashboards in Grafana
- Prometheus is already set as a data source.
- Import community dashboards or create your own to visualize Node Exporter metrics.

- Click + Create Dashboard

- Import Node Exporter Dashboards: There are pre-configured dashboards available for Node Exporter. You can go to Grafana Dashboards and search for Node Exporter Full Dashboard (ID: 1860), which will give you a comprehensive view of your system metrics.

- In the Grafana Dashboards section, search for Node Exporter Full dashboard. The Dashboard ID for Node Exporter Full is 1860.
- Enter 1860 in the Import via ID field and click Load.
- In the Prometheus drop-down, choose the Prometheus data source you just configured.
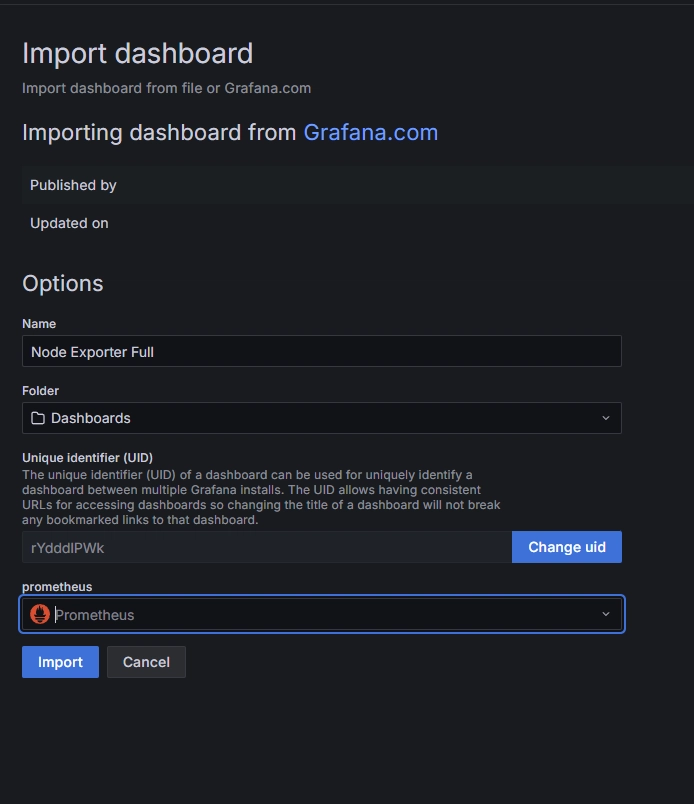
- Click Import.
- Verify the Dashboard:
- Once the dashboard is imported, you should see a comprehensive view of your Ubuntu server’s metrics, including CPU usage, memory usage, disk I/O, network statistics, etc.

6. Stopping the Stack
docker-compose down
This will stop and remove all containers, but your data will persist in the named volumes.
Tips & Troubleshooting
-
Customizing Prometheus Targets: Edit
prometheus.ymlto add more scrape targets. -
Persisting Data: Data is stored in Docker volumes (
prometheus_data,grafana_data). - Logs: Check logs with:
  docker-compose logs prometheus
  docker-compose logs grafana
  docker-compose logs node_exporter
- Change Default Password: For security, change the Grafana admin password in production.
Conclusion
With just a few files and Docker Compose, you can have a powerful monitoring stack up and running in minutes. This setup is perfect for local development, testing, or even small production environments.
Happy Monitoring!
References: