


![[The AI Show Episode 144]: ChatGPT’s New Memory, Shopify CEO’s Leaked “AI First” Memo, Google Cloud Next Releases, o3 and o4-mini Coming Soon & Llama 4’s Rocky Launch](https://www.marketingaiinstitute.com/hubfs/ep%20144%20cover.png)


.jpg?width=1920&height=1920&fit=bounds&quality=70&format=jpg&auto=webp#)


_Olekcii_Mach_Alamy.jpg?width=1280&auto=webp&quality=80&disable=upscale#)


![Apple Drops New Immersive Adventure Episode for Vision Pro: 'Hill Climb' [Video]](https://www.iclarified.com/images/news/97133/97133/97133-640.jpg)
![Most iPhones Sold in the U.S. Will Be Made in India by 2026 [Report]](https://www.iclarified.com/images/news/97130/97130/97130-640.jpg)
![Apple to Shift Robotics Unit From AI Division to Hardware Engineering [Report]](https://www.iclarified.com/images/news/97128/97128/97128-640.jpg)


How to Build Comprehensive Dashboards for Your SaaS and Cloud Apps
During my time as a Solutions/Cloud Architect, it was quite challenging to get a complete view of the components linked to a SaaS/Cloud application running across different systems. Imagine being in a meeting where two teams are trying to troubleshoot a VPN setup between a private cloud on a VMware stack and a Kubernetes cluster running on AWS. One team specializes in VMware, and the other in AWS, but neither understands the other's domain. Situations like this occur daily or weekly when working for a System Integrator and handling integrations for multiple accounts or customers. While architecture diagrams give a high-level view of an application, you need detailed information about all the components for deployment or troubleshooting. These details are usually in the application's LLD diagram. In this post, we will explore how to create a comprehensive dashboard for your SaaS/Cloud applications. This dashboard will let you quickly access detailed information about all system components, which is essential when troubleshooting an application in production. MechCloud dashboards use our AWS and System Info UI components to collect and display information from AWS and REST APIs of various systems, such as Cloudflare, Kubernetes, and Docker. These components use queries written in natural language to get information from the target REST API. Let's look at an example of an application deployed on a self-managed Kubernetes cluster running on an AWS Lightsail VM. This application is accessible on the internet through Cloudflare tunnels. Docker is also installed on the Lightsail VM and is used to run the cloudflared instance in a Docker container, which connects the Kubernetes cluster to Cloudflare. Now, we will create a dashboard with four cards (Cloudflare, Docker, Kubernetes and AWS Lightsail) to display information from these systems about the components or configuration needed for this application. We will arrange these cards in the following layout on the page: Creating an application dashboard We will now use the MechCloud page designer to create a dashboard for our application. Here are the steps: Create a team with the following details: Name - Team 1 Code - team1 Single Person - Yes Custom Components Host - https://demo-microapp1.mechcloud.io OIDC Proxy - https://oidc-proxy.mechcloud.io Register a Frame under the newly created team with the following details: Name - Tailwind Component - RktFrameTailwind Create a Site under the newly created team with following details: Title - Site 1 Mapping - site1 Protected - yes Frame - Tailwind Create two pages (Home, App1) under the site created in the previous step. Click on Site Nodes, select the team and site created above in the respective dropdowns and launch the Page designer for the Home page by clicking on three dots and then selecting the Launch Designer in the context menu. Launch the AI tool for the page designer by clicking on the Magic wand icon in the middle column and enter the following prompt to create a CSS Grid with MechCloud AWS Info and System Info components.nts: add 'mc grid' component add 'mc system info' component add 'mc aws info' component The prompt above will first add a CSS Grid component to the page, then it will add the AWS Info and System Info UI components within this CSS Grid component. Note that we used two spaces before the instructions to add these components, which tells the page designer to place them as child components under the CSS Grid component. This is the same method we use in AWS and Systems Agents, where increasing the indentation by two spaces for an instruction relative to the previous one creates a parent/child relationship between the resources created by the two adjacent instructions. The AWS Info component will show information about the Lightsail VM, while the System Info component will display details from Cloudflare, Kubernetes, and Docker. Instead of adding three System Info components through the prompt, which would result in three separate charges for LLM API calls, we will add this component only once using the page designer AI tool. Then, we'll use the Duplicate option in the page designer outline view to create two more copies of the System Info component. This won't be necessary once we implement caching for logical instructions in the page designer prompts. However, this feature is still useful when you need to add a component multiple times on a page, with each instance having different settings (like styles or classes). In such cases, duplicating the component can significantly reduce the LLM API costs. Hover the mouse over the System Info component in the page outline view (first column) added in the previous step, click on the three dots, and then click on the Duplicate option to create a copy of this component. Once you have cards for all four systems in place, assign a grid area label to each card by clicki

During my time as a Solutions/Cloud Architect, it was quite challenging to get a complete view of the components linked to a SaaS/Cloud application running across different systems. Imagine being in a meeting where two teams are trying to troubleshoot a VPN setup between a private cloud on a VMware stack and a Kubernetes cluster running on AWS. One team specializes in VMware, and the other in AWS, but neither understands the other's domain. Situations like this occur daily or weekly when working for a System Integrator and handling integrations for multiple accounts or customers.
While architecture diagrams give a high-level view of an application, you need detailed information about all the components for deployment or troubleshooting. These details are usually in the application's LLD diagram. In this post, we will explore how to create a comprehensive dashboard for your SaaS/Cloud applications. This dashboard will let you quickly access detailed information about all system components, which is essential when troubleshooting an application in production.
MechCloud dashboards use our AWS and System Info UI components to collect and display information from AWS and REST APIs of various systems, such as Cloudflare, Kubernetes, and Docker. These components use queries written in natural language to get information from the target REST API.
Let's look at an example of an application deployed on a self-managed Kubernetes cluster running on an AWS Lightsail VM. This application is accessible on the internet through Cloudflare tunnels. Docker is also installed on the Lightsail VM and is used to run the cloudflared instance in a Docker container, which connects the Kubernetes cluster to Cloudflare.
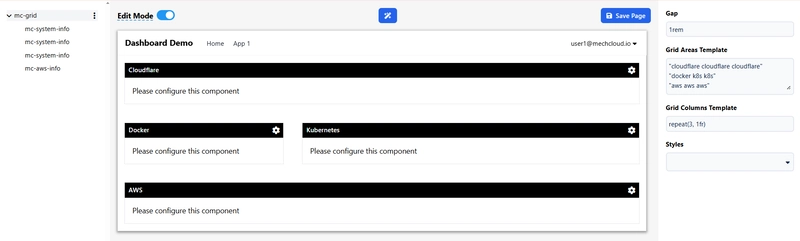
Now, we will create a dashboard with four cards (Cloudflare, Docker, Kubernetes and AWS Lightsail) to display information from these systems about the components or configuration needed for this application. We will arrange these cards in the following layout on the page:
Creating an application dashboard
We will now use the MechCloud page designer to create a dashboard for our application. Here are the steps:
-
Create a team with the following details:
- Name - Team 1
- Code - team1
- Single Person - Yes
- Custom Components Host - https://demo-microapp1.mechcloud.io
- OIDC Proxy - https://oidc-proxy.mechcloud.io
-
Register a Frame under the newly created team with the following details:
- Name - Tailwind
- Component - RktFrameTailwind
-
Create a Site under the newly created team with following details:
- Title - Site 1
- Mapping - site1
- Protected - yes
- Frame - Tailwind
-
Create two pages (
Home,App1) under the site created in the previous step.- Click on
Site Nodes, select the team and site created above in the respective dropdowns and launch the Page designer for theHomepage by clicking on three dots and then selecting theLaunch Designerin the context menu.
- Click on
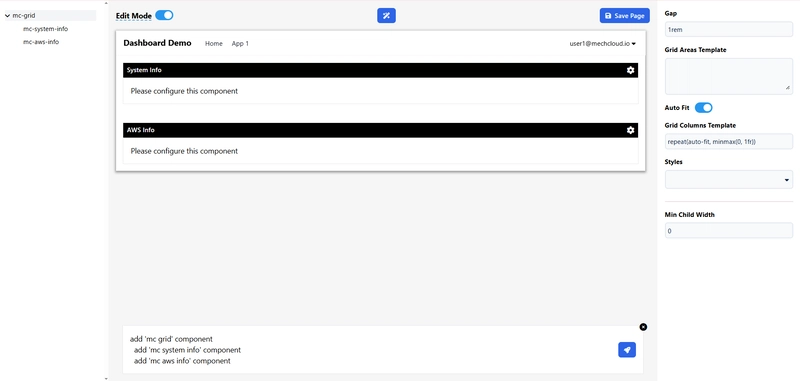
Launch the AI tool for the page designer by clicking on the
Magic wandicon in the middle column and enter the following prompt to create a CSS Grid with MechCloudAWS InfoandSystem Infocomponents.nts:
add 'mc grid' component
  add 'mc system info' component
  add 'mc aws info' component
The prompt above will first add a CSS Grid component to the page, then it will add the AWS Info and System Info UI components within this CSS Grid component. Note that we used two spaces before the instructions to add these components, which tells the page designer to place them as child components under the CSS Grid component. This is the same method we use in AWS and Systems Agents, where increasing the indentation by two spaces for an instruction relative to the previous one creates a parent/child relationship between the resources created by the two adjacent instructions.
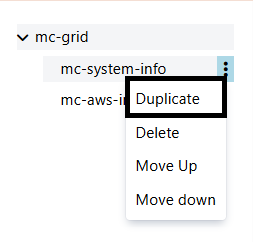
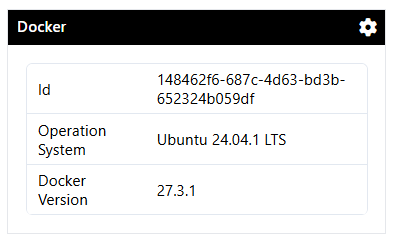
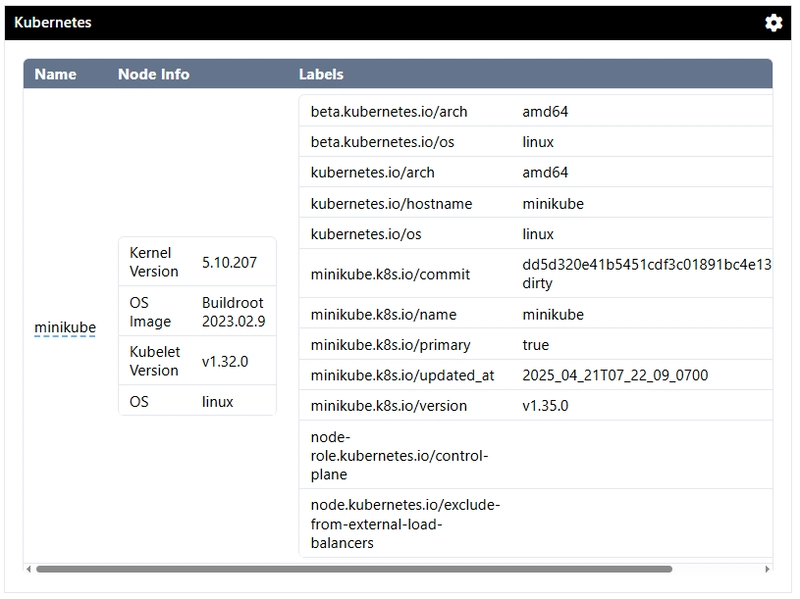
The AWS Info component will show information about the Lightsail VM, while the System Info component will display details from Cloudflare, Kubernetes, and Docker. Instead of adding three System Info components through the prompt, which would result in three separate charges for LLM API calls, we will add this component only once using the page designer AI tool. Then, we'll use the Duplicate option in the page designer outline view to create two more copies of the System Info component. This won't be necessary once we implement caching for logical instructions in the page designer prompts. However, this feature is still useful when you need to add a component multiple times on a page, with each instance having different settings (like styles or classes). In such cases, duplicating the component can significantly reduce the LLM API costs.
Hover the mouse over the System Info component in the page outline view (first column) added in the previous step, click on the three dots, and then click on the Duplicate option to create a copy of this component.
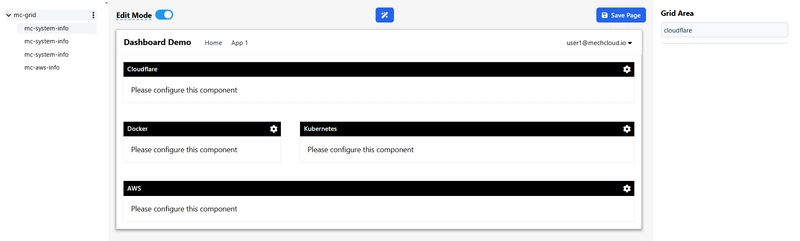
Once you have cards for all four systems in place, assign a grid area label to each card by clicking on a card in the page preview section (middle column) or its name in the outline section (first column). You can also update the Title of each card by clicking on the gear icon in the header of each card. Here are the titles and grid area labels for the different cards.
| Card | Title | Grid Area Label |
|---|---|---|
| System Info (1) | Cloudflare | cloudflare |
| System Info (2) | Docker | docker |
| System Info (3) | Kubernetes | k8s |
| AWS Info | AWS | aws |
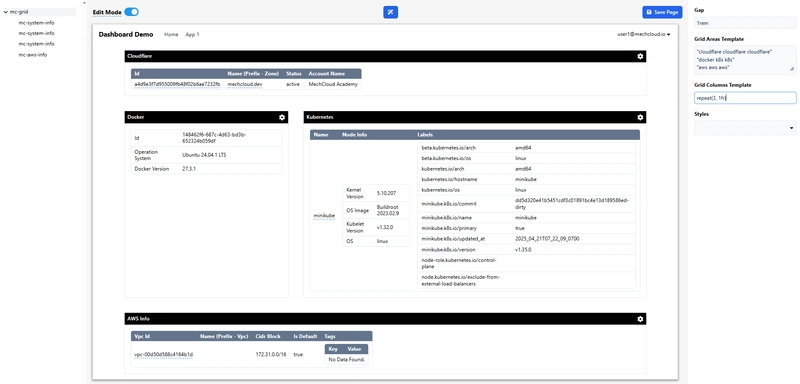
Now click on the CSS Grid component in the outline column and make sure the Grid Template Columns and Grid Area Template props have the following values:
Grid Area Template
"cloudflare cloudflare cloudflare"
"docker k8s k8s"
"aws aws aws"
Grid Columns Template - repeat(3, 1fr)
Add Cloud and System Accounts
Cloudflare
Deploy the MechCloud OIDC proxy in your Cloudflare account and add an account (e.g.,
cloudflare_academy) to this proxy with a bearer token for the Cloudflare API. See the proxy README for details.Log in to the MechCloud console.
Go to Infrastructure → System Accounts.
Select a team from the dropdown menu.
Click the
New System Accountbutton.-
Enter or select the following details:
-
Account - Enter a name for the account (e.g.,
Academy). -
System - Choose
Cloudflarefrom the dropdown menu. -
Credentials ID - Enter the name (e.g.,
cloudflare_academy) that you used when registering an account with the MechCloud OIDC proxy.
-
Account - Enter a name for the account (e.g.,
Docker
Navigate to Infrastructure → System Accounts.
Choose a team from the dropdown menu.
Click the
New System Accountbutton.-
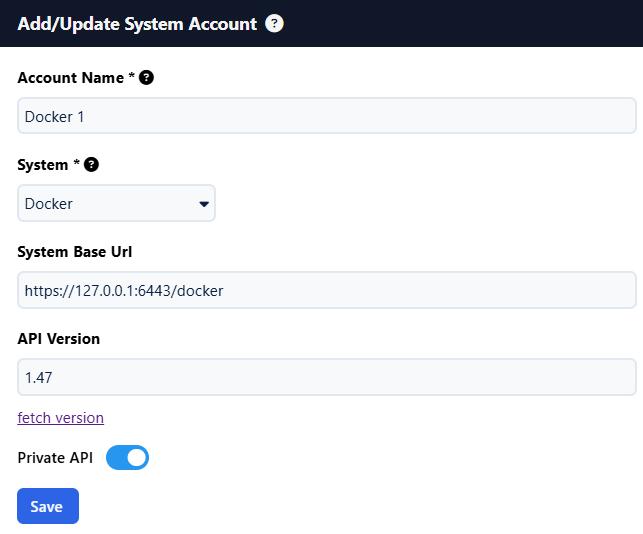
Enter or select the following details:
-
Account - Enter a name for the account (e.g.,
Docker 1). -
System - Choose
Dockerfrom the dropdown menu. -
System Base URL - Enter
https://127.0.0.1:6443/dockerin this field. Make sure it does not have a trailing slash. -
API Version - Click the
fetch versionlink to get the Docker Engine API version. - Private API - Ensure the flag is turned on. This means the API is only available on a private network and should be accessed from the MechCloud UI, not from the backend.d.
-
Account - Enter a name for the account (e.g.,
Kubernetes
Navigate to Infrastructure → System Accounts.
Choose a team from the dropdown menu.
Click the
New System Accountbutton.-
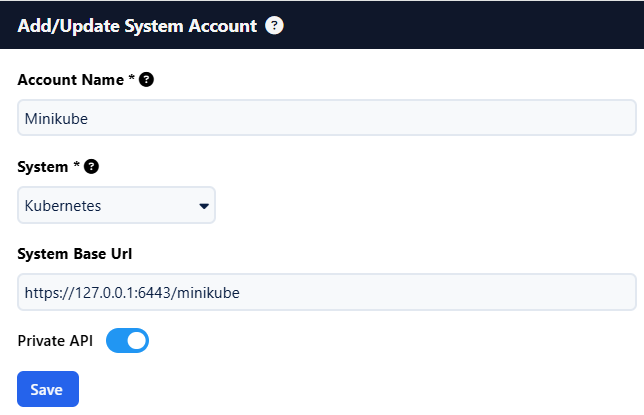
Enter or select the following details:
-
Account - Enter a name for the account (e.g.,
Minikube). -
System - Choose
Kubernetesfrom the dropdown menu. -
System Base URL - Enter
https://127.0.0.1:6443/minikubein this field. Make sure it does not have a trailing slash. - Private API - Ensure the flag is turned on. This means the API is only available on a private network and should be accessed from the MechCloud UI, not from the backend..
-
Account - Enter a name for the account (e.g.,
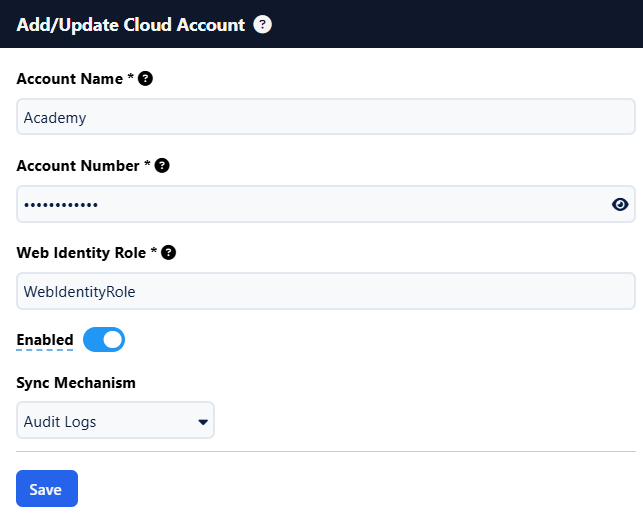
AWS
Navigate to Infrastructure → System Accounts.
Choose a team from the dropdown menu.
Click the
New System Accountbutton.-
Enter or select the following details:
-
Account - Enter a name for the account (e.g.,
Academy). - Account Number - Enter your 12-digit AWS account number.
-
Web Identity Role - Enter the name of the web identity role (e.g.,
WebIdentityRole). - Make sure the account is enabled (default) and the sync mechanism is set to audit logs (default).
-
Account - Enter a name for the account (e.g.,
Configure AWS and System accounts in the page designer
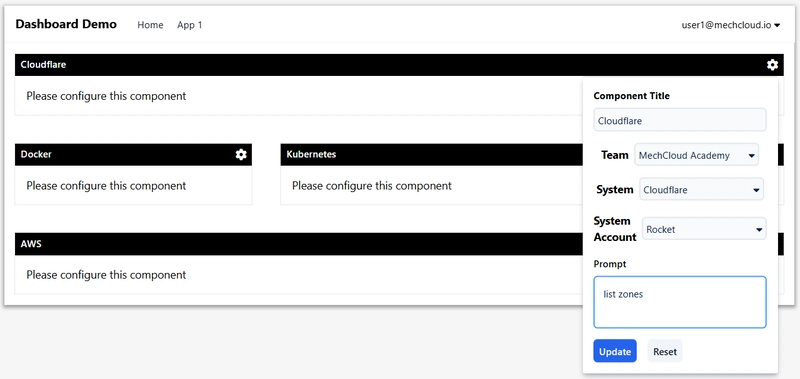
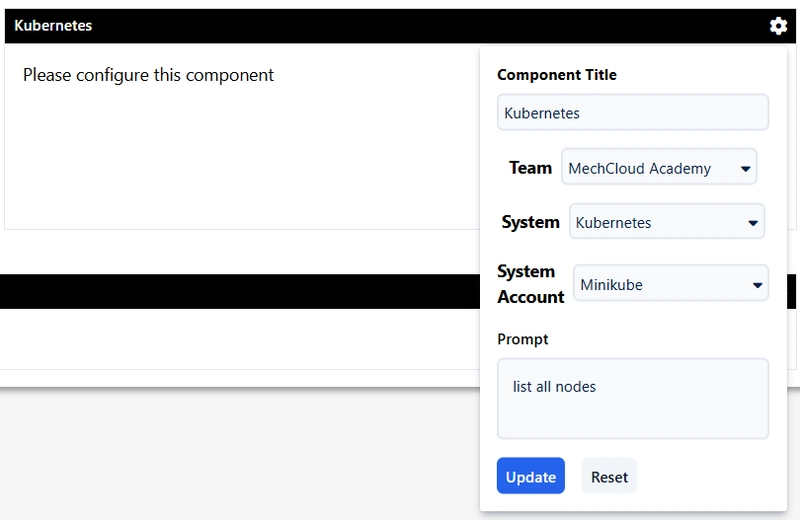
System Info component (Cloudflare, Kubernetes, Docker)
Click the gear icon in the header.
Select the team where you created the system account.
Choose the system account.
Enter a prompt (e.g.,
list zonesfor Cloudflare) in the prompt field. The prompt field can contain multiple query instructions, as shown below:
list all accounts
list all zones
- Click the
Updatebutton to apply the changes.
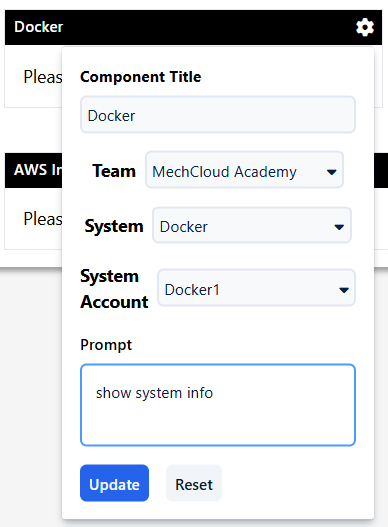
- Similarly, configure the
DockerandKubernetescards.
Docker
Kubernetes
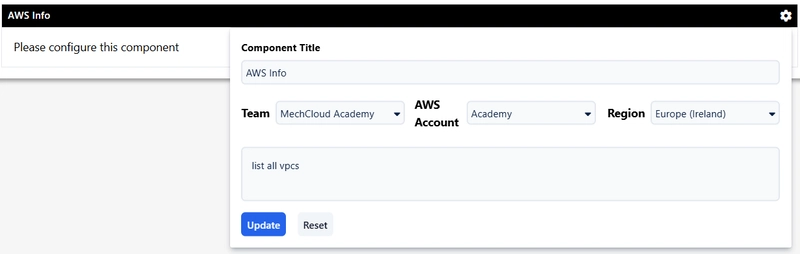
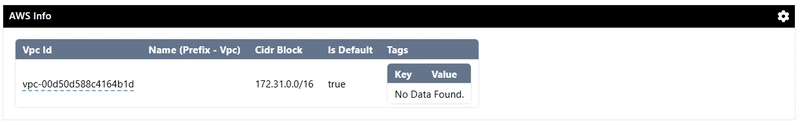
AWS Info component
Click the gear icon in the header.
Select the team where you created the system account.
Choose the AWS account.
Select a region from the Region dropdown.
Enter a prompt (e.g.,
list all vpcs) in the prompt field.Click the
Updatebutton to apply the changes.
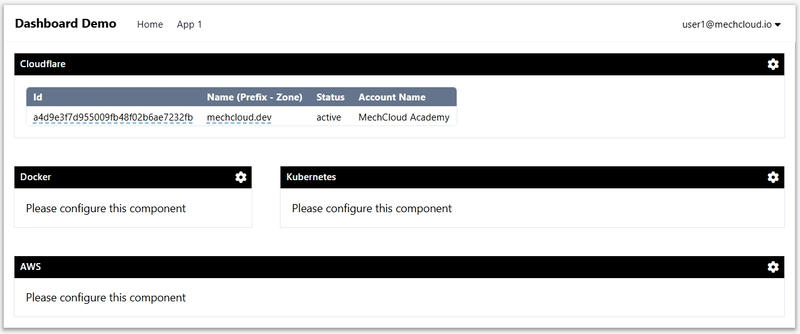
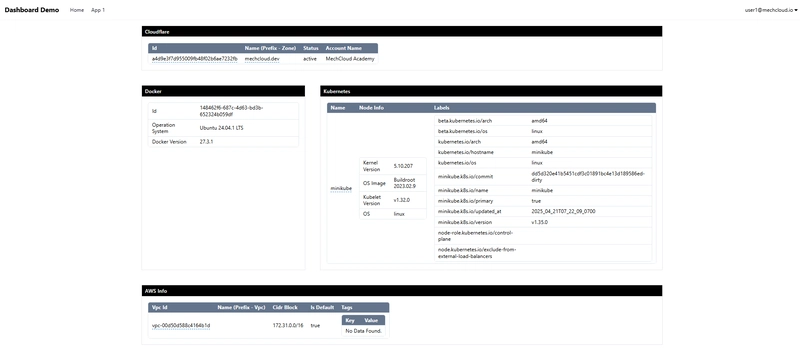
This is how the final dashboard will look when rendered in design / normal mode -
Conclusion
In conclusion, creating a rich dashboard for a 360-degree view of your SaaS and Cloud applications is essential for effective management and troubleshooting. By leveraging tools like MechCloud, you can integrate various components from AWS, Cloudflare, Kubernetes, and Docker into a cohesive dashboard. This approach not only enhances visibility into the intricate details of your applications but also facilitates collaboration between teams with different areas of expertise. With a well-designed dashboard, you can quickly access critical information, streamline operations, and ensure the smooth functioning of your cloud-based systems.