


![[The AI Show Episode 145]: OpenAI Releases o3 and o4-mini, AI Is Causing “Quiet Layoffs,” Executive Order on Youth AI Education & GPT-4o’s Controversial Update](https://www.marketingaiinstitute.com/hubfs/ep%20145%20cover.png)


![From Art School Drop-out to Microsoft Engineer with Shashi Lo [Podcast #170]](https://cdn.hashnode.com/res/hashnode/image/upload/v1746203291209/439bf16b-c820-4fe8-b69e-94d80533b2df.png?#)


(1).jpg?#)


_Inge_Johnsson-Alamy.jpg?width=1280&auto=webp&quality=80&disable=upscale#)


![Apple to Split iPhone Launches Across Fall and Spring in Major Shakeup [Report]](https://www.iclarified.com/images/news/97211/97211/97211-640.jpg)
![Apple to Move Camera to Top Left, Hide Face ID Under Display in iPhone 18 Pro Redesign [Report]](https://www.iclarified.com/images/news/97212/97212/97212-640.jpg)
![Apple Developing Battery Case for iPhone 17 Air Amid Battery Life Concerns [Report]](https://www.iclarified.com/images/news/97208/97208/97208-640.jpg)
![AirPods 4 On Sale for $99 [Lowest Price Ever]](https://www.iclarified.com/images/news/97206/97206/97206-640.jpg)


![[Updated] Samsung’s 65-inch 4K Smart TV Just Crashed to $299 — That’s Cheaper Than an iPad](https://www.androidheadlines.com/wp-content/uploads/2025/05/samsung-du7200.jpg)


Housing market shift: 9 states where buyers are quickly gaining power
Want more housing market stories from Lance Lambert’s ResiClub in your inbox? Subscribe to the ResiClub newsletter. When assessing home price momentum, ResiClub believes it’s important to monitor active listings and months of supply. If active listings start to rapidly increase as homes remain on the market for longer periods, it may indicate pricing softness or weakness. Conversely, a rapid decline in active listings could suggest a market that is heating up. Generally speaking, local housing markets where active inventory has returned to pre-pandemic levels have experienced softer home price growth (or outright price declines) over the past 30 months. Conversely, local housing markets where active inventory remains far below pre-pandemic levels have, generally speaking, experienced stronger home price growth over the past 30 months. How is inventory shaping up in 2025? As ResiClub communicated to ResiClub PRO members in late 2023—and reaffirmed last fall—we expect national active inventory to approach pre-pandemic 2019 levels in the second half of 2025. That’s still the trajectory we’re on. National active listings are on the rise (+30.6% between April 2024 and April 2025). This indicates that homebuyers have gained some leverage in many parts of the country over the past year. Some sellers’ markets have turned into balanced markets, and more balanced markets have turned into buyers’ markets. Nationally, we’re still below pre-pandemic 2019 inventory levels (-15.6% below April 2019), and some resale markets, in particular big chunks of the Midwest and Northeast, still remain tight to tight-ish. April inventory/active listings* total, according to Realtor.com: April 2017: 1,198,424

Want more housing market stories from Lance Lambert’s ResiClub in your inbox? Subscribe to the ResiClub newsletter.
When assessing home price momentum, ResiClub believes it’s important to monitor active listings and months of supply. If active listings start to rapidly increase as homes remain on the market for longer periods, it may indicate pricing softness or weakness. Conversely, a rapid decline in active listings could suggest a market that is heating up.
Generally speaking, local housing markets where active inventory has returned to pre-pandemic levels have experienced softer home price growth (or outright price declines) over the past 30 months. Conversely, local housing markets where active inventory remains far below pre-pandemic levels have, generally speaking, experienced stronger home price growth over the past 30 months.
How is inventory shaping up in 2025? As ResiClub communicated to ResiClub PRO members in late 2023—and reaffirmed last fall—we expect national active inventory to approach pre-pandemic 2019 levels in the second half of 2025. That’s still the trajectory we’re on.
National active listings are on the rise (+30.6% between April 2024 and April 2025). This indicates that homebuyers have gained some leverage in many parts of the country over the past year. Some sellers’ markets have turned into balanced markets, and more balanced markets have turned into buyers’ markets.
Nationally, we’re still below pre-pandemic 2019 inventory levels (-15.6% below April 2019), and some resale markets, in particular big chunks of the Midwest and Northeast, still remain tight to tight-ish.
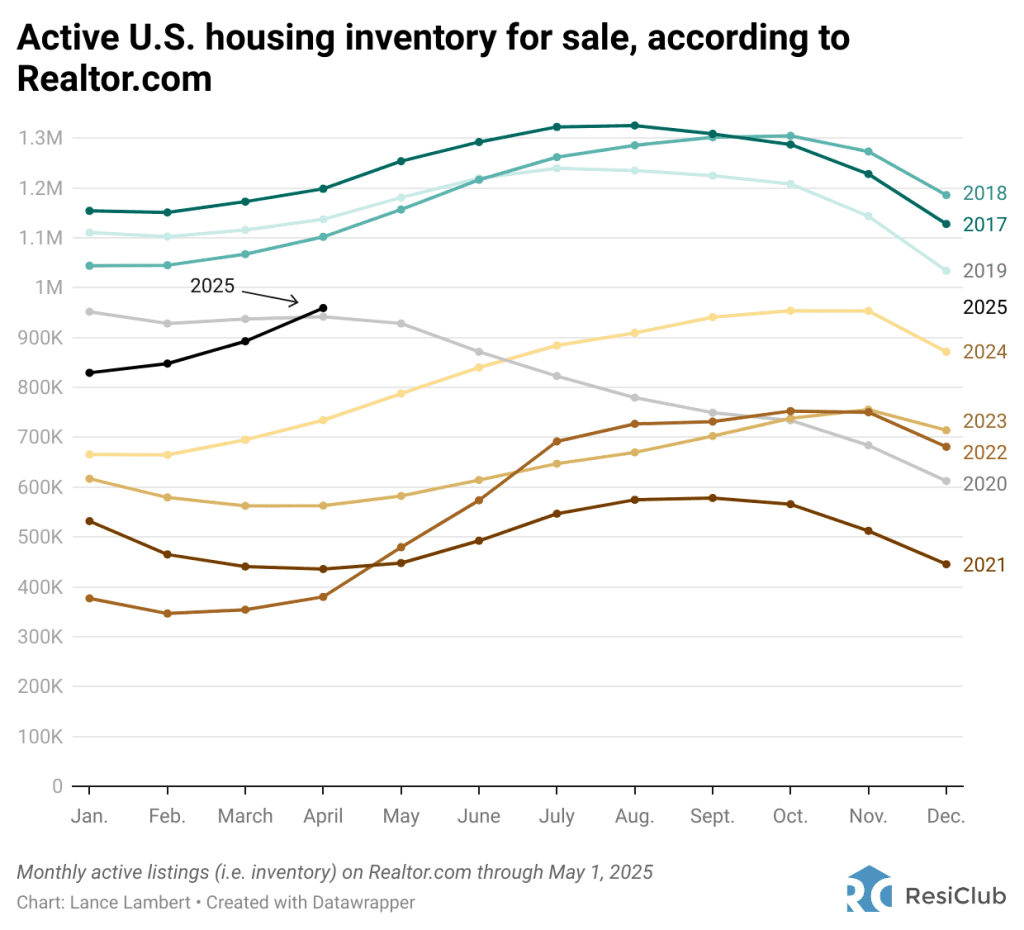
April inventory/active listings* total, according to Realtor.com:
- April 2017: 1,198,424