Here are 3 actually helpful graphics to understand Trump’s tariffs
In a showy speech at the White House yesterday, President Trump announced his most sweeping tariffs to date—and the news has sent the global economic order into chaos. The slew of tariffs impact more than 180 countries. Trump announced a minimum 10% tariff on almost every country worldwide, meaning that nearly every good imported into the U.S. will automatically receive a 10% tax. Dozens of countries have been hit with much higher rates: Goods from China will now have a 34% tariff added on top of a previous blanket tax imposed this year; Cambodia will face a 49% tariff; and Vietnam’s imports will be taxed at 46%. The Trump administration is framing this global trade war as a way to punish other countries in a trade surplus with the U.S., as well as a means to increase manufacturing jobs on American soil. Many experts, however, are warning that the move is likely to cause a spike in inflation, with some fearing an impending recession. Meanwhile, world leaders, including European Commission President Ursula von der Leyen, are denouncing the decision and calling for talks to rescind the fees. The news has already caused the American stock market to take a concerning nosedive. Trump announced his new tariff plan while wielding a series of difficult-to-parse charts that have been widely criticized for lacking any discernible organization. But data visualization should play a key role in simplifying and clarifying the confusion around the new policies. To that end, here are three graphics to help you actually understand the new tariffs. The tariffs This map, created by USA Today journalist Carlie Procell, provides a simple, comprehensive view of how Trump’s tariffs are impacting targeted countries. The graphic is color-coded into five different segments based on the severity of the tariffs levied against each region: ultra light blue countries, for example, land somewhere between the baseline 10% tariff and 20%, while the darkest blue countries are getting hit the hardest with tariffs between 40% and 50%. By clicking on the various blue shades in the color key, users can isolate their view to examine each of the five tiers individually. Explore the interactive graphic here. [Image: USA Today] Procell’s map also comes with an alphabetized table organized by country. To determine the tariffs faced by a specific country, users can simply search its name in the attached toolbar. The fallout For a better look at the initial fallout of the tariff announcement, a group of reporters at The New York Times have created a graph tracking global stock markets’ trajectories from Trump’s inauguration on January 17 to this morning. See the updates here [Image: The New York Times] The graph shows percentage change in major stock indexes for Germany’s DAX, China’s Shanghai SE Composite, the United Kingdom’s FTSE 100, Canada’s S&P/TSX Composite, the United States’ S&P 500, and Japan’s Nikkei 225. As of 9:30 a.m. Eastern, the S&P 500 plunged more than 4% since yesterday’s market close (amounting to a total 9% drop since Trump’s inauguration.) Major stocks in both Asian and European markets also slumped abruptly this morning. The graph suggests that Trump’s new tariffs are even harsher than most economists and investors feared. What’s ahead Less than a day after the tariff announcement, many analysts are predicting that American consumers should prepare for a spike in inflation. To keep track of this rising cost of living, CBS News has created a price tracker for goods including groceries, new vehicles, used vehicles, parts, repairs, insurance premiums, and construction and manufacturing raw materials. According to the tool’s accompanying article, CBS plans to update the prices of groceries weekly (including heavily imported fruits and veggies like bananas and bell peppers), while the other categories will be updated every month. See the interactive tracker here. [Image: CBS News Data] Over the coming weeks, the price tracker could help consumers understand how the cost of essential goods is changing as a result of the new tariffs. In an interview with CNBC, David Rosenberg, president and founder of the market research firm Rosenberg Research, warned, “we’re in for several months of a very significant price shock for the American household sector.”

In a showy speech at the White House yesterday, President Trump announced his most sweeping tariffs to date—and the news has sent the global economic order into chaos.
The slew of tariffs impact more than 180 countries. Trump announced a minimum 10% tariff on almost every country worldwide, meaning that nearly every good imported into the U.S. will automatically receive a 10% tax. Dozens of countries have been hit with much higher rates: Goods from China will now have a 34% tariff added on top of a previous blanket tax imposed this year; Cambodia will face a 49% tariff; and Vietnam’s imports will be taxed at 46%.
The Trump administration is framing this global trade war as a way to punish other countries in a trade surplus with the U.S., as well as a means to increase manufacturing jobs on American soil. Many experts, however, are warning that the move is likely to cause a spike in inflation, with some fearing an impending recession. Meanwhile, world leaders, including European Commission President Ursula von der Leyen, are denouncing the decision and calling for talks to rescind the fees. The news has already caused the American stock market to take a concerning nosedive.
Trump announced his new tariff plan while wielding a series of difficult-to-parse charts that have been widely criticized for lacking any discernible organization. But data visualization should play a key role in simplifying and clarifying the confusion around the new policies. To that end, here are three graphics to help you actually understand the new tariffs.
The tariffs
This map, created by USA Today journalist Carlie Procell, provides a simple, comprehensive view of how Trump’s tariffs are impacting targeted countries.
The graphic is color-coded into five different segments based on the severity of the tariffs levied against each region: ultra light blue countries, for example, land somewhere between the baseline 10% tariff and 20%, while the darkest blue countries are getting hit the hardest with tariffs between 40% and 50%. By clicking on the various blue shades in the color key, users can isolate their view to examine each of the five tiers individually.
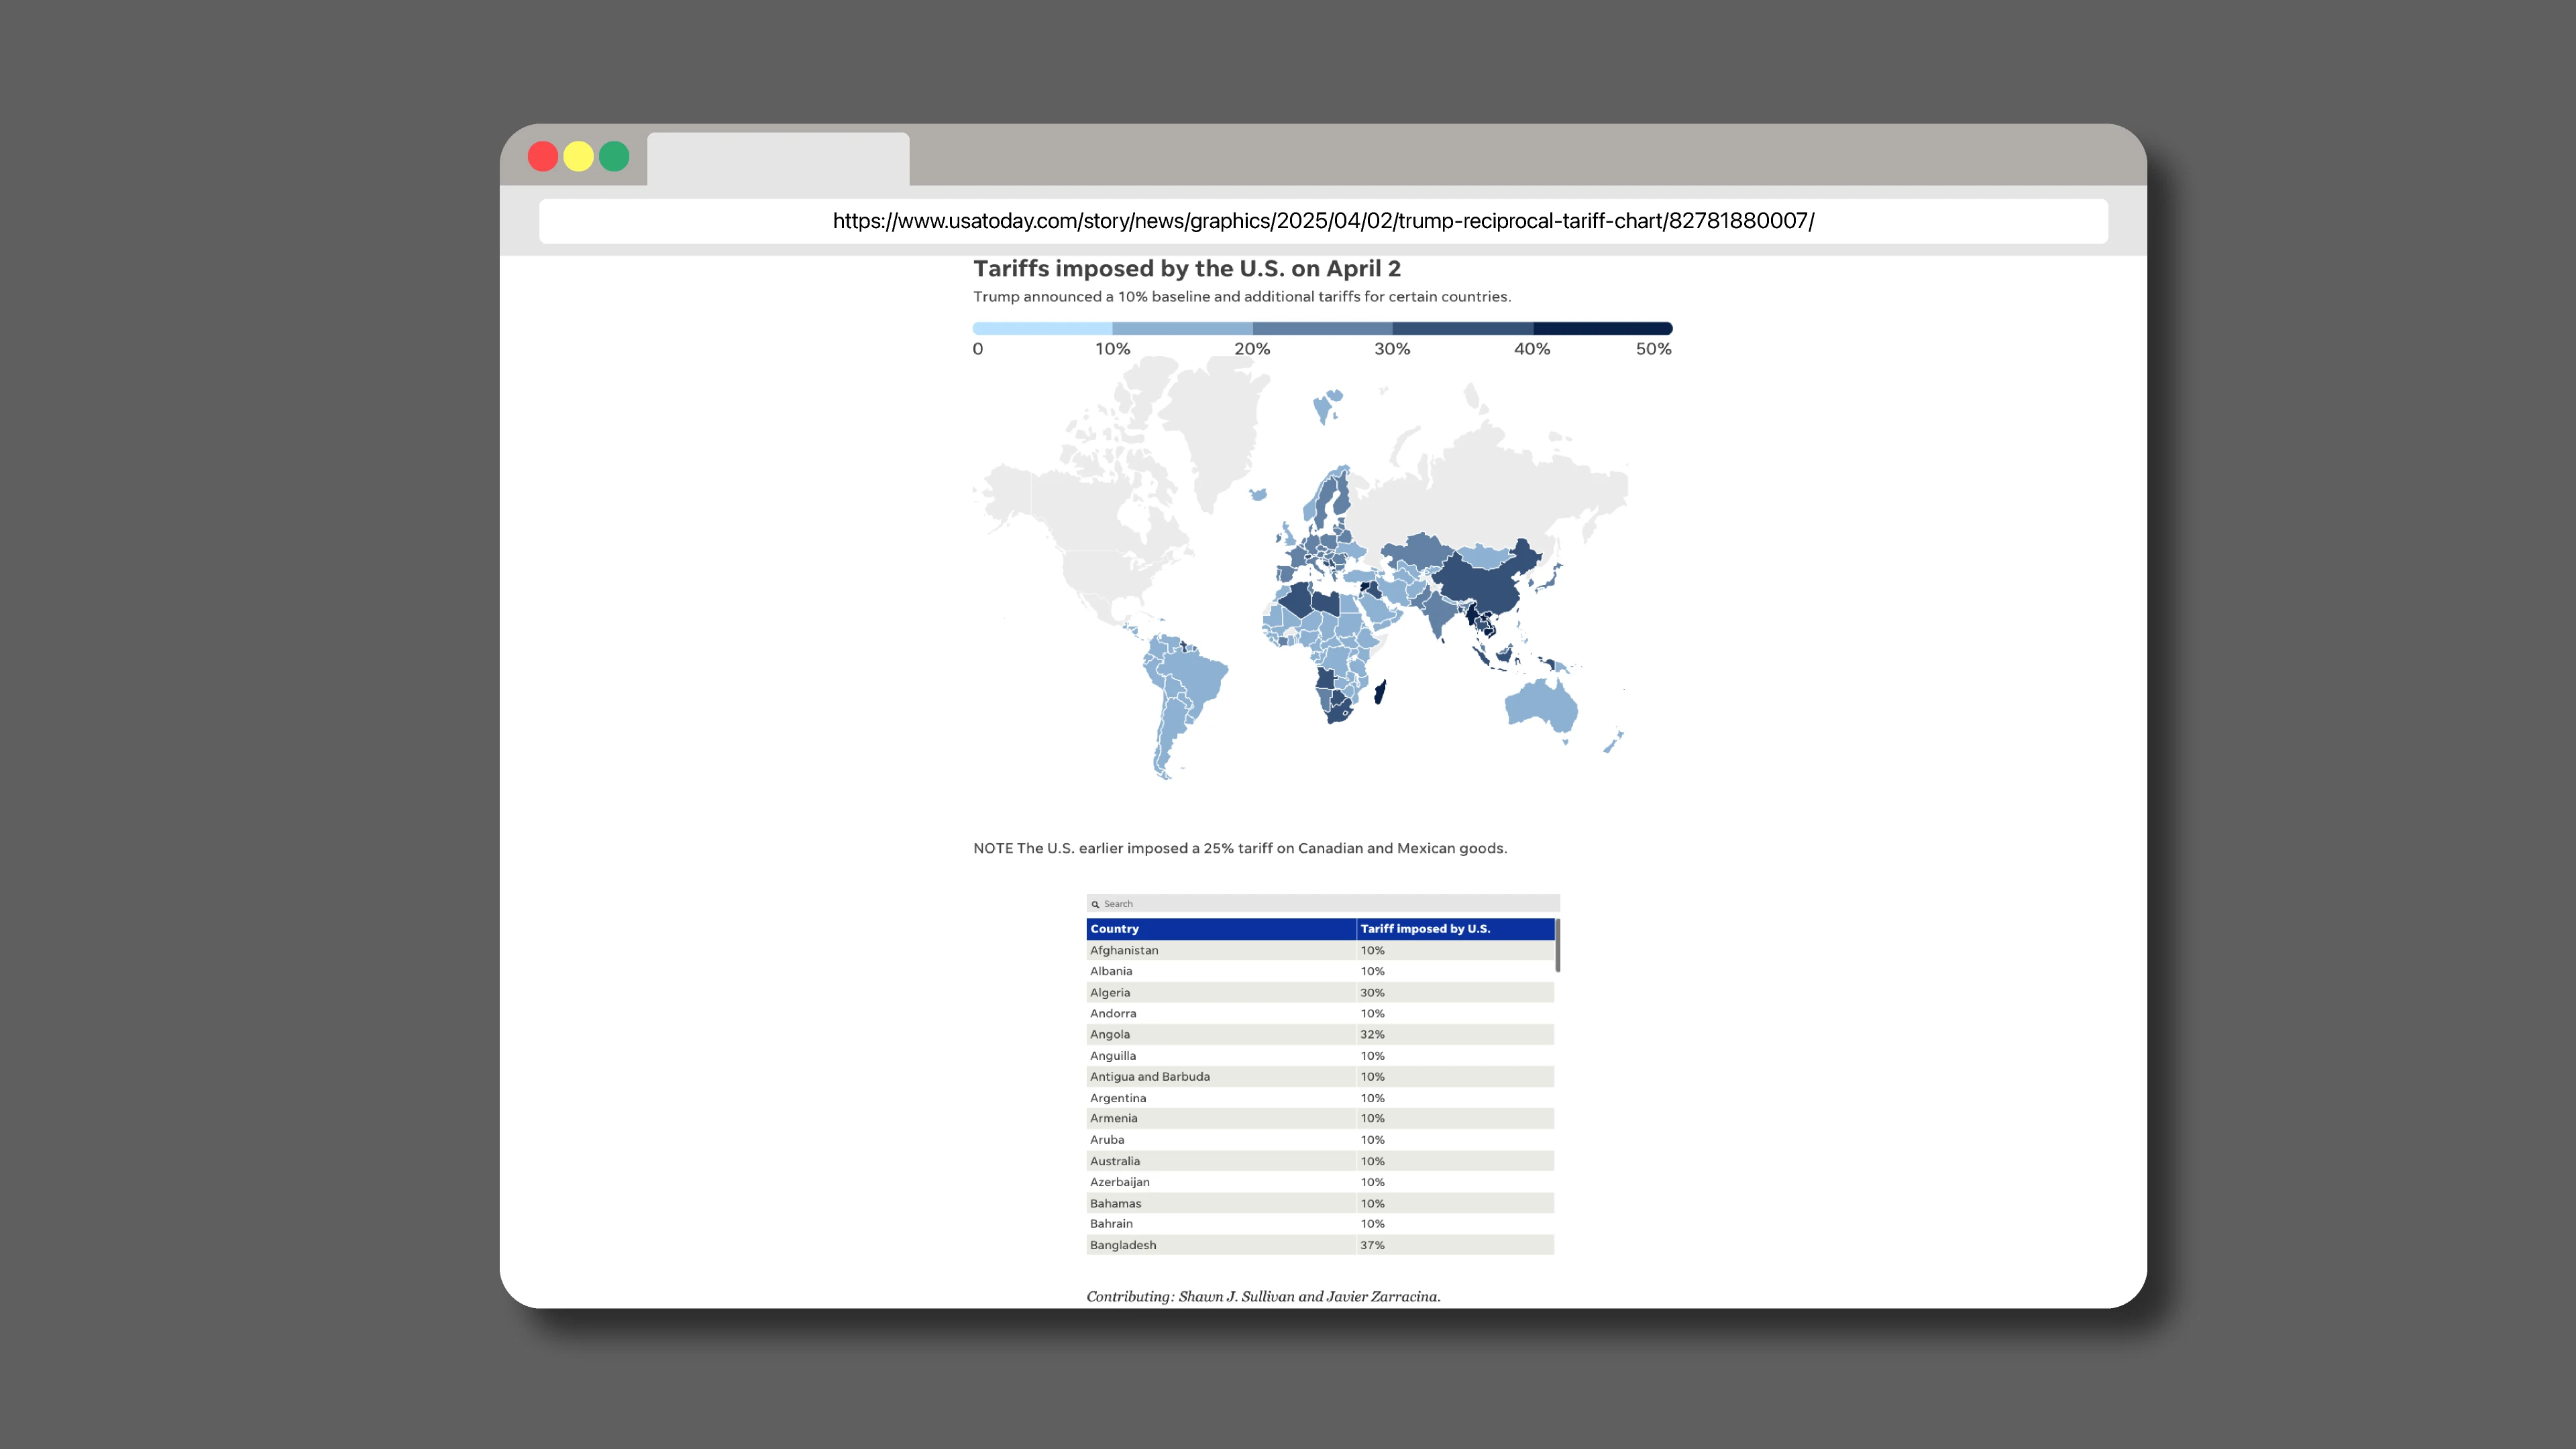
Procell’s map also comes with an alphabetized table organized by country. To determine the tariffs faced by a specific country, users can simply search its name in the attached toolbar.
The fallout
For a better look at the initial fallout of the tariff announcement, a group of reporters at The New York Times have created a graph tracking global stock markets’ trajectories from Trump’s inauguration on January 17 to this morning.
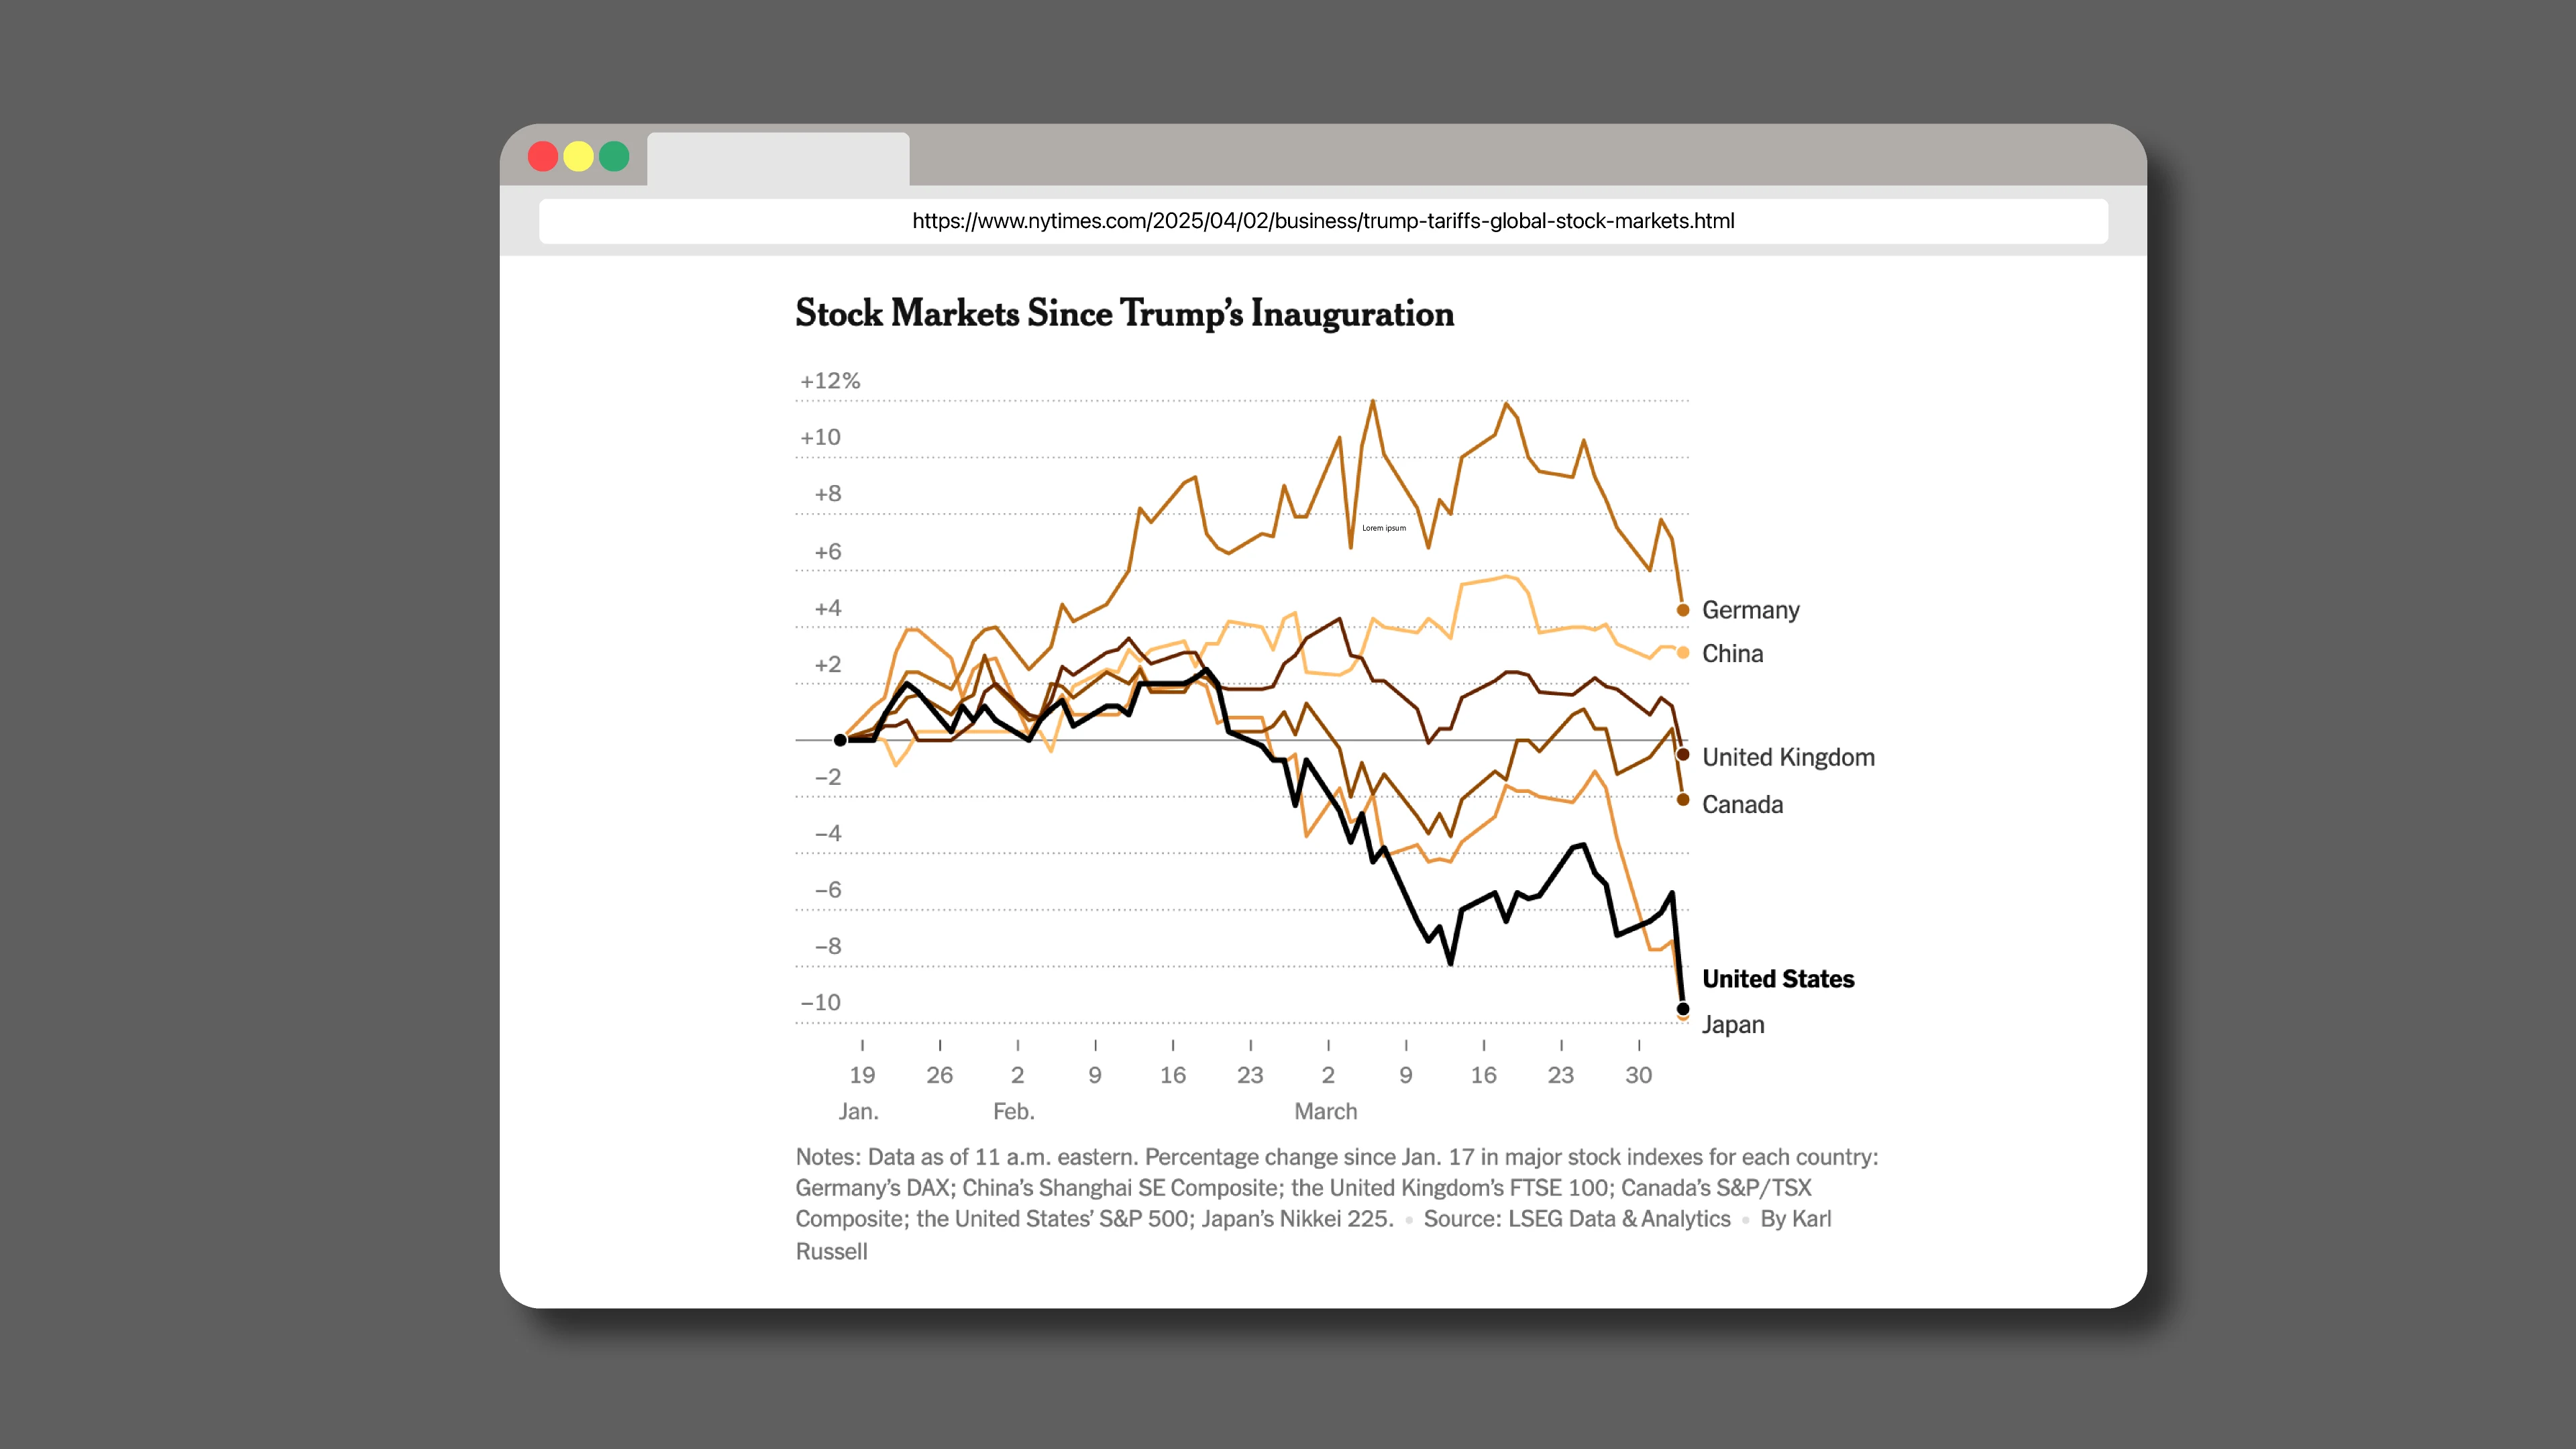
The graph shows percentage change in major stock indexes for Germany’s DAX, China’s Shanghai SE Composite, the United Kingdom’s FTSE 100, Canada’s S&P/TSX Composite, the United States’ S&P 500, and Japan’s Nikkei 225.
As of 9:30 a.m. Eastern, the S&P 500 plunged more than 4% since yesterday’s market close (amounting to a total 9% drop since Trump’s inauguration.) Major stocks in both Asian and European markets also slumped abruptly this morning. The graph suggests that Trump’s new tariffs are even harsher than most economists and investors feared.
What’s ahead
Less than a day after the tariff announcement, many analysts are predicting that American consumers should prepare for a spike in inflation.
To keep track of this rising cost of living, CBS News has created a price tracker for goods including groceries, new vehicles, used vehicles, parts, repairs, insurance premiums, and construction and manufacturing raw materials. According to the tool’s accompanying article, CBS plans to update the prices of groceries weekly (including heavily imported fruits and veggies like bananas and bell peppers), while the other categories will be updated every month.
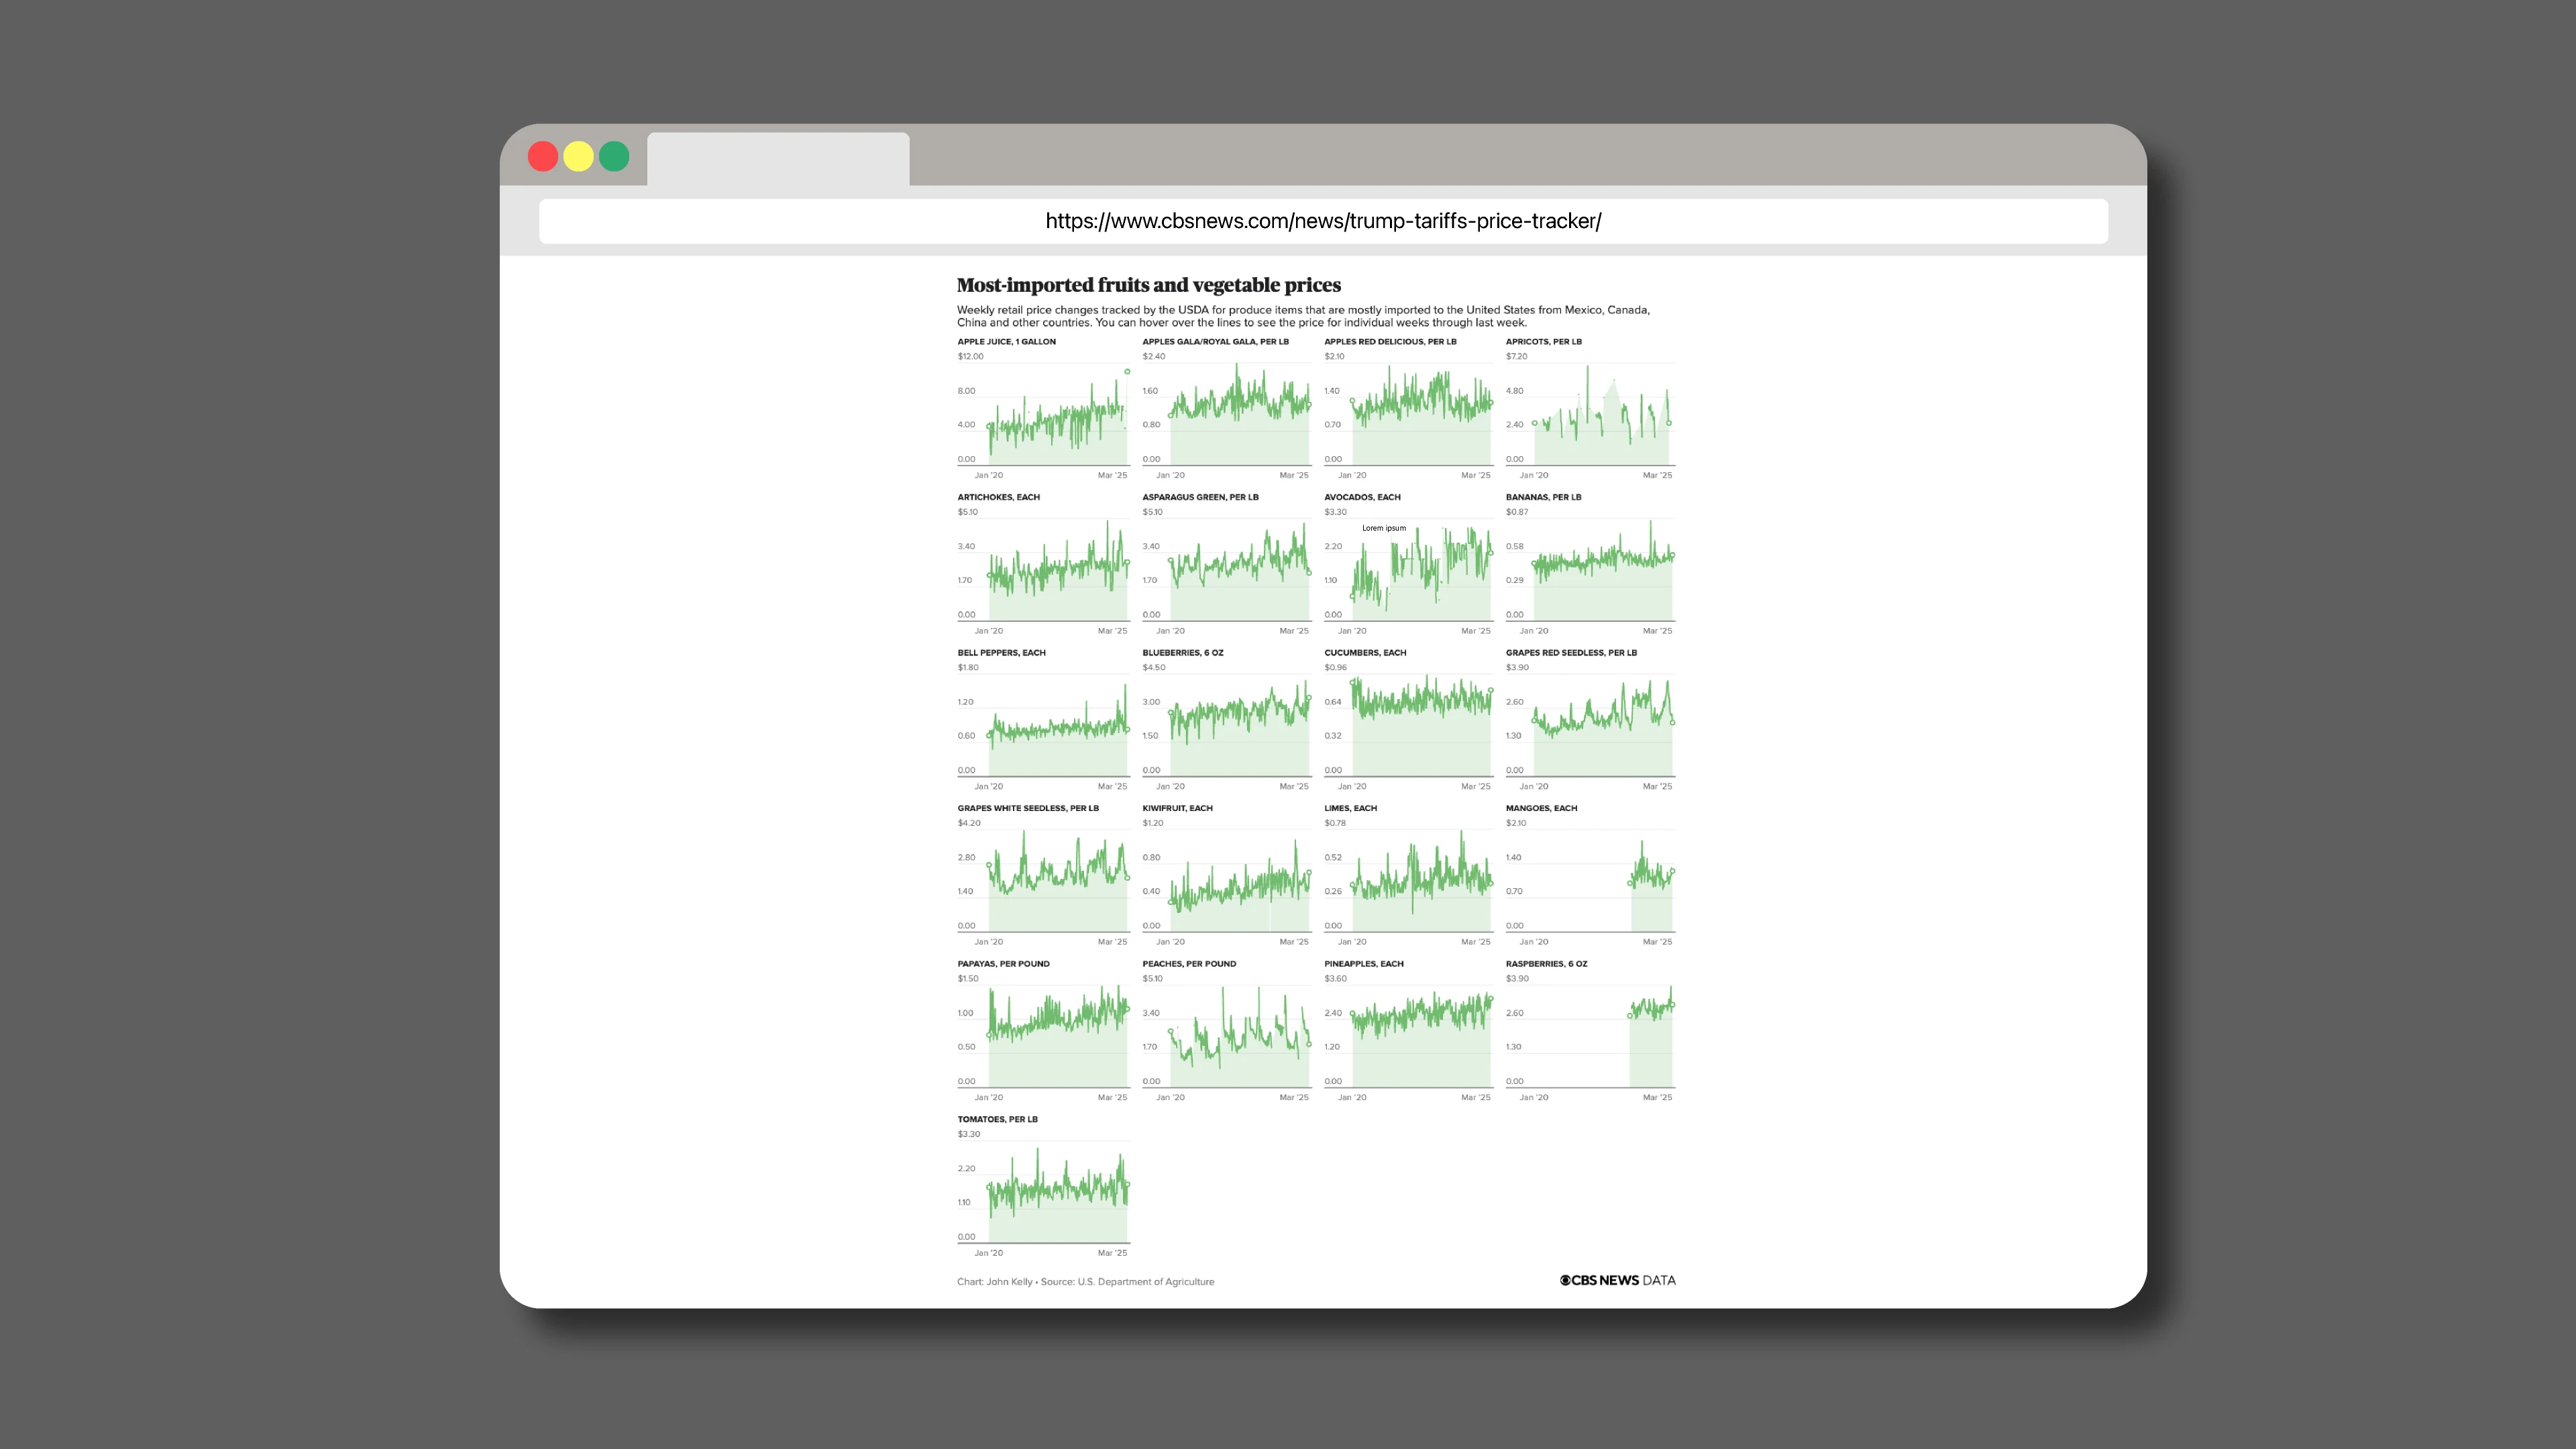
Over the coming weeks, the price tracker could help consumers understand how the cost of essential goods is changing as a result of the new tariffs. In an interview with CNBC, David Rosenberg, president and founder of the market research firm Rosenberg Research, warned, “we’re in for several months of a very significant price shock for the American household sector.”


%20Abstract%20Background%20112024%20SOURCE%20Amazon.jpg)


![[The AI Show Episode 142]: ChatGPT’s New Image Generator, Studio Ghibli Craze and Backlash, Gemini 2.5, OpenAI Academy, 4o Updates, Vibe Marketing & xAI Acquires X](https://www.marketingaiinstitute.com/hubfs/ep%20142%20cover.png)











-Nintendo-Switch-2-–-Overview-trailer-00-00-10.png?width=1920&height=1920&fit=bounds&quality=80&format=jpg&auto=webp#)


_Anna_Berkut_Alamy.jpg?#)


![YouTube Announces New Creation Tools for Shorts [Video]](https://www.iclarified.com/images/news/96923/96923/96923-640.jpg)




![[Weekly funding roundup March 29-April 4] Steady-state VC inflow pre-empts Trump tariff impact](https://images.yourstory.com/cs/2/220356402d6d11e9aa979329348d4c3e/WeeklyFundingRoundupNewLogo1-1739546168054.jpg)


