Building a React-Based Analytics Dashboard from Scratch (3-Parts in One Guide)
In this comprehensive guide, we’ll walk through building a React-based analytics dashboard from scratch. We’ll cover everything from project setup and data visualization to real-time updates. By the end, you’ll have a fully functional dashboard that you can customize and deploy for your own projects. Let’s dive in! Part 1: Setting Up the Foundation Step 1: Initialize the Project We’ll use Vite for a fast and modern React setup. Run the following commands to get started: npm create vite@latest react-analytics-dashboard --template react cd react-analytics-dashboard npm install npm run dev Step 2: Install Essential Libraries We’ll need a few libraries for routing, data fetching, and styling: npm install react-router-dom axios tailwindcss chart.js react-chartjs-2 Step 3: Set Up the Folder Structure Organize your project like this: src/ ├── components/ │ ├── Header.jsx │ ├── Sidebar.jsx │ ├── Chart.jsx ├── pages/ │ ├── Dashboard.jsx │ ├── Analytics.jsx ├── App.jsx ├── main.jsx Step 4: Create Basic Components Here’s a simple Header and Sidebar component: // src/components/Header.jsx export default function Header() { return ( Analytics Dashboard ); } // src/components/Sidebar.jsx export default function Sidebar() { return ( Dashboard Analytics ); } Step 5: Set Up Routing Update App.jsx to include routing: // src/App.jsx import { BrowserRouter as Router, Routes, Route } from 'react-router-dom'; import Header from './components/Header'; import Sidebar from './components/Sidebar'; import Dashboard from './pages/Dashboard'; import Analytics from './pages/Analytics'; export default function App() { return ( ); } Part 2: Data Visualization with Charting Libraries Step 1: Create a Reusable Chart Component We’ll use Chart.js and react-chartjs-2 for visualization. Here’s how to create a reusable Chart component: // src/components/Chart.jsx import { Bar } from 'react-chartjs-2'; import { Chart as ChartJS, CategoryScale, LinearScale, BarElement, Title, Tooltip, Legend } from 'chart.js'; ChartJS.register(CategoryScale, LinearScale, BarElement, Title, Tooltip, Legend); export default function Chart({ data, title }) { const options = { responsive: true, plugins: { legend: { position: 'top' }, title: { display: true, text: title }, }, }; return ; } Step 2: Add Sample Data to the Dashboard Update the Dashboard.jsx page to display a bar chart: // src/pages/Dashboard.jsx import Chart from '../components/Chart'; const dashboardData = { labels: ['January', 'February', 'March', 'April', 'May', 'June', 'July'], datasets: [ { label: 'Sales', data: [65, 59, 80, 81, 56, 55, 40], backgroundColor: 'rgba(75, 192, 192, 0.2)', borderColor: 'rgba(75, 192, 192, 1)', borderWidth: 1, }, ], }; export default function Dashboard() { return ( Dashboard ); } Part 3: Real-Time Updates and Advanced Features Step 1: Set Up Real-Time Data with WebSockets We’ll use WebSockets to push real-time updates to the dashboard. First, install a WebSocket library: npm install socket.io-client Step 2: Create a WebSocket Connection Update the Dashboard.jsx to include real-time data: // src/pages/Dashboard.jsx import { useEffect, useState } from 'react'; import io from 'socket.io-client'; import Chart from '../components/Chart'; const socket = io('http://localhost:4000'); // Replace with your backend URL export default function Dashboard() { const [data, setData] = useState({ labels: [], datasets: [{ label: 'Real-Time Sales', data: [], backgroundColor: 'rgba(255, 99, 132, 0.2)' }], }); useEffect(() => { socket.on('dataUpdate', (newData) => { setData((prev) => ({ labels: [...prev.labels, newData.label], datasets: [ { ...prev.datasets[0], data: [...prev.datasets[0].data, newData.value], }, ], })); }); return () => socket.disconnect(); }, []); return ( Real-Time Dashboard ); } Step 3: Deploy Your Dashboard Deploy your dashboard using Vercel or Netlify: Push your code to GitHub. Connect your repository to Vercel/Netlify. Deploy! Final Thoughts Congratulations! You’ve built a React-based analytics dashboard with real-time updates. This project can be extended with features like user authentication, additional chart types, or integration with third-party APIs. Happy coding!
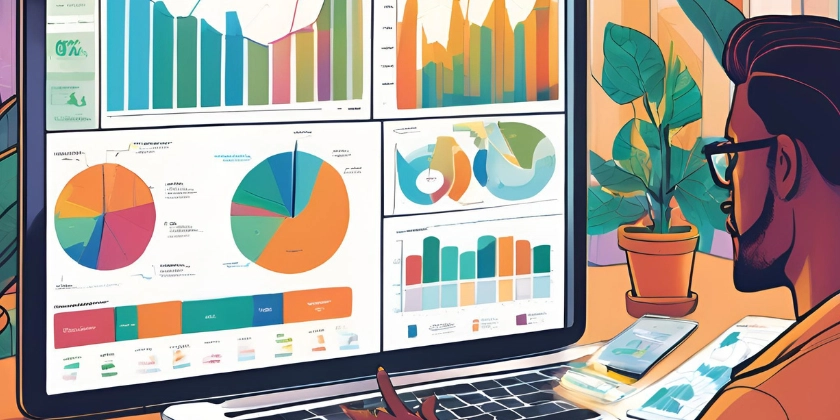
In this comprehensive guide, we’ll walk through building a React-based analytics dashboard from scratch. We’ll cover everything from project setup and data visualization to real-time updates. By the end, you’ll have a fully functional dashboard that you can customize and deploy for your own projects.
Let’s dive in!
Part 1: Setting Up the Foundation
Step 1: Initialize the Project
We’ll use Vite for a fast and modern React setup. Run the following commands to get started:
npm create vite@latest react-analytics-dashboard --template react
cd react-analytics-dashboard
npm install
npm run dev
Step 2: Install Essential Libraries
We’ll need a few libraries for routing, data fetching, and styling:
npm install react-router-dom axios tailwindcss chart.js react-chartjs-2
Step 3: Set Up the Folder Structure
Organize your project like this:
src/
├── components/
│   ├── Header.jsx
│   ├── Sidebar.jsx
│   ├── Chart.jsx
├── pages/
│   ├── Dashboard.jsx
│   ├── Analytics.jsx
├── App.jsx
├── main.jsx
Step 4: Create Basic Components
Here’s a simple Header and Sidebar component:
// src/components/Header.jsx
export default function Header() {
  return (
    <header className="bg-blue-500 text-white p-4">
      <h1 className="text-2xl font-bold">Analytics Dashboardh1>
    header>
  );
}
// src/components/Sidebar.jsx
export default function Sidebar() {
  return (
    <aside className="bg-gray-800 text-white w-64 p-4">
      <nav>
        <ul>
          <li className="mb-2">
            <a href="/dashboard" className="hover:text-blue-500">Dashboarda>
          li>
          <li>
            <a href="/analytics" className="hover:text-blue-500">Analyticsa>
          li>
        ul>
      nav>
    aside>
  );
}
Step 5: Set Up Routing
Update App.jsx to include routing:
// src/App.jsx
import { BrowserRouter as Router, Routes, Route } from 'react-router-dom';
import Header from './components/Header';
import Sidebar from './components/Sidebar';
import Dashboard from './pages/Dashboard';
import Analytics from './pages/Analytics';

export default function App() {
  return (
    <Router>
      <div className="flex">
        <Sidebar />
        <div className="flex-1">
          <Header />
          <Routes>
            <Route path="/dashboard" element={<Dashboard />} />
            <Route path="/analytics" element={<Analytics />} />
          Routes>
        div>
      div>
    Router>
  );
}
Part 2: Data Visualization with Charting Libraries
Step 1: Create a Reusable Chart Component
We’ll use Chart.js and react-chartjs-2 for visualization. Here’s how to create a reusable Chart component:
// src/components/Chart.jsx
import { Bar } from 'react-chartjs-2';
import { Chart as ChartJS, CategoryScale, LinearScale, BarElement, Title, Tooltip, Legend } from 'chart.js';

ChartJS.register(CategoryScale, LinearScale, BarElement, Title, Tooltip, Legend);

export default function Chart({ data, title }) {
  const options = {
    responsive: true,
    plugins: {
      legend: { position: 'top' },
      title: { display: true, text: title },
    },
  };

  return <Bar data={data} options={options} />;
}
Step 2: Add Sample Data to the Dashboard
Update the Dashboard.jsx page to display a bar chart:
// src/pages/Dashboard.jsx
import Chart from '../components/Chart';

const dashboardData = {
  labels: ['January', 'February', 'March', 'April', 'May', 'June', 'July'],
  datasets: [
    {
      label: 'Sales',
      data: [65, 59, 80, 81, 56, 55, 40],
      backgroundColor: 'rgba(75, 192, 192, 0.2)',
      borderColor: 'rgba(75, 192, 192, 1)',
      borderWidth: 1,
    },
  ],
};

export default function Dashboard() {
  return (
    <div className="p-6">
      <h2 className="text-xl font-bold mb-4">Dashboardh2>
      <Chart data={dashboardData} title="Monthly Sales Data" />
    div>
  );
}
Part 3: Real-Time Updates and Advanced Features
Step 1: Set Up Real-Time Data with WebSockets
We’ll use WebSockets to push real-time updates to the dashboard. First, install a WebSocket library:
npm install socket.io-client
Step 2: Create a WebSocket Connection
Update the Dashboard.jsx to include real-time data:
// src/pages/Dashboard.jsx
import { useEffect, useState } from 'react';
import io from 'socket.io-client';
import Chart from '../components/Chart';

const socket = io('http://localhost:4000'); // Replace with your backend URL

export default function Dashboard() {
  const [data, setData] = useState({
    labels: [],
    datasets: [{ label: 'Real-Time Sales', data: [], backgroundColor: 'rgba(255, 99, 132, 0.2)' }],
  });

  useEffect(() => {
    socket.on('dataUpdate', (newData) => {
      setData((prev) => ({
        labels: [...prev.labels, newData.label],
        datasets: [
          {
            ...prev.datasets[0],
            data: [...prev.datasets[0].data, newData.value],
          },
        ],
      }));
    });

    return () => socket.disconnect();
  }, []);

  return (
    <div className="p-6">
      <h2 className="text-xl font-bold mb-4">Real-Time Dashboardh2>
      <Chart data={data} title="Real-Time Sales Data" />
    div>
  );
}
Step 3: Deploy Your Dashboard
Deploy your dashboard using Vercel or Netlify:
- Push your code to GitHub.
- Connect your repository to Vercel/Netlify.
- Deploy!
Final Thoughts
Congratulations! You’ve built a React-based analytics dashboard with real-time updates. This project can be extended with features like user authentication, additional chart types, or integration with third-party APIs.
Happy coding!




![[The AI Show Episode 142]: ChatGPT’s New Image Generator, Studio Ghibli Craze and Backlash, Gemini 2.5, OpenAI Academy, 4o Updates, Vibe Marketing & xAI Acquires X](https://www.marketingaiinstitute.com/hubfs/ep%20142%20cover.png)

















![[FREE EBOOKS] The Kubernetes Bible, The Ultimate Linux Shell Scripting Guide & Four More Best Selling Titles](https://www.javacodegeeks.com/wp-content/uploads/2012/12/jcg-logo.jpg)


![From drop-out to software architect with Jason Lengstorf [Podcast #167]](https://cdn.hashnode.com/res/hashnode/image/upload/v1743796461357/f3d19cd7-e6f5-4d7c-8bfc-eb974bc8da68.png?#)








.png?#)


.jpg?#)




_Christophe_Coat_Alamy.jpg?#)








![Rapidus in Talks With Apple as It Accelerates Toward 2nm Chip Production [Report]](https://www.iclarified.com/images/news/96937/96937/96937-640.jpg)


