My first Aya program
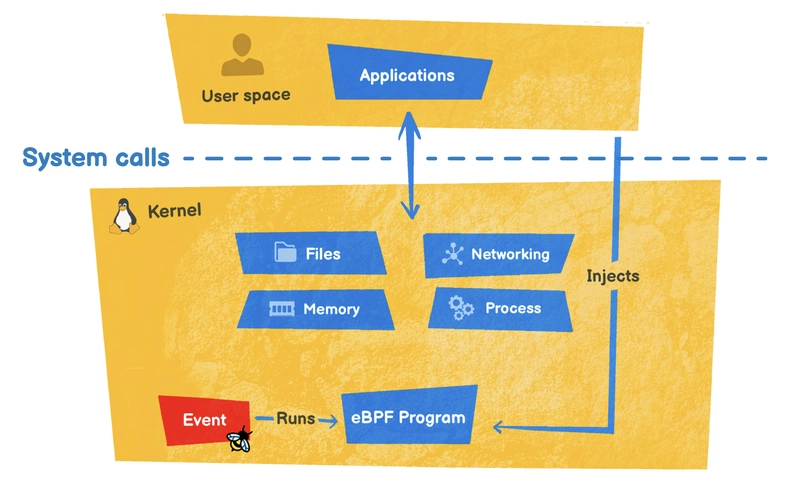
I'm getting started with eBPF programming with Aya. The idea behind this series of articles is to get you started too. In this section, we'll create our first Aya program. We'll also see that there are different types of eBPF programs. FYI, this is the English version of an article originally published in French. Example of Hello world Program I assume you have an operating environment as defined in Part 1. You can also follow this step-by-step lab on creating an Aya program: killercoda.com Types of eBPF programs To generate an Aya program, we'll use cargo generate : cargo generate https://github.com/aya-rs/aya-template We're going to answer a few questions: Project Name: the name of the project (I put test-aya) The second question is more interesting: In fact, there are different types of eBPF programs. As we saw in Part 1, I wrote that there are 3 types of eBPF software: Network Observability and Tracing Security The choices presented to generate the eBPF program are, in fact, parts of the Linux kernel that can be modified or supervised by eBPF. So you need to think carefully about this before jumping headlong into programming. As I wrote in Part 1, Aya is not yet fully mature compared with other solutions. Here's one reason why: although it may seem as if there are already a lot of program types available, there are still quite a few missing: Meta: Add Support For All BPF Program Types #205 dave-tucker posted on Jan 31, 2022 [x] BPF_PROG_TYPE_SOCKET_FILTER [x] BPF_PROG_TYPE_KPROBE [x] BPF_PROG_TYPE_SCHED_CLS [ ] #206 [x] BPF_PROG_TYPE_TRACEPOINT [x] BPF_PROG_TYPE_XDP [x] #207 [x] BPF_PROG_TYPE_CGROUP_SKB [x] #208 [ ] #209 [ ] #210 [ ] #211 [x] BPF_PROG_TYPE_SOCK_OPS [x] BPF_PROG_TYPE_SK_SKB [x] #212 [x] BPF_PROG_TYPE_SK_MSG [x] BPF_PROG_TYPE_RAW_TRACEPOINT [x] #213 [ ] #214 [x] BPF_PROG_TYPE_LIRC_MODE2 [ ] #215 [ ] #216 [x] #217 [ ] #218 [ ] #219 [x] BPF_PROG_TYPE_TRACING [ ] #220 [x] BPF_PROG_TYPE_EXT [x] BPF_PROG_TYPE_LSM [x] #223 [ ] #221 View on GitHub What's more, as the Linux kernel continues to evolve, there will certainly be other types of eBPF programs available in the near future. Time to choose I tested a few types of eBPF program with Aya before writing this article. To study each type, you can quickly spend days: "I don't understand, it doesn't work" is certainly the phrase I'm uttering the most at the moment. There aren't many similarities between eBPF program types. If you've already played with XDP programs, you'll have other problems with Kprobe programs, for example. For this article, we'll be looking at TracePoint eBPF programs. TracePoint Tracepoints are, as the name suggests, places in the Linux code that have been marked (see recommendations). They are mainly used for tracing and debugging the Linux kernel. All these points are accessible in the /sys/kernel/debug/tracing/available_events file: They are in the format: [Category]:[Name] Just in time, this is the supplementary question we ask: We're going to choose syscalls because everyone knows what a syscall is. Does everyone? Syscalls When a program is run, it asks the kernel to perform primary functions called syscalls (system calls). To view the syscalls performed when a command is run, you can use the strace program. For example, you can use: Which syscall to use To find available tracepoint names, simply issue this command: grep syscalls: /sys/kernel/debug/tracing/available_events We can see that they are of the : sys_(enter|exit)_$name_of_syscall enter : starting of syscall exit : closing of syscall We'll arbitrarily choose execve, which is the syscall that executes a program and the one that starts the syscall. So we have sys_enter_execve. Test Now we're going to test the generated program directly: cd test-aya RUST_LOG=info cargo run This will take a little while: the time it takes to download and compile all the dependencies. Now you can go and have a cup of coffee! Once your program has been demarched, run commands on another terminal, e.g.: ls On the cargo run terminal, you'll see the following message every time you type a command: [INFO test_aya] tracepoint sys_enter_execve called So every time the syscall execve is called, this message will be displayed. We've just created the "Hello World" of the Tracepoint eBPF program (syscall:sys_enter_execve). So, for an eBPF program to start up, it needs an event (event-driven) that tells it to run: this is what we call a hook. Anatomy of a Hello world Aya program Let's take a look at what the cargo generate command has generated. As we saw in part 1, there are two parts to an eBPF program: kernel space and user space.

I'm getting started with eBPF programming with Aya. The idea behind this series of articles is to get you started too.
In this section, we'll create our first Aya program. We'll also see that there are different types of eBPF programs.
FYI, this is the English version of an article originally published in French.
Example of Hello world Program
I assume you have an operating environment as defined in Part 1. You can also follow this step-by-step lab on creating an Aya program:
Types of eBPF programs
To generate an Aya program, we'll use cargo generate :
cargo generate https://github.com/aya-rs/aya-template
We're going to answer a few questions:
-
Project Name: the name of the project (I puttest-aya) - The second question is more interesting:
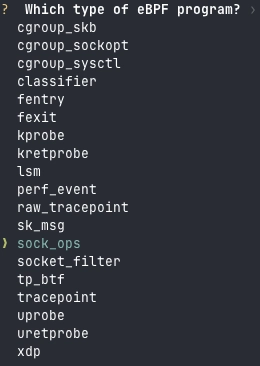
In fact, there are different types of eBPF programs. As we saw in Part 1, I wrote that there are 3 types of eBPF software:
- Network
- Observability and Tracing
- Security
The choices presented to generate the eBPF program are, in fact, parts of the Linux kernel that can be modified or supervised by eBPF. So you need to think carefully about this before jumping headlong into programming.
As I wrote in Part 1, Aya is not yet fully mature compared with other solutions. Here's one reason why: although it may seem as if there are already a lot of program types available, there are still quite a few missing:
 Meta: Add Support For All BPF Program Types
#205
- [x] BPF_PROG_TYPE_SOCKET_FILTER
- [x] BPF_PROG_TYPE_KPROBE
- [x] BPF_PROG_TYPE_SCHED_CLS
- [ ] #206
- [x] BPF_PROG_TYPE_TRACEPOINT
- [x] BPF_PROG_TYPE_XDP
- [x] #207
- [x] BPF_PROG_TYPE_CGROUP_SKB
- [x] #208
- [ ] #209
- [ ] #210
- [ ] #211
- [x] BPF_PROG_TYPE_SOCK_OPS
- [x] BPF_PROG_TYPE_SK_SKB
- [x] #212
- [x] BPF_PROG_TYPE_SK_MSG
- [x] BPF_PROG_TYPE_RAW_TRACEPOINT
- [x] #213
- [ ] #214
- [x] BPF_PROG_TYPE_LIRC_MODE2
- [ ] #215
- [ ] #216
- [x] #217
- [ ] #218
- [ ] #219
- [x] BPF_PROG_TYPE_TRACING
- [ ] #220
- [x] BPF_PROG_TYPE_EXT
- [x] BPF_PROG_TYPE_LSM
- [x] #223
- [ ] #221
What's more, as the Linux kernel continues to evolve, there will certainly be other types of eBPF programs available in the near future.
Time to choose
I tested a few types of eBPF program with Aya before writing this article. To study each type, you can quickly spend days: "I don't understand, it doesn't work" is certainly the phrase I'm uttering the most at the moment. There aren't many similarities between eBPF program types. If you've already played with XDP programs, you'll have other problems with Kprobe programs, for example. For this article, we'll be looking at TracePoint eBPF programs.
TracePoint
Tracepoints are, as the name suggests, places in the Linux code that have been marked (see recommendations). They are mainly used for tracing and debugging the Linux kernel.
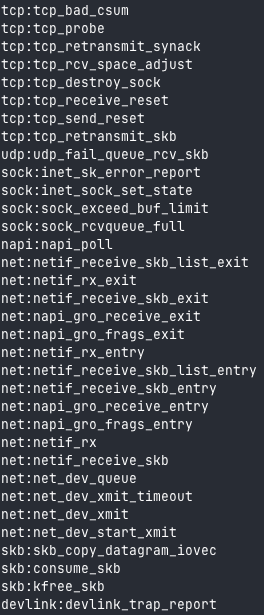
All these points are accessible in the /sys/kernel/debug/tracing/available_events file:
They are in the format:
[Category]:[Name]
Just in time, this is the supplementary question we ask:
We're going to choose syscalls because everyone knows what a syscall is. Does everyone?
Syscalls
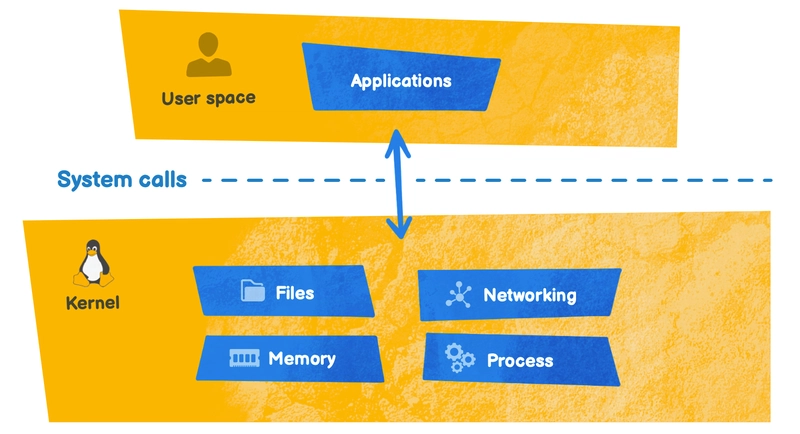
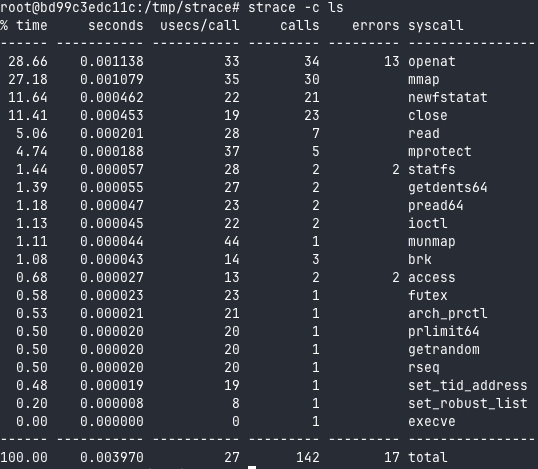
When a program is run, it asks the kernel to perform primary functions called syscalls (system calls).
To view the syscalls performed when a command is run, you can use the strace program. For example, you can use:
Which syscall to use
To find available tracepoint names, simply issue this command:
grep syscalls: /sys/kernel/debug/tracing/available_events
We can see that they are of the : sys_(enter|exit)_$name_of_syscall
-
enter: starting of syscall -
exit: closing of syscall
We'll arbitrarily choose execve, which is the syscall that executes a program and the one that starts the syscall. So we have sys_enter_execve.
Test
Now we're going to test the generated program directly:
cd test-aya
RUST_LOG=info cargo run
This will take a little while: the time it takes to download and compile all the dependencies. Now you can go and have a cup of coffee!
Once your program has been demarched, run commands on another terminal, e.g.: ls
On the cargo run terminal, you'll see the following message every time you type a command:
[INFO test_aya] tracepoint sys_enter_execve called
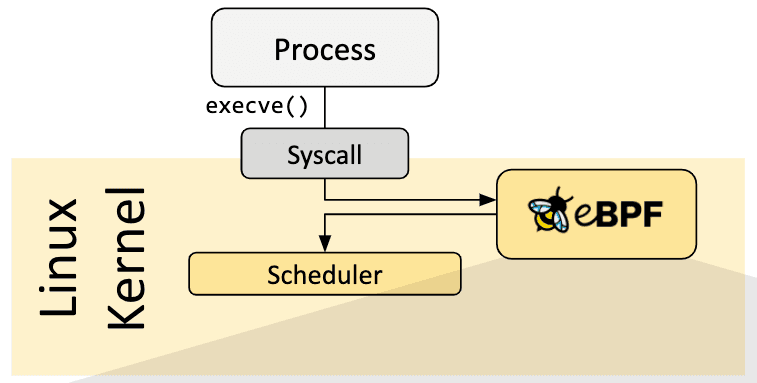
So every time the syscall execve is called, this message will be displayed. We've just created the "Hello World" of the Tracepoint eBPF program (syscall:sys_enter_execve). So, for an eBPF program to start up, it needs an event (event-driven) that tells it to run: this is what we call a hook.
Anatomy of a Hello world Aya program
Let's take a look at what the cargo generate command has generated. As we saw in part 1, there are two parts to an eBPF program: kernel space and user space.
Kernel space
The eBPF program source code can be found here: test-aya-ebpf/src/main.rs. It is compiled first.
Here are its contents:
#![no_std]
#![no_main]

use aya_ebpf::{macros::tracepoint, programs::TracePointContext};
use aya_log_ebpf::info;

#[tracepoint]
pub fn test_aya(ctx: TracePointContext) -> u32 {
    match try_test_aya(ctx) {
        Ok(ret) => ret,
        Err(ret) => ret,
    }
}

fn try_test_aya(ctx: TracePointContext) -> Result<u32, u32> {
    info!(&ctx, "tracepoint sys_enter_execve called");
    Ok(0)
}

#[cfg(not(test))]
#[panic_handler]
fn panic(_info: &core::panic::PanicInfo) -> ! {
    loop {}
}
If you've been following part 1, there's one thing that should already shock you about Rust code: there is no main() function. This is a prerequisite for writing an eBPF program. To overcome this problem, we use the notation: #![no_main]
Another more disturbing prerequisite is that the standard library (std) is forbidden. Only the core library and all libraries that use it are allowed. This means you can't use the println! macro. To tell Rust not to use the standard: #![no_std]
But then how are we going to display anything if println! isn't possible? That's where Aya comes to the rescue: use aya_log_ebpf::info;
This library can be used to display messages if the RUST_LOG environment variable is set. It also includes warn, error, debug and trace (see documentation).
Thanks to this library, you can display :
info!(&ctx, "tracepoint sys_enter_execve called");
We're going to discard this part of the program:
#[cfg(not(test))]
#[panic_handler]
fn panic(_info: &core::panic::PanicInfo) -> ! {
    loop {}
}
Don't panic! We'll never change it. It's the code that makes the program work.
All that's left is to explain :
use aya_ebpf::{macros::tracepoint, programs::TracePointContext};

#[tracepoint]
pub fn test_aya(ctx: TracePointContext) -> u32 {
    match try_test_aya(ctx) {
        Ok(ret) => ret,
        Err(ret) => ret,
    }
}

fn try_test_aya(ctx: TracePointContext) -> Result<u32, u32> {
    Ok(0)
}
Two aya_ebpf libraries are used, including one for the tracepoint macro:
#[tracepoint] //here
pub fn test_aya(ctx: TracePointContext) -> u32 {
...
}
In other words, we're going to create an eBPF tracepoint program with the function test_aya().
The pub keyword is to say that the function is public; it's not really “important”, it's just to make the Aya framework work. If we remove these unwanted elements:
use aya_ebpf::programs::TracePointContext;

fn test_aya(ctx: TracePointContext) -> u32 {
    match try_test_aya(ctx) {
        Ok(ret) => ret,
        Err(ret) => ret,
    }
}

fn try_test_aya(ctx: TracePointContext) -> Result<u32, u32> {
    Ok(0)
}
We're back to a few things we've already seen in part 1.
Things to remember:
- the
test_aya()function is attached to the tracepoint program. - All the work will be done in the
try_test_aya()function. -
ctx: this is the context variable that will enable us to go beyond a hello world program.
As you can see, there's no mention of syscalls for the moment. I want this Tracepoint program to be attached to an execve syscall. Good timing: let's take a look at the user-space code now.
User space
In this article, we won't be modifying the user space code. It can be found in this file: test-aya/src/main.rs.
I'll simplify its code for a better understanding:
use aya::programs::TracePoint;
use log::{debug, warn};
use tokio::signal;

#[tokio::main]
async fn main() -> anyhow::Result<()> {
    let mut ebpf = aya::Ebpf::load(aya::include_bytes_aligned!(concat!(
        env!("OUT_DIR"),
        "/test-aya"
    )))?; //1
    if let Err(e) = aya_log::EbpfLogger::init(&mut ebpf) {
        warn!("failed to initialize eBPF logger: {}", e);
    } //2
    let program: &mut TracePoint = ebpf.program_mut("test_aya").unwrap().try_into()?; //3
    program.load()?; //4
    program.attach("syscalls", "sys_enter_execve")?; //5

    let ctrl_c = signal::ctrl_c();
    println!("Waiting for Ctrl-C...");
    ctrl_c.await?;
    println!("Exiting...");

    Ok(())
}
This Rust code is a little more traditional: you can use the standard library, as evidenced by the println! and the main() function.
I've commented out the important parts of the code with numbers:
- 1: We'll load the previously compiled eBPF code into an ebpf variable
- 2: We'll start displaying the eBPF logs (for example, the
info!from the previous code) in the user space - 3: Convert the main function of the eBPF code into Tracepoint code
- 4: Load the main program function (the
test_aya()function) - 5: Attach it to the tracepoint syscalls:sys_enter_execve
The rest of the code is for program operation, such as not quitting the program before the logs start.
If you're new to Rust, there are certainly some parts of the code that may seem obscure to you. That's a good thing! The next section is dedicated to Rust.
Rust, it's getting complicated!
Before modifying the code, I think it's worth reviewing the Rust language a little more theoretically. I didn't want to scare you too much in part 1












![[The AI Show Episode 143]: ChatGPT Revenue Surge, New AGI Timelines, Amazon’s AI Agent, Claude for Education, Model Context Protocol & LLMs Pass the Turing Test](https://www.marketingaiinstitute.com/hubfs/ep%20143%20cover.png)
























![From drop-out to software architect with Jason Lengstorf [Podcast #167]](https://cdn.hashnode.com/res/hashnode/image/upload/v1743796461357/f3d19cd7-e6f5-4d7c-8bfc-eb974bc8da68.png?#)













.jpg?#)







_ArtemisDiana_Alamy.jpg?#)


 (1).webp?#)








-xl.jpg)


![Yes, the Gemini icon is now bigger and brighter on Android [U]](https://i0.wp.com/9to5google.com/wp-content/uploads/sites/4/2025/02/Gemini-on-Galaxy-S25.jpg?resize=1200%2C628&quality=82&strip=all&ssl=1)


![Apple Rushes Five Planes of iPhones to US Ahead of New Tariffs [Report]](https://www.iclarified.com/images/news/96967/96967/96967-640.jpg)
![Apple Vision Pro 2 Allegedly in Production Ahead of 2025 Launch [Rumor]](https://www.iclarified.com/images/news/96965/96965/96965-640.jpg)


