


![[The AI Show Episode 144]: ChatGPT’s New Memory, Shopify CEO’s Leaked “AI First” Memo, Google Cloud Next Releases, o3 and o4-mini Coming Soon & Llama 4’s Rocky Launch](https://www.marketingaiinstitute.com/hubfs/ep%20144%20cover.png)


![Blue Archive tier list [April 2025]](https://media.pocketgamer.com/artwork/na-33404-1636469504/blue-archive-screenshot-2.jpg?#)


.png?#)


.png?width=1920&height=1920&fit=bounds&quality=70&format=jpg&auto=webp#)


.webp?#)


![[Update: Optional] Google rolling out auto-restart security feature to Android](https://i0.wp.com/9to5google.com/wp-content/uploads/sites/4/2025/01/google-play-services-2.jpg?resize=1200%2C628&quality=82&strip=all&ssl=1)


![Apple Releases iOS 18.4.1 and iPadOS 18.4.1 [Download]](https://www.iclarified.com/images/news/97043/97043/97043-640.jpg)
![Apple Releases visionOS 2.4.1 for Vision Pro [Download]](https://www.iclarified.com/images/news/97046/97046/97046-640.jpg)
![Apple Vision 'Air' Headset May Feature Titanium and iPhone 5-Era Black Finish [Rumor]](https://www.iclarified.com/images/news/97040/97040/97040-640.jpg)


Investigating PostgreSQL's `ANALYZE` Runtime Behavior: Sampling, Table Size, and Cache Effects
PostgreSQL's ANALYZE command is designed to collect statistics for the query planner by sampling a fixed number of pages from a table. As per the documentation, when default_statistics_target is 100, the sample size is 30,000 pages (or less, if the table is samll and does not have 30K pages). This leads to a reasonable assumption: the runtime of ANALYZE should be independent of the table size, given that the number of pages sampled is constant. However, experimental evidence suggests otherwise. Experiment Setup We created five PostgreSQL tables of increasing size, from 100,000 to 400 million rows, using the following SQL: create table t(n) with (autovacuum_enabled = false) as select generate_series(1, N); For each table, we recorded (on a MacBook Air M3 with 24 GB RAM): Table size (in MB and number of pages) Analyze time under three conditions: First time after table creation Subsequent runs with data in cache After purging OS and PostgreSQL cache using: brew services stop postgresql@17 \ && sync \ && sudo purge \ && brew services start postgresql@17 On Linux, use the following: sudo systemctl stop postgresql \ && sync \ && sudo sh -c 'echo 3 > /proc/sys/vm/drop_caches' \ && sudo systemctl start postgresql Results Rows Size (MB) Pages First Analyze (ms) Subsequent Analyze (ms) After Cache Purge (ms) 100,000 4 448 26 22 38 1,000,000 35 4,480 73 51 58 10,000,000 346 44,288 299 209 1,461 100,000,000 3,457 442,496 459 454 7,161 400,000,000 13,827 1,769,920 1,426 1,459 8,630 Visualization The above chart shows that even though PostgreSQL samples a fixed number of pages, the ANALYZE runtime increases with table size, especially after purging caches. Possible Explanation: Reservoir Sampling Complexity One explanation lies in how PostgreSQL implements sampling. PostgreSQL uses reservoir sampling, a technique that allows uniform random sampling from a stream (i.e., the full table). While the sample size is fixed (e.g., 30,000 pages), the time complexity of the algorithm is not constant. In the naive implementation, it's linear, while in the optimized versions, it's logarithmic (in the number of items being sampled). PostgreSQL uses Vitter's Reservoir Sampling Algorithm Z: /* * These two routines embody Algorithm Z from "Random sampling with a * reservoir" by Jeffrey S. Vitter, in ACM Trans. Math. Softw. 11, 1 * (Mar. 1985), Pages 37-57. Vitter describes his algorithm in terms * of the count S of records to skip before processing another record. * It is computed primarily based on t, the number of records already read. * The only extra state needed between calls is W, a random state variable. * * reservoir_init_selection_state computes the initial W value. * * Given that we've already read t records (t >= n), reservoir_get_next_S * determines the number of records to skip before the next record is * processed. */ It also uses Knuth's optimized version called Algorithm S, where the total number of data to be sampled is known in advance. /* * Since we know the total number of blocks in advance, we can use the * straightforward Algorithm S from Knuth 3.4.2, rather than Vitter's * algorithm. */ The source code actually mentions that the implemented algorithm may deviate from Algorithm S: /* * It is not obvious that this code matches Knuth's Algorithm S. * Knuth says to skip the current block with probability 1 - k/K. * If we are to skip, we should advance t (hence decrease K), and * repeat the same probabilistic test for the next block. */ This means PostgreSQL must touch all pages of the table to decide whether to include them in the sample, even if it eventually keeps only 30,000 of them. This explains why larger tables take longer to ANALYZE. But, all in all, it still seems that analyze runtime depends considerably - even linearly - on the table size! In an email to Postgres Hackers back in 2004, Manfred Koizar mentioned this: Playing around with some real numbers (for 100 tuples/page and a sample size of 3000) I got: rel | page size | reads ------+------------- 30 | 30 300 | 300 expectation is something like 299.9995 500 | 499 1K | 990 3K | 2.6K 30K | 8K 100K | 12K 1M | 19K 10M | 26K 100M | 33K This growth rate is steeper than O(log(nblocks)). I have an idea how this could be done with O(1) page reads. What I have in mind is a kind of "Double Vitter" algorithm. Whatever we do to get our sample of rows, in the end the sampled rows come from no more than sample_size different blocks. So my idea is to first create a random sample of sample_size block numbers, and then to sample the rows out of this pool of blocks. The idea is implemented in Postgres, as the source code refers to it. However, based on my experiments, the running time of analyze isn't O(1) or O(log(nblocks)), but rather O(nblocks).
PostgreSQL's ANALYZE command is designed to collect statistics for the query planner by sampling a fixed number of pages from a table. As per the documentation, when default_statistics_target is 100, the sample size is 30,000 pages (or less, if the table is samll and does not have 30K pages). This leads to a reasonable assumption: the runtime of ANALYZE should be independent of the table size, given that the number of pages sampled is constant.
However, experimental evidence suggests otherwise.
Experiment Setup
We created five PostgreSQL tables of increasing size, from 100,000 to 400 million rows, using the following SQL:
create table t(n)
with (autovacuum_enabled = false)
as select generate_series(1, N);
For each table, we recorded (on a MacBook Air M3 with 24 GB RAM):
- Table size (in MB and number of pages)
- Analyze time under three conditions:
- First time after table creation
- Subsequent runs with data in cache
- After purging OS and PostgreSQL cache using:
brew services stop postgresql@17 \
  && sync \
  && sudo purge \
  && brew services start postgresql@17
On Linux, use the following:
sudo systemctl stop postgresql \
 && sync \
 && sudo sh -c 'echo 3 > /proc/sys/vm/drop_caches' \
 && sudo systemctl start postgresql
Results
| Rows | Size (MB) | Pages | First Analyze (ms) | Subsequent Analyze (ms) | After Cache Purge (ms) |
|---|---|---|---|---|---|
| 100,000 | 4 | 448 | 26 | 22 | 38 |
| 1,000,000 | 35 | 4,480 | 73 | 51 | 58 |
| 10,000,000 | 346 | 44,288 | 299 | 209 | 1,461 |
| 100,000,000 | 3,457 | 442,496 | 459 | 454 | 7,161 |
| 400,000,000 | 13,827 | 1,769,920 | 1,426 | 1,459 | 8,630 |
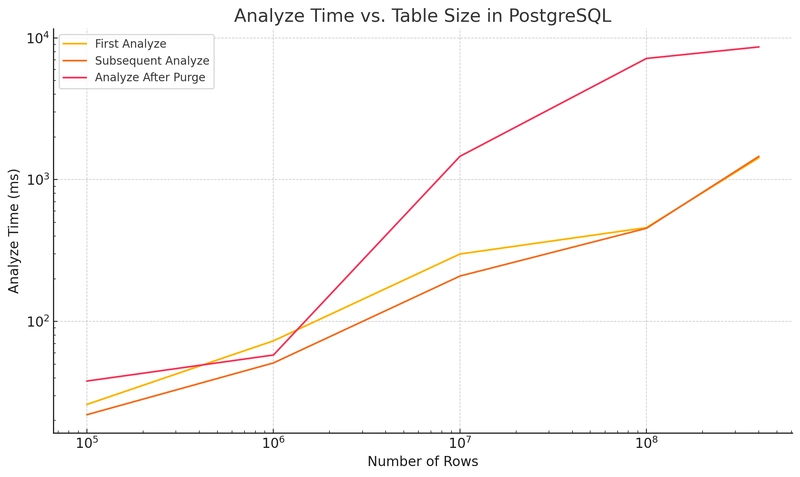
Visualization
The above chart shows that even though PostgreSQL samples a fixed number of pages, the ANALYZE runtime increases with table size, especially after purging caches.
Possible Explanation: Reservoir Sampling Complexity
One explanation lies in how PostgreSQL implements sampling. PostgreSQL uses reservoir sampling, a technique that allows uniform random sampling from a stream (i.e., the full table). While the sample size is fixed (e.g., 30,000 pages), the time complexity of the algorithm is not constant. In the naive implementation, it's linear, while in the optimized versions, it's logarithmic (in the number of items being sampled).
PostgreSQL uses Vitter's Reservoir Sampling Algorithm Z:
/*
 * These two routines embody Algorithm Z from "Random sampling with a
 * reservoir" by Jeffrey S. Vitter, in ACM Trans. Math. Softw. 11, 1
 * (Mar. 1985), Pages 37-57.  Vitter describes his algorithm in terms
 * of the count S of records to skip before processing another record.
 * It is computed primarily based on t, the number of records already read.
 * The only extra state needed between calls is W, a random state variable.
 *
 * reservoir_init_selection_state computes the initial W value.
 *
 * Given that we've already read t records (t >= n), reservoir_get_next_S
 * determines the number of records to skip before the next record is
 * processed.
 */
It also uses Knuth's optimized version called Algorithm S, where the total number of data to be sampled is known in advance.
/*
 * Since we know the total number of blocks in advance, we can use the
 * straightforward Algorithm S from Knuth 3.4.2, rather than Vitter's
 * algorithm.
 */
The source code actually mentions that the implemented algorithm may deviate from Algorithm S:
/*
 * It is not obvious that this code matches Knuth's Algorithm S.
 * Knuth says to skip the current block with probability 1 - k/K.
 * If we are to skip, we should advance t (hence decrease K), and
 * repeat the same probabilistic test for the next block.
 */
This means PostgreSQL must touch all pages of the table to decide whether to include them in the sample, even if it eventually keeps only 30,000 of them. This explains why larger tables take longer to ANALYZE.
But, all in all, it still seems that analyze runtime depends considerably - even linearly - on the table size! In an email to Postgres Hackers back in 2004, Manfred Koizar mentioned this:
Playing around with some real numbers (for 100 tuples/page and a sample
size of 3000) I got:rel | page size | reads ------+------------- 30 | 30 300 | 300 expectation is something like 299.9995 500 | 499 1K | 990 3K | 2.6K 30K | 8K 100K | 12K 1M | 19K 10M | 26K 100M | 33KThis growth rate is steeper than O(log(nblocks)).
I have an idea how this could be done with O(1) page reads.
What I have in mind is a kind of "Double Vitter" algorithm. Whatever we
do to get our sample of rows, in the end the sampled rows come from no
more than sample_size different blocks. So my idea is to first create a
random sample of sample_size block numbers, and then to sample the rows
out of this pool of blocks.
The idea is implemented in Postgres, as the source code refers to it. However, based on my experiments, the running time of analyze isn't O(1) or O(log(nblocks)), but rather O(nblocks).
Effect of Cache Purging
The drastic increase in analyze time after purging caches highlights the importance of PostgreSQL shared buffers and OS-level caching. Without the cache:
- Each page access becomes a disk I/O operation.
- Disk reads (even from SSDs) are significantly slower than memory access.
- This especially affects large tables where random disk reads dominate the runtime.
This is why, for the 400 million row table, analyze time jumped from ~1.4 seconds to over 8 seconds after cache purging.
Interestingly, the time to analyze did not reduce afterwards, until I ran vacuum:
\timing
Timing is on.

analyze t_400_000_000;
ANALYZE
Time: 8630.107 ms (00:08.640)

analyze t_400_000_000;
ANALYZE
Time: 8706.080 ms (00:08.706)

vacuum t_400_000_000;
VACUUM
Time: 43634.979 ms (00:43.635)

analyze t_400_000_000;
ANALYZE
Time: 1548.534 ms (00:01.549)

analyze t_400_000_000;
ANALYZE
Time: 1434.224 ms (00:01.434)
The reason is probably the sampling: Analyze loads a different sample into RAM each time, leading to a lot of disk I/O when the data is not in RAM. On the other hand, when vacuum is run the first time, it reads all the disk pages, warming up caches.
vacuum freeze is even more agressive, leading to a huge boost in analyze running time:
vacuum freeze t_400_000_000 ;
VACUUM
Time: 70350.355 ms (01:10.350)

analyze t_400_000_000;
ANALYZE
Time: 658.919 ms

analyze t_400_000_000;
ANALYZE
Time: 538.907 ms

analyze t_400_000_000;
ANALYZE
Time: 528.144 ms

analyze t_400_000_000;
ANALYZE
Time: 499.968 ms
Still, after running vacuum freeze on tables of size 100M and 400M rows, the latter takes 4x to analyze, hinting at the linear nature of analyze running time.