


![[The AI Show Episode 144]: ChatGPT’s New Memory, Shopify CEO’s Leaked “AI First” Memo, Google Cloud Next Releases, o3 and o4-mini Coming Soon & Llama 4’s Rocky Launch](https://www.marketingaiinstitute.com/hubfs/ep%20144%20cover.png)


![Is this too much for a modular monolith system? [closed]](https://i.sstatic.net/pYL1nsfg.png)


_Andreas_Prott_Alamy.jpg?width=1280&auto=webp&quality=80&disable=upscale#)


![What features do you get with Gemini Advanced? [April 2025]](https://i0.wp.com/9to5google.com/wp-content/uploads/sites/4/2024/02/gemini-advanced-cover.jpg?resize=1200%2C628&quality=82&strip=all&ssl=1)


![Apple Shares Official Trailer for 'Long Way Home' Starring Ewan McGregor and Charley Boorman [Video]](https://www.iclarified.com/images/news/97069/97069/97069-640.jpg)
![Apple Watch Series 10 Back On Sale for $299! [Lowest Price Ever]](https://www.iclarified.com/images/news/96657/96657/96657-640.jpg)
![EU Postpones Apple App Store Fines Amid Tariff Negotiations [Report]](https://www.iclarified.com/images/news/97068/97068/97068-640.jpg)
![Apple Slips to Fifth in China's Smartphone Market with 9% Decline [Report]](https://www.iclarified.com/images/news/97065/97065/97065-640.jpg)


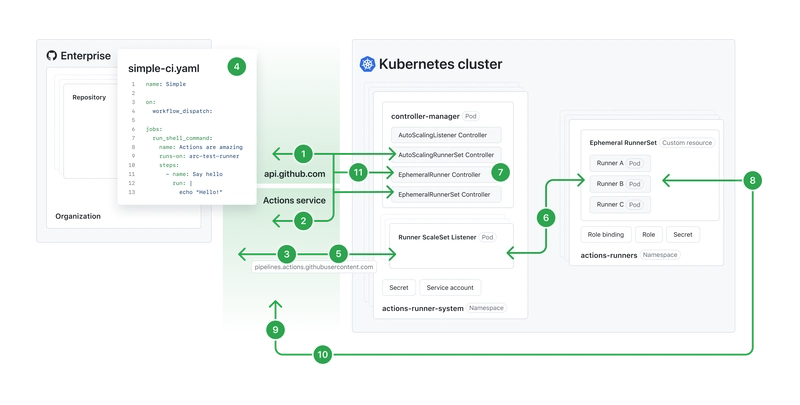
How to Work With HAR Files: A Step-by-Step Guide [With Examples]
Ever spent hours trying to figure out why a webpage loads painfully slow or why an API call keeps failing? HAR files might be the debugging lifeline you need. These HTTP Archive files capture every single interaction between your browser and web servers, revealing the hidden story behind each webpage load. Whether you're a developer hunting down performance bottlenecks, a QA engineer investigating bugs, or an analyst tracking network requests, understanding HAR files is essential for modern web debugging. In fact, they're often the difference between hours of guesswork and precise problem-solving. Ready to master HAR files and streamline your debugging process? This guide will walk you through everything from generating and analyzing HAR files to solving real-world performance issues with practical examples. What is a HAR File and Why It Matters The HTTP Archive format, commonly known as HAR, represents a powerful tool in the web development and debugging arsenal. Understanding what HAR files are and how they function provides the foundation for effectively identifying and solving complex web issues. Definition and format of HAR files HAR (HTTP Archive) files are JSON-formatted log files that record all interactions between a web browser and websites. They function as detailed snapshots capturing every network request, response, and timing information exchanged during webpage loading. When you navigate to a website, your browser makes numerous requests for HTML, CSS, JavaScript, images, and other resources—HAR files document this entire process. The standard file extension for these logs is simply .har . Their JSON structure makes them both human-readable and machine-parsable, enabling easy analysis with specialized tools or text editors. Most modern browsers support HAR file generation, including Chrome, Firefox, Safari, Edge, and Internet Explorer. This widespread support makes HAR files a universal debugging format regardless of your preferred development environment. Unlike packet captures that only show encrypted network traffic, HAR files reveal decrypted application-layer content, providing complete visibility into HTTP transactions. This capability becomes essential when troubleshooting issues that occur after a connection has been established. HAR file structure HAR (HTTP Archive) is a JSON-formatted file with a .har extension. The root element contains a Log object with these components: For detailed specifications, refer to the HAR Specification. Common use cases in debugging and performance HAR files excel at identifying performance bottlenecks and rendering issues that might otherwise remain hidden. They serve several critical functions: - Performance optimization Pinpoint slow-loading elements, track resource timing, and identify opportunities to improve page speed - Error detection Locate failed requests, HTTP error codes (404, 500), and server response issues - Network visualization Generate waterfall charts showing request sequence and dependencies - Security analysis Detect unencrypted connections or problematic redirects that could pose risks - Redirect chain analysis Track complex redirection sequences that might impact user experience For developers and QA engineers, HAR files offer a methodology to compare problematic scenarios with successful ones. By generating HAR files for both working and non-working scenarios, teams can quickly identify what's failing to load properly. Furthermore, HAR files capture cached asset information, helping identify optimization opportunities through improved browser caching policies. They also track the impact of third-party resources, allowing you to assess how external scripts affect overall site performance. When and why you might need one Specific scenarios make HAR files particularly valuable: Performance troubleshooting becomes significantly easier with HAR files when dealing with slow page loads or timeouts during specific tasks. When pages render incorrectly or display missing information, HAR files help identify which resources failed to load properly. Additionally, HAR files prove invaluable when debugging authentication issues. They show the exact sequence of redirects during login transactions, helping pinpoint where authentication flows break down. HAR files become essential when you've exhausted simpler debugging methods. If you're seeing partial page loads where content begins rendering but stops partway through, a HAR file will likely reveal HTTP transaction errors that traditional network monitoring misses. However, they aren't always the best choice. For connection issues occurring before TLS sessions establish—like ERR_CONNECTION_REFUSED errors or DNS problems—packet captures remain the preferred troubleshooting method. These failures happen before HAR logging can begin. When collaborating with technical support teams, HAR files accelerate troubleshootin
![How to Work With HAR Files: A Step-by-Step Guide [With Examples]](https://media2.dev.to/dynamic/image/width=800%2Cheight=%2Cfit=scale-down%2Cgravity=auto%2Cformat=auto/https%3A%2F%2Fdev-to-uploads.s3.amazonaws.com%2Fuploads%2Farticles%2F5wovh8gozs51ofbg0nks.png)
Ever spent hours trying to figure out why a webpage loads painfully slow or why an API call keeps failing?
HAR files might be the debugging lifeline you need. These HTTP Archive files capture every single interaction between your browser and web servers, revealing the hidden story behind each webpage load.
Whether you're a developer hunting down performance bottlenecks, a QA engineer investigating bugs, or an analyst tracking network requests, understanding HAR files is essential for modern web debugging. In fact, they're often the difference between hours of guesswork and precise problem-solving.
Ready to master HAR files and streamline your debugging process? This guide will walk you through everything from generating and analyzing HAR files to solving real-world performance issues with practical examples.
What is a HAR File and Why It Matters
The HTTP Archive format, commonly known as HAR, represents a powerful tool in the web development and debugging arsenal. Understanding what HAR files are and how they function provides the foundation for effectively identifying and solving complex web issues.
Definition and format of HAR files
HAR (HTTP Archive) files are JSON-formatted log files that record all interactions between a web browser and websites. They function as detailed snapshots capturing every network request, response, and timing information exchanged during webpage loading. When you navigate to a website, your browser makes numerous requests for HTML, CSS, JavaScript, images, and other resources—HAR files document this entire process.
The standard file extension for these logs is simply .har . Their JSON structure makes them both human-readable and machine-parsable, enabling easy analysis with specialized tools or text editors.
Most modern browsers support HAR file generation, including Chrome, Firefox, Safari, Edge, and Internet Explorer. This widespread support makes HAR files a universal debugging format regardless of your preferred development environment.
Unlike packet captures that only show encrypted network traffic, HAR files reveal decrypted application-layer content, providing complete visibility into HTTP transactions. This capability becomes essential when troubleshooting issues that occur after a connection has been established.
HAR file structure
HAR (HTTP Archive) is a JSON-formatted file with a .har extension.
The root element contains a Log object with these components:
For detailed specifications, refer to the HAR Specification.
Common use cases in debugging and performance
HAR files excel at identifying performance bottlenecks and rendering issues that might otherwise remain hidden. They serve several critical functions:
- Performance optimization
Pinpoint slow-loading elements, track resource timing, and identify opportunities to improve page speed
- Error detection
Locate failed requests, HTTP error codes (404, 500), and server response issues
- Network visualization
Generate waterfall charts showing request sequence and dependencies
- Security analysis
Detect unencrypted connections or problematic redirects that could pose risks
- Redirect chain analysis
Track complex redirection sequences that might impact user experience
For developers and QA engineers, HAR files offer a methodology to compare problematic scenarios with successful ones. By generating HAR files for both working and non-working scenarios, teams can quickly identify what's failing to load properly.
Furthermore, HAR files capture cached asset information, helping identify optimization opportunities through improved browser caching policies. They also track the impact of third-party resources, allowing you to assess how external scripts affect overall site performance.
When and why you might need one
Specific scenarios make HAR files particularly valuable:
Performance troubleshooting becomes significantly easier with HAR files when dealing with slow page loads or timeouts during specific tasks. When pages render incorrectly or display missing information, HAR files help identify which resources failed to load properly.
Additionally, HAR files prove invaluable when debugging authentication issues. They show the exact sequence of redirects during login transactions, helping pinpoint where authentication flows break down.
HAR files become essential when you've exhausted simpler debugging methods. If you're seeing partial page loads where content begins rendering but stops partway through, a HAR file will likely reveal HTTP transaction errors that traditional network monitoring misses.
However, they aren't always the best choice. For connection issues occurring before TLS sessions establish—like ERR_CONNECTION_REFUSED errors or DNS problems—packet captures remain the preferred troubleshooting method. These failures happen before HAR logging can begin.
When collaborating with technical support teams, HAR files accelerate troubleshooting by providing complete context. Including them in support requests gives analysts an immediate, comprehensive view of the issue, often eliminating rounds of back-and-forth communication.
To maximize their usefulness, remember that comparing multiple HAR files often yields the best insights. Generating logs for both functioning and problematic scenarios creates a clear contrast that helps isolate issues.
How to Generate a HAR File in Any Browser
Generating a HAR file requires accessing your browser's developer tools, which fortunately is straightforward across all major browsers. While the interfaces differ slightly, the core process remains consistent regardless of your preferred browser.
Steps for Chrome, Firefox, Safari, Edge
For Google Chrome:
- Navigate to the webpage where you're experiencing issues
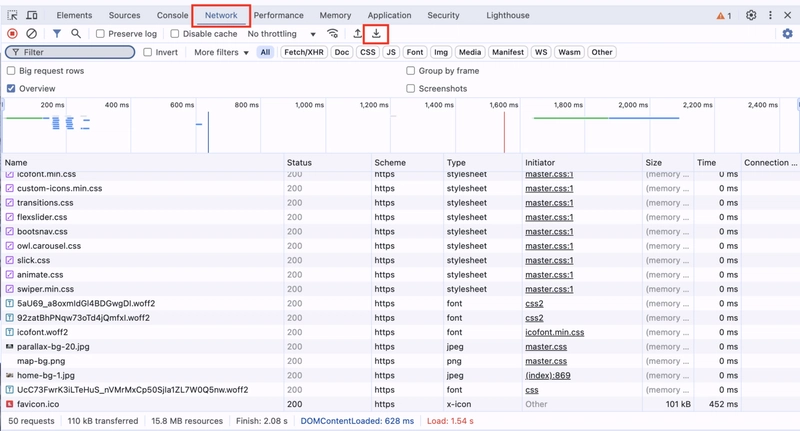
- Right-click anywhere on the page and select Inspect, or press Ctrl+Shift+I (Windows) or Cmd+Option+I (Mac)
- Select the Network tab in the developer tools panel
- Check the Preserve log checkbox to retain information across page loads
- Click the circular record button (if it's not already red) to ensure recording is active
- Click the clear button (trash icon) to remove any existing logs
- Reload the page or perform the actions that trigger your issue
- After reproducing the issue, click the download button (down arrow) labeled Export HAR
- Save the file to your computer with a descriptive name.
For Mozilla Firefox:
- Open the page where the issue occurs
- Press F12 or right-click and select Inspect Element
- Click the Network tab in the developer tools
- The page automatically starts recording as you navigate
- Reproduce the steps that cause the issue
- Right-click anywhere in the File column and select Save All as HAR
- Save the file to your desired location.
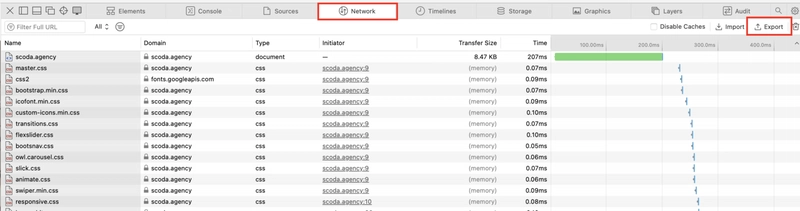
For Safari:
- First, enable the developer menu by going to Safari > Settings > Advanced and checking Show Develop menu in menu bar
- Navigate to the problematic page
- Select Develop from the menu bar, then Show Web Inspector
- Click the Network tab
- Select the Preserve log option
- Reload the page and reproduce the issue
- Click Export in the top right corner of the Network tab
- Save the file to your computer.

Note: Browsers only collect network logs after DevTools is opened. For complete logs, reload the page with DevTools open. The exported HAR file will only contain data from the tab where DevTools was launched.
Obtaining meaningful HAR files requires more than simply following the basic steps. Consider these essential practices to ensure your logs are truly useful:
Start with a clean slate: Always clear your browser cache and cookies before capturing HAR files for troubleshooting. Alternatively, use a private/incognito window to prevent cached resources from skewing your results.
Enable comprehensive logging: Besides checking "Preserve log," also select "Disable cache" in the Network panel. This forces the browser to request fresh copies of all resources, ensuring you capture the complete interaction.
Limit background noise: Close unnecessary tabs and extensions that might generate their own network requests and contaminate your HAR file with irrelevant data.
Record specific actions: Rather than capturing an entire browsing session, focus on the specific action that causes the issue. Start recording immediately before the problematic interaction and stop once it completes.
Document your steps: As you reproduce the issue, take note of exactly what you're doing. This context helps tremendously when analyzing the logs later.
Check for sensitive information: Before sharing HAR files with support teams, remember they contain all request and response data—including authentication tokens and passwords. Open the file in a text editor to redact sensitive information if necessary.
Compare successful and failed attempts: Generate HAR files for both working and non-working scenarios, as comparing them often provides the clearest insights into what's failing.
Once you've generated your HAR file, you can analyze it using specialized tools like the HAR File Analyzer or directly in your browser's developer tools to pinpoint the exact cause of your issues.
Understanding the Key Components of a HAR File
Diving into a HAR file reveals its structured components that provide valuable insights into network transactions. Understanding these elements helps pinpoint exactly where issues occur in web applications.
Request and response headers
At the core of HAR files are the request and response headers, which document the communication between your browser and servers. Each request object contains essential information such as the method (GET, POST), URL, HTTP version, and headers sent by the browser. Correspondingly, the response object captures what the server returns, including headers and content.
Headers are particularly valuable when troubleshooting authentication issues or API integration problems. They reveal how your browser identifies itself, what content types it accepts, and what cookies are being transmitted. Similarly, response headers show content types, caching directives, and security policies implemented by the server.
Status codes and timings
Status codes serve as immediate indicators of request success or failure. Common HTTP status codes include:
- 200 (Success)
- 304 (Not Modified - content is cached)
- 401 (Unauthorized)
- 403 (Forbidden)
- 404 (Page not found/Bad Request)
- 500 (Internal Server Error)
Perhaps the most insightful elements of HAR files are the detailed timing metrics. The timings section breaks down exactly how long each phase of a request takes:
- Blocked: Time spent waiting before sending the request
- DNS: Time required for DNS resolution
- Connect: Duration needed to establish TCP connection
- Wait: Time awaiting server response (TTFB)
- Receive: Time downloading the response
These metrics help identify whether slowdowns stem from server processing (high wait times) or network issues (high receive times). Consequently, you can focus optimization efforts precisely where needed.
Redirect chains and payloads
HAR files excel at documenting redirect chains - sequences of requests where one URL points to another. Through analyzing redirect requests (those with 3xx status codes), you can trace the complete path a browser follows to reach the final destination. This becomes essential when debugging authentication flows or diagnosing unexpected redirection loops.
For each request, you can examine both the sent payload (in POST requests) and received content. This allows developers to verify that APIs are receiving correct parameters and returning expected data formats.
A good HAR File Analyzer will visualize these components, making it easier to spot problematic patterns across dozens or hundreds of requests without manually parsing JSON data.
How to Analyze HAR Files: Step-by-Step
Once you've captured a HAR file, the next crucial step is analyzing it effectively to extract meaningful insights. With the right approach, these files reveal precisely what's causing web performance issues.
Using HAR Viewer or browser tools
After generating a HAR file, you need appropriate tools to interpret it. Several options exist for analyzing these data-rich files:
First, you can use the HAR Viewer (available at softwareishard.com/har/viewer), a free web-based tool that displays a waterfall graph of all network calls. This tool allows you to drill down to specific requests for detailed examination.
Alternatively, your browser's developer tools can directly analyze HAR files. Simply load the HAR file back into the Network panel to examine the recorded session. For more specialized analysis, tools like Google's HAR Analyzer provide advanced filtering and grouping options.
Remember that HAR files contain sensitive data including cookies, personal details, and potentially passwords. Use the redaction option available in some analyzers before sharing these files with third parties.
Identifying slow requests and bottlenecks
To pinpoint performance issues, focus primarily on timing metrics:
- Check the overall transaction time to establish a baseline performance measurement
- Identify the longest bars in the waterfall view, as these represent the slowest requests
- Drill down to specific requests showing excessive delays
When examining slow requests, determine which timing component is responsible:
- Blocked time: Indicates requests waiting in the browser queue
- Wait time: Shows server processing duration—high values (like 1+ seconds) suggest server-side issues [2]
- Receive time: Represents download duration—typically indicates network problems.
For instance, if the wait time is 1.1 seconds while network components total only milliseconds, you've confirmed the bottleneck is server-side [6].
Spotting failed or blocked resources
Identifying errors is relatively straightforward by filtering for non-successful HTTP status codes:
- Look specifically for status codes outside the 200-299 range
- Filter for 400-level errors (client errors) and 500-level errors (server errors)
- Pay attention to 403 (Forbidden) responses that might indicate access problems
For example, a HAR file might reveal numerous 403 responses for specific domains, pointing to content being blocked. Essentially, these patterns help identify which resources fail to load properly, affecting the overall page rendering.
After analysis, you can develop targeted solutions based on your findings—whether optimizing server response times, reducing image sizes, or addressing failed resource requests.
Real-World Examples and Troubleshooting Tips
Armed with your HAR file knowledge, you can now solve real-world problems that previously seemed baffling. Let's explore three common scenarios where HAR files prove invaluable.
Debugging a failed API call
When API endpoints fail mysteriously, HAR files quickly reveal the underlying issues:
- Start by locating the failed request in your HAR file by filtering for non-200 status codes
- Examine the request headers and payload to verify authentication tokens are present and correctly formatted
- Check the response body for detailed error messages that might not appear in your application UI
Frontend developers frequently use this approach when integrating with backend APIs. HAR analysis exposes the exact headers, payloads, and responses exchanged between frontend and backend components, pinpointing integration issues instantly.
Finding the cause of a slow-loading page
Slow performance can stem from multiple sources, all visible within HAR files:
Inspect your HAR data for these common bottlenecks:
- Slow server response times indicated by high "wait" times in timing data—often fixed by optimizing server-side scripts or upgrading hosting
- Unoptimized resources such as oversized images or unminified code—compress images and minify resources to resolve
- Excessive HTTP requests from too many scripts or third-party plugins—combine CSS/JS files and reduce third-party integrations
- Third-party script delays from ads or analytics—evaluate necessity and implement asynchronous loading
For performance monitoring, HAR analysis efficiently identifies these bottlenecks, enabling developers to target specific requests that create issues.
Detecting redirect loops or 404 errors
HAR files excel at uncovering navigation problems:
To debug redirect chains, locate requests with 3xx status codes and analyze their details. Follow the chain by examining the "Location" header in each redirect response and validate target URLs reach expected destinations.
Meanwhile, for missing resources, filter your HAR file by status code 404. These missing files often cause rendering failures or broken functionality. Comparing working and non-working HAR captures remains the fastest way to identify what's failing to load properly.
Through systematic analysis of HTTP status codes, timing data, and request patterns in your HAR files, most web performance mysteries become solvable puzzles.
Conclusion
HAR files stand as powerful allies for developers and technical professionals seeking to solve complex web performance issues. These detailed HTTP transaction logs provide clear visibility into network requests, server responses, and timing data that might otherwise remain hidden.
Understanding HAR files transforms troubleshooting from guesswork into precise problem-solving. Armed with knowledge about generating, analyzing, and interpreting these files, developers can quickly identify bottlenecks, debug API failures, and resolve redirect issues.
Most importantly, HAR files offer consistent debugging capabilities across all major browsers, making them essential tools regardless of your development environment. Regular HAR analysis helps maintain optimal website performance, detect potential issues early, and ensure smooth user experiences.
Remember that effective HAR file usage requires both technical understanding and systematic analysis. Start with clean captures, focus on specific issues, and always compare working scenarios against problematic ones for the most accurate insights.
About Webvizio
Webvizio employs a unique visual collaboration platform that speeds up web development by generating comprehensive one-click tasks on top of web pages enriched with all visual and technical data.
The new Webvizio Prompts for AI Coding Agents feature helps transform non-technical feedback and issue reports into detailed prompts for AI coding agents, such as Cursor, Tabnine, and Windsurf.
Sources:
[1] - https://en.wikipedia.org/wiki/HAR_(file_format)
[2] - https://webvizio.com/blog/how-to-download-view-and-analyze-har-files/
[3] - https://confluence.atlassian.com/display/KB/Generating+HAR+files+and+analyzing+web+requests
[4] - https://www.linkedin.com/pulse/har-files-deep-dive-web-performance-monitoring-nadir-riyani-mcpzf
[5] - https://www.keysight.com/blogs/en/tech/nwvs/2022/05/27/a-comprehensive-guide-on-har-files
[6] - https://auth0.com/docs/troubleshoot/troubleshooting-tools/generate-and-analyze-har-files
[7] - https://www.perfecto.io/blog/how-use-har-file-find-hidden-performance-bottlenecks-your-app
[8] - https://toolbox.googleapps.com/apps/har_analyzer/
[9] - https://support.catonetworks.com/hc/en-us/articles/10038538807581-How-to-Use-HAR-File-to-Analyze-Webpage-Issues
[10] - https://dev.to/requestlyio/what-is-a-har-file-and-how-to-analyze-them-1d2d
[11] - https://www.browserstack.com/guide/http-archive-har-files
[12] - https://documentation.meraki.com/General_Administration/Tools_and_Troubleshooting/Using_HAR_Files_to_Troubleshoot_Web_Pages_that_are_Failing_to_Fully_Load


![Dashboard for Researchers & Geneticists: Functional Requirements [System Design]](https://media2.dev.to/dynamic/image/width=800%2Cheight=%2Cfit=scale-down%2Cgravity=auto%2Cformat=auto/https%3A%2F%2Fdev-to-uploads.s3.amazonaws.com%2Fuploads%2Farticles%2F37i2spw6bi3fa17c5xqe.png)