Building an End-to-End ELT Pipeline: PostgreSQL BigQuery Metabase
ETL/ELT projects are never just about moving data—they’re about designing efficient, scalable, and maintainable pipelines. In this post, I’ll walk through how I built a full ELT process using PostgreSQL, Airflow, BigQuery, and dbt, along with lessons I learned along the way. The Tech Stack Data Source: Brazilian e-commerce dataset (CSV files) Data Storage: PostgreSQL as the staging database Orchestration: Apache Airflow to automate the ETL workflow Data Warehousing: Google Cloud Storage, Google BigQuery Transformation: dbt (Data Build Tool) for modeling Visualization: Metabase for dashboarding Step 1: Data Ingestion I downloaded the csv files from Kaggle, then I used Airflow to automate loading the dataset into PostgreSQL. The biggest challenge? Handling the geolocation dataset (1M+ rows!) without performance issues. Step 2: Orchestrating with Airflow I created DAGs to move data from PostgreSQL to BigQuery using Airflow operators (PostgresToGCS → GCSToBigQuery). This setup ensured automated and reliable data movement. Step 3: Transforming with dbt My dbt models were structured into: Staging – Cleaning raw data Intermediate – Joining and reshaping Marts – Final tables for analytics I added basic tests to ensure data integrity (e.g., uniqueness checks). Step 4: Visualization in Metabase After loading transformed data into BigQuery, I built a Metabase dashboard for insights. This was where the pipeline came to life! Lessons Learned This project was an eye-opener in many ways. Orchestration is More Than Just Running Tasks: First, working with Airflow tested my patience. Debugging DAG failures—especially silent ones—was frustrating but rewarding when I finally got everything running smoothly. I learned to check logs meticulously and not just rely on UI-based error messages. Dealing with Large Datasets is Tricky: I hit a roadblock when trying to ingest the geolocation dataset into PostgreSQL because it had over a million rows. It made me realize that blindly loading data without thinking about performance can be a nightmare. Next time, I’d explore partitioning, indexing, or even alternative storage formats like Parquet to improve performance. dbt is a Game-Changer for Data Transformations: Before this project, I hadn’t fully grasped why dbt is so popular. Now, I see the beauty in modular transformations, clear model dependencies, and automated testing. Writing SQL in a structured, scalable way is a game-changer. Visualization is the Final Mile: Building the dashboard in Metabase made me appreciate how important it is to structure data properly for end users. Raw data alone means nothing until it’s turned into insights people can understand. Simplicity is key—too many metrics can overwhelm users instead of helping them make decisions. Documentation Matters: I’ll be honest, writing documentation felt like an afterthought at first. But looking back, having clear, step-by-step documentation makes this project reusable for anyone (including my future self!). Overall, this project reinforced my problem-solving skills, patience, and ability to adapt to different tools. Next time, I’d plan error-handling mechanisms upfront instead of treating them as an afterthought. But most importantly, I’ve realized that no data pipeline is truly “done”—there’s always room for improvement Want to See the project? I documented the entire process with step-by-step instructions. Check it out here: GitHub Feel free to reach out if you have any questions or just want to connect! LinkedIn
ETL/ELT projects are never just about moving data—they’re about designing efficient, scalable, and maintainable pipelines. In this post, I’ll walk through how I built a full ELT process using PostgreSQL, Airflow, BigQuery, and dbt, along with lessons I learned along the way.
The Tech Stack
- Data Source: Brazilian e-commerce dataset (CSV files)
- Data Storage: PostgreSQL as the staging database
- Orchestration: Apache Airflow to automate the ETL workflow
- Data Warehousing: Google Cloud Storage, Google BigQuery
- Transformation: dbt (Data Build Tool) for modeling
- Visualization: Metabase for dashboarding
Step 1: Data Ingestion
I downloaded the csv files from Kaggle, then I used Airflow to automate loading the dataset into PostgreSQL. The biggest challenge? Handling the geolocation dataset (1M+ rows!) without performance issues.
Step 2: Orchestrating with Airflow
I created DAGs to move data from PostgreSQL to BigQuery using Airflow operators (PostgresToGCS → GCSToBigQuery). This setup ensured automated and reliable data movement.
Step 3: Transforming with dbt
My dbt models were structured into:
- Staging – Cleaning raw data
- Intermediate – Joining and reshaping
- Marts – Final tables for analytics I added basic tests to ensure data integrity (e.g., uniqueness checks).
Step 4: Visualization in Metabase
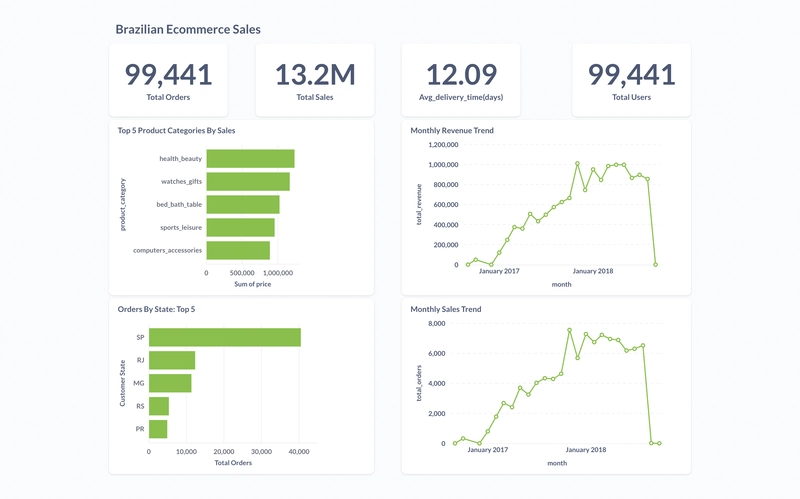
After loading transformed data into BigQuery, I built a Metabase dashboard for insights. This was where the pipeline came to life!
Lessons Learned
This project was an eye-opener in many ways.
Orchestration is More Than Just Running Tasks: First, working with Airflow tested my patience. Debugging DAG failures—especially silent ones—was frustrating but rewarding when I finally got everything running smoothly. I learned to check logs meticulously and not just rely on UI-based error messages.
Dealing with Large Datasets is Tricky: I hit a roadblock when trying to ingest the geolocation dataset into PostgreSQL because it had over a million rows. It made me realize that blindly loading data without thinking about performance can be a nightmare. Next time, I’d explore partitioning, indexing, or even alternative storage formats like Parquet to improve performance.
dbt is a Game-Changer for Data Transformations: Before this project, I hadn’t fully grasped why dbt is so popular. Now, I see the beauty in modular transformations, clear model dependencies, and automated testing. Writing SQL in a structured, scalable way is a game-changer.
Visualization is the Final Mile: Building the dashboard in Metabase made me appreciate how important it is to structure data properly for end users. Raw data alone means nothing until it’s turned into insights people can understand. Simplicity is key—too many metrics can overwhelm users instead of helping them make decisions.
Documentation Matters: I’ll be honest, writing documentation felt like an afterthought at first. But looking back, having clear, step-by-step documentation makes this project reusable for anyone (including my future self!).
Overall, this project reinforced my problem-solving skills, patience, and ability to adapt to different tools. Next time, I’d plan error-handling mechanisms upfront instead of treating them as an afterthought. But most importantly, I’ve realized that no data pipeline is truly “done”—there’s always room for improvement
Want to See the project?
I documented the entire process with step-by-step instructions.
- Check it out here: GitHub
Feel free to reach out if you have any questions or just want to connect!












![[The AI Show Episode 142]: ChatGPT’s New Image Generator, Studio Ghibli Craze and Backlash, Gemini 2.5, OpenAI Academy, 4o Updates, Vibe Marketing & xAI Acquires X](https://www.marketingaiinstitute.com/hubfs/ep%20142%20cover.png)

























![[FREE EBOOKS] The Kubernetes Bible, The Ultimate Linux Shell Scripting Guide & Four More Best Selling Titles](https://www.javacodegeeks.com/wp-content/uploads/2012/12/jcg-logo.jpg)


![From drop-out to software architect with Jason Lengstorf [Podcast #167]](https://cdn.hashnode.com/res/hashnode/image/upload/v1743796461357/f3d19cd7-e6f5-4d7c-8bfc-eb974bc8da68.png?#)











.png?#)


.jpg?#)







_Christophe_Coat_Alamy.jpg?#)


![Rapidus in Talks With Apple as It Accelerates Toward 2nm Chip Production [Report]](https://www.iclarified.com/images/news/96937/96937/96937-640.jpg)


