


![[The AI Show Episode 143]: ChatGPT Revenue Surge, New AGI Timelines, Amazon’s AI Agent, Claude for Education, Model Context Protocol & LLMs Pass the Turing Test](https://www.marketingaiinstitute.com/hubfs/ep%20143%20cover.png)


.jpg?#)


_Muhammad_R._Fakhrurrozi_Alamy.jpg?width=1280&auto=webp&quality=80&disable=upscale#)
_NicoElNino_Alamy.jpg?width=1280&auto=webp&quality=80&disable=upscale#)


![M4 MacBook Air Drops to Just $849 - Act Fast! [Lowest Price Ever]](https://www.iclarified.com/images/news/97140/97140/97140-640.jpg)
![Apple Smart Glasses Not Close to Being Ready as Meta Targets 2025 [Gurman]](https://www.iclarified.com/images/news/97139/97139/97139-640.jpg)
![iPadOS 19 May Introduce Menu Bar, iOS 19 to Support External Displays [Rumor]](https://www.iclarified.com/images/news/97137/97137/97137-640.jpg)


Boost Angular Performance: Real-World Optimization Case Study
TL;DR Performance optimization often comes down to small, well-measured improvements. In this article, we take a concrete Angular use case — rendering thousands of live-updating components — and optimize it step by step. With each adjustment, we measure the impact using profiling tools like Lighthouse and DevTools, focusing not only on what to change, but why it works. Introduction I’ve been developing applications with Angular for around 13 years now. Some of these were very classical frontend applications where most of the complexity resided in the backend and performance optimizations had to be done there (SQL optimization, backend code profiling, cache management, infrastructure adjustments, architecture adjustments…). Others had much more complex characteristics on the frontend that needed deep optimisations to keep a good user experience. This journey has given me a lot of opportunities to find typical bottlenecks, performance issues, and how to avoid them. Along the way, I’ve read a lot of articles on that topic, but it often felt like the same recycled stuff again and again, filled with pretty vague advice rather than concrete code examples, that would have highlighted what’s the issue, what would be the solution and provided profiling metrics to measure how effective the provided solution is. The objective of this article is to provide a full example of code optimisation with Angular, in the specific case of a UI managing a lot of elements. Don’t get me wrong, many of the tips here may sound familiar, but I’ll try to bring more context for each tip, as well as performance profiling analysis to help grasp what happens behind the scenes. My rationale is the following : if you can understand the underlying reasons why you’re applying a fix or a pattern (instead of applying it blindly because you’ve read somewhere that it’s better for some reason), you’ll get better at finding problems early in your applications and coming up with the right solutions. About the example application The application used as an example here illustrates a situation I encountered a few years ago, simplified to the bare minimum for the sake of clarity. One of the specificities of this application is that it grew in a way that it ended up needing to display tens of thousands of independant components, all synchronized live across all users through WebSocket messages. To illustrate this issue, we’ll start with a very simple application displaying a list of products, and for each of these products, a daily quantity and status for a given period. To simulate live modifications that should be received through WebSocket messages in the real application, random incrementations will be performed on order quantities and dispatched through an observable. The objective is to end up with an application able to handle hundreds of products over multiple years (hundreds of columns for daily quantities) and to be able to display updates with close to no delay. Base architecture This test application provides 2 sections : a settings section allowing to manage how many datapoints we want to manage, and to toggle random modifications simulation ; a table displaying the datapoints (quantity, status) and highlighting the cells that were recently modified, to visually help seeing the modifications live in that sea of data. Here is the global directory structure we’re starting with : Here is the global directory structure we’re starting with : src/ ├── app/ │ └── orders/ │ ├── components/ │ │ ├── order-table/ # The list of orders │ │ └── preference-controls/ # The list of settings (date start, date end, number of lines...) │ ├── models/ # model files │ ├── pipes/ # pipes used across the orders module │ └── services/ # services for managing orders data, user preferences, cache... ├── index.html ├── main.ts ├── styles.scss └── other typical Angular project files... Part 1 — Display performance Profiling and problems identification The first thing to do is to profile the loading performance of the page. For that, we’re going to use Lighthouse : open your application in private mode and ensure no extension is activated as it can have significant impact on performance, especially on applications with a lot of DOM elements. open your Chrome debugger and got to the Lighthouse tab. for this test, we’re only interested in performances profiling, so you can uncheck the other categories. choose computer as the device and launch the analysis. After a minute, here is what we get : Just for displaying our data, with no other interaction, a first contentful paint at almost 3 seconds is far from good. There are multiple reasons for that, some of which are explicitly highligted by Lighthouse. Main issues identification Let’s inspect main issues h
TL;DR
Performance optimization often comes down to small, well-measured improvements. In this article, we take a concrete Angular use case — rendering thousands of live-updating components — and optimize it step by step. With each adjustment, we measure the impact using profiling tools like Lighthouse and DevTools, focusing not only on what to change, but why it works.
Introduction
I’ve been developing applications with Angular for around 13 years now. Some of these were very classical frontend applications where most of the complexity resided in the backend and performance optimizations had to be done there (SQL optimization, backend code profiling, cache management, infrastructure adjustments, architecture adjustments…). Others had much more complex characteristics on the frontend that needed deep optimisations to keep a good user experience.
This journey has given me a lot of opportunities to find typical bottlenecks, performance issues, and how to avoid them. Along the way, I’ve read a lot of articles on that topic, but it often felt like the same recycled stuff again and again, filled with pretty vague advice rather than concrete code examples, that would have highlighted what’s the issue, what would be the solution and provided profiling metrics to measure how effective the provided solution is.
The objective of this article is to provide a full example of code optimisation with Angular, in the specific case of a UI managing a lot of elements.
Don’t get me wrong, many of the tips here may sound familiar, but I’ll try to bring more context for each tip, as well as performance profiling analysis to help grasp what happens behind the scenes.
My rationale is the following : if you can understand the underlying reasons why you’re applying a fix or a pattern (instead of applying it blindly because you’ve read somewhere that it’s better for some reason), you’ll get better at finding problems early in your applications and coming up with the right solutions.
About the example application
The application used as an example here illustrates a situation I encountered a few years ago, simplified to the bare minimum for the sake of clarity. One of the specificities of this application is that it grew in a way that it ended up needing to display tens of thousands of independant components, all synchronized live across all users through WebSocket messages.
To illustrate this issue, we’ll start with a very simple application displaying a list of products, and for each of these products, a daily quantity and status for a given period. To simulate live modifications that should be received through WebSocket messages in the real application, random incrementations will be performed on order quantities and dispatched through an observable.
The objective is to end up with an application able to handle hundreds of products over multiple years (hundreds of columns for daily quantities) and to be able to display updates with close to no delay.
Base architecture
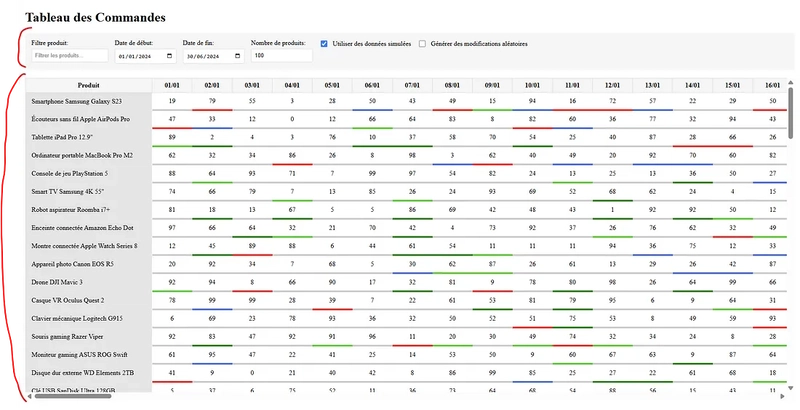
This test application provides 2 sections :
- a
settings sectionallowing to manage how many datapoints we want to manage, and to toggle random modifications simulation ; - a
table displaying the datapoints(quantity, status) and highlighting the cells that were recently modified, to visually help seeing the modifications live in that sea of data. Here is the global directory structure we’re starting with :
Here is the global directory structure we’re starting with :
src/
├── app/
│   └── orders/
│       ├── components/
│       │   ├── order-table/             # The list of orders
│       │   └── preference-controls/     # The list of settings (date start, date end, number of lines...)
│       ├── models/                      # model files
│       ├── pipes/                       # pipes used across the orders module
│       └── services/                    # services for managing orders data, user preferences, cache...
├── index.html
├── main.ts
├── styles.scss
└── other typical Angular project files...
Part 1 — Display performance
Profiling and problems identification
The first thing to do is to profile the loading performance of the page. For that, we’re going to use Lighthouse :
- open your application in private mode and ensure no extension is activated as it can have significant impact on performance, especially on applications with a lot of DOM elements.
- open your Chrome debugger and got to the Lighthouse tab.
- for this test, we’re only interested in performances profiling, so you can uncheck the other categories.
- choose computer as the device and launch the analysis.
After a minute, here is what we get :
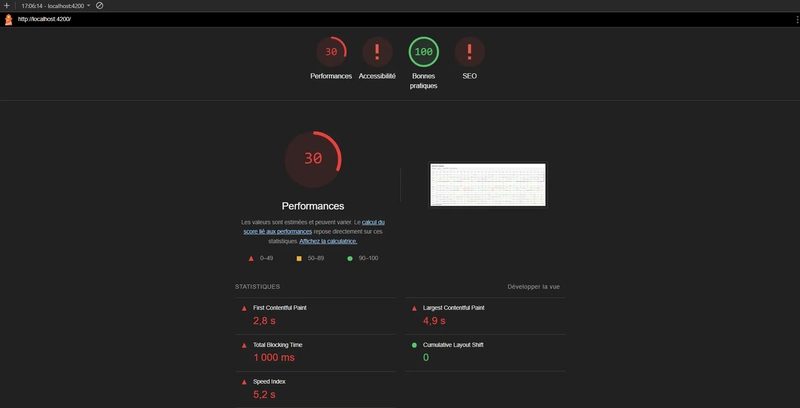
Just for displaying our data, with no other interaction, a first contentful paint at almost 3 seconds is far from good. There are multiple reasons for that, some of which are explicitly highligted by Lighthouse.
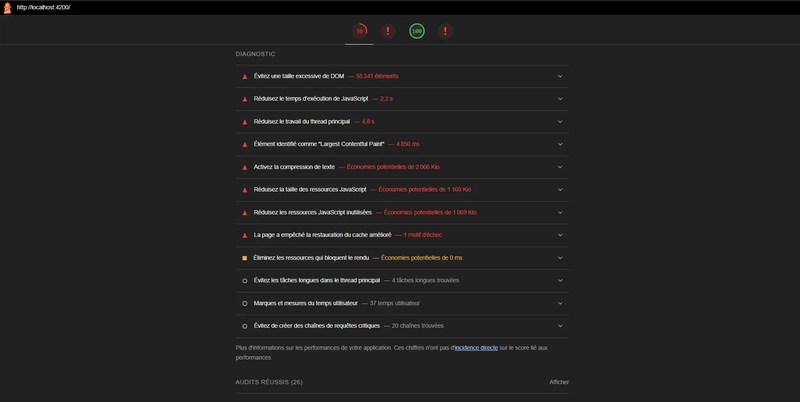
Main issues identification
Let’s inspect main issues highlighted there.