


![[The AI Show Episode 144]: ChatGPT’s New Memory, Shopify CEO’s Leaked “AI First” Memo, Google Cloud Next Releases, o3 and o4-mini Coming Soon & Llama 4’s Rocky Launch](https://www.marketingaiinstitute.com/hubfs/ep%20144%20cover.png)


![Is This Programming Paradigm New? [closed]](https://miro.medium.com/v2/resize:fit:1200/format:webp/1*nKR2930riHA4VC7dLwIuxA.gif)


(1).jpg?#)
.jpg?#)


-Classic-Nintendo-GameCube-games-are-coming-to-Nintendo-Switch-2!-00-00-13.png?width=1920&height=1920&fit=bounds&quality=70&format=jpg&auto=webp#)


_Olekcii_Mach_Alamy.jpg?width=1280&auto=webp&quality=80&disable=upscale#)


![M4 MacBook Air Drops to New All-Time Low of $912 [Deal]](https://www.iclarified.com/images/news/97108/97108/97108-640.jpg)
![New iPhone 17 Dummy Models Surface in Black and White [Images]](https://www.iclarified.com/images/news/97106/97106/97106-640.jpg)


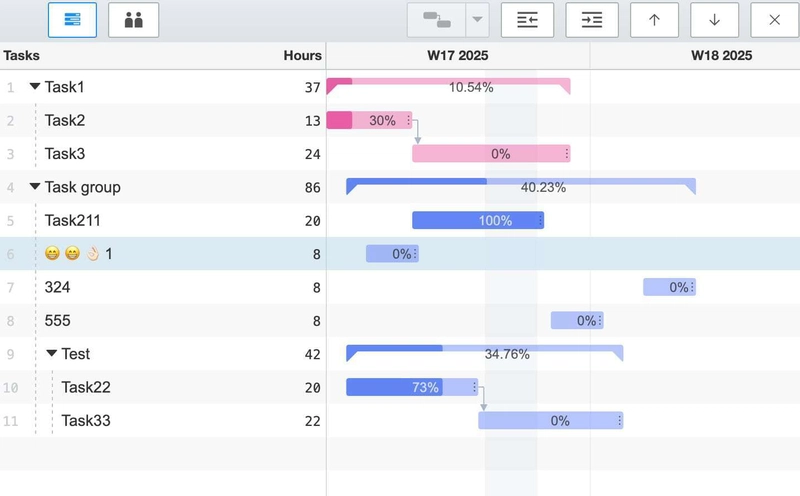
An Online Gantt Chart Generator
Go to https://gantt-online.com/ and click the Create Gantt chart button. You can directly edit or add tasks by clicking on the task name (press Enter to add a task), and then click the "Save" button in the top right corner. The URL in your browser will now display the unique hash address for this Gantt chart, allowing you to open this link and continue editing later. For example: https://gantt-online.com/gatt/5a961c12eee956135f961c4e88 Click the Share tool in the top right corner to get the SVG format online link of the Gantt chart. For example : https://gantt-online.com/api/svg/5a961c12eee956135f961c4e88/?lang=en&zone=8 The SVG image contains two parameters (which you can modify yourself): lang (language): en, zh-cn, zh-tw, ja, ko, fr, de, es, pt (9 languages) zone (timezone): -12 to +12 Since this image is online, the image will automatically refresh with the latest version after you make changes to the Gantt chart. If you reference this image in other documents, it will stay up-to-date in real time, making it perfect for project planning and progress tracking. If you prefer to download the image, PNG format is also available. For larger projects with a longer timeline, you can adjust the date granularity by dragging. The granularity supports three options: day, week, and month. The task sidebar can also be adjusted or hidden as needed.
Go to https://gantt-online.com/ and click the Create Gantt chart button. You can directly edit or add tasks by clicking on the task name (press Enter to add a task), and then click the "Save" button in the top right corner. The URL in your browser will now display the unique hash address for this Gantt chart, allowing you to open this link and continue editing later.
For example: https://gantt-online.com/gatt/5a961c12eee956135f961c4e88
Click the Share tool in the top right corner to get the SVG format online link of the Gantt chart.
For example : https://gantt-online.com/api/svg/5a961c12eee956135f961c4e88/?lang=en&zone=8
The SVG image contains two parameters (which you can modify yourself):
-
lang (language):
en,zh-cn,zh-tw,ja,ko,fr,de,es,pt(9 languages) -
zone (timezone):
-12to+12
Since this image is online, the image will automatically refresh with the latest version after you make changes to the Gantt chart. If you reference this image in other documents, it will stay up-to-date in real time, making it perfect for project planning and progress tracking.
If you prefer to download the image, PNG format is also available.
For larger projects with a longer timeline, you can adjust the date granularity by dragging. The granularity supports three options: day, week, and month.
The task sidebar can also be adjusted or hidden as needed.