


![[The AI Show Episode 143]: ChatGPT Revenue Surge, New AGI Timelines, Amazon’s AI Agent, Claude for Education, Model Context Protocol & LLMs Pass the Turing Test](https://www.marketingaiinstitute.com/hubfs/ep%20143%20cover.png)


_Muhammad_R._Fakhrurrozi_Alamy.jpg?width=1280&auto=webp&quality=80&disable=upscale#)
_NicoElNino_Alamy.jpg?width=1280&auto=webp&quality=80&disable=upscale#)


![What Google Messages features are rolling out [April 2025]](https://i0.wp.com/9to5google.com/wp-content/uploads/sites/4/2023/12/google-messages-name-cover.png?resize=1200%2C628&quality=82&strip=all&ssl=1)


![M4 MacBook Air Drops to Just $849 - Act Fast! [Lowest Price Ever]](https://www.iclarified.com/images/news/97140/97140/97140-640.jpg)
![Apple Smart Glasses Not Close to Being Ready as Meta Targets 2025 [Gurman]](https://www.iclarified.com/images/news/97139/97139/97139-640.jpg)
![iPadOS 19 May Introduce Menu Bar, iOS 19 to Support External Displays [Rumor]](https://www.iclarified.com/images/news/97137/97137/97137-640.jpg)


6 Essential Steps of Data Cleaning Every Data Analyst Should Know in MS Excel
Data cleaning is a fundamental step in data analysis, ensuring datasets are accurate, consistent, and ready for analysis. Microsoft Excel provides powerful tools to clean data efficiently. In this guide we will explore six critical steps for effective data cleaning in Excel, complete with formulas, functions, and best practices. Step 1: Explore the Dataset Before cleaning, understand your dataset’s structure, sources, and potential issues. Here is how we will go about it; 1.Identify Data Sources: Check if data is imported from CSV, SQL, or manual entry. Use Data → Get Data → From File/DB for structured imports. 2.Understand Data Types: Check your data columns and ensure the content format matches. Columns with numbers should be consistent, likewise to columns with texts and dates formats. Use these formulars to achieve consistency in data types. Text vs. Numbers: Use ISTEXT(), ISNUMBER(). Dates: Verify with ISDATE() (custom VBA may be needed). 3.Spot Data Quality Issues: Filters: Sort columns to spot inconsistencies. use Data → Sort & Filter Conditional Formatting: Highlight blanks, errors, or outliers. use → Home → styles → conditional formatting To remove blanks, shortcut ctr + G → special → blanks Data Validation: Set rules (e.g., age must be 18+). Step 2: Handle Missing Data Missing values can distort analysis giving inaccurate or misleading insights. This can be costly, and to avoid this, you can decide whether to delete or impute them. Below are other ways of dealing with missing data Start by finding the Missing Data: =COUNTBLANK(A2:A100) → Counts empty cells. =IF(ISBLANK(A2), "Missing", "Present") → Tags missing values. Step 3: Remove Duplicates Duplicate records like blanks can bias results Make sure to eliminate them while keeping unique entries. Find Duplicates: Data → data tools → duplicates After running the "find duplicates" command we can use conditional formatting to highlight the duplicates or remove the duplicates Conditional Formatting → Highlight Duplicates Step 4: Handle Formatting Issues Inconsistent formatting leads to errors Here is how you can standardize text, dates, and units. 1.Fix Text Cases: =UPPER(A2) (ALL CAPS) =PROPER(A2) (Title Case) =TRIM(A2) (Remove spaces) 2.Standardize Dates: =DATEVALUE(TEXT(A2, "mm/dd/yyyy")) → Converts text to date. 3.Convert Units: Miles to KM: =A2*1.60934 Step 5: Manage Outliers Outliers can skew statistics, and it is important to detect and handle them appropriately. The best action to take is remove outliers by filtering and deleting extreme values. Step 6: Validate Data Ensure cleaned data matches source integrity and business rules. Below is how you can go about; 1.Cross-Check with Original Data: Use VLOOKUP() to compare cleaned vs. raw data. 2.Test Business Rules: =IF(AND(B2>=18, B2
Data cleaning is a fundamental step in data analysis, ensuring datasets are accurate, consistent, and ready for analysis.
Microsoft Excel provides powerful tools to clean data efficiently.
In this guide we will explore six critical steps for effective data cleaning in Excel, complete with formulas, functions, and best practices.
Step 1: Explore the Dataset
Before cleaning, understand your dataset’s structure, sources, and potential issues.
Here is how we will go about it;
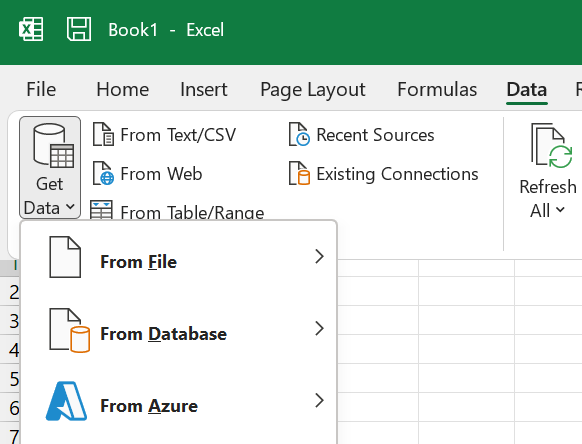
1.Identify Data Sources:
Check if data is imported from CSV, SQL, or manual entry.
Use Data → Get Data → From File/DB for structured imports.
2.Understand Data Types:
Check your data columns and ensure the content format matches.
Columns with numbers should be consistent, likewise to columns with texts and dates formats.
Use these formulars to achieve consistency in data types.
Text vs. Numbers: Use ISTEXT(), ISNUMBER().
Dates: Verify with ISDATE() (custom VBA may be needed).
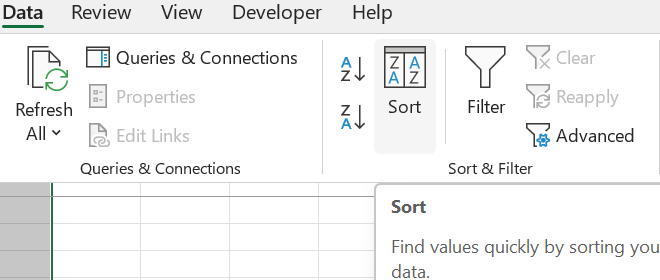
3.Spot Data Quality Issues:
Filters: Sort columns to spot inconsistencies.
use Data → Sort & Filter
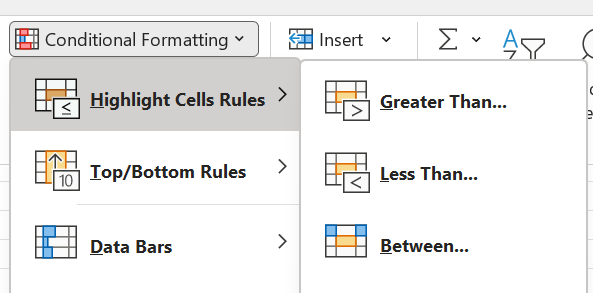
Conditional Formatting: Highlight blanks, errors, or outliers.
use → Home → styles → conditional formatting
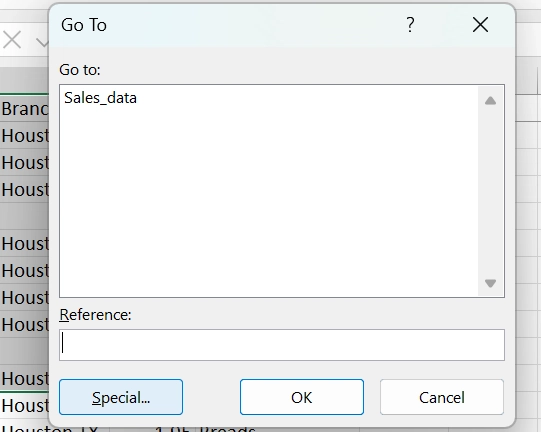
To remove blanks, shortcut ctr + G → special → blanks
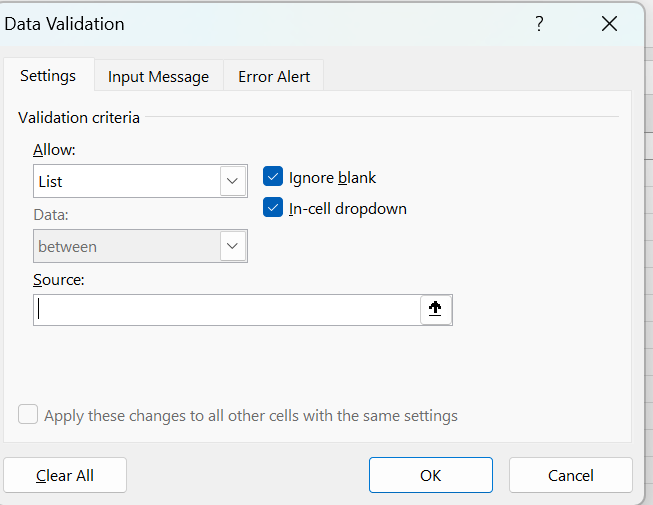
Data Validation: Set rules (e.g., age must be 18+).
Step 2: Handle Missing Data
Missing values can distort analysis giving inaccurate or misleading insights. This can be costly, and to avoid this, you can decide whether to delete or impute them.
Below are other ways of dealing with missing data
Start by finding the Missing Data:
=COUNTBLANK(A2:A100) → Counts empty cells.
=IF(ISBLANK(A2), "Missing", "Present") → Tags missing values.
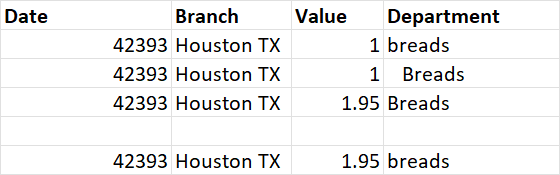
Step 3: Remove Duplicates
Duplicate records like blanks can bias results
Make sure to eliminate them while keeping unique entries.
Find Duplicates:
Data → data tools → duplicates
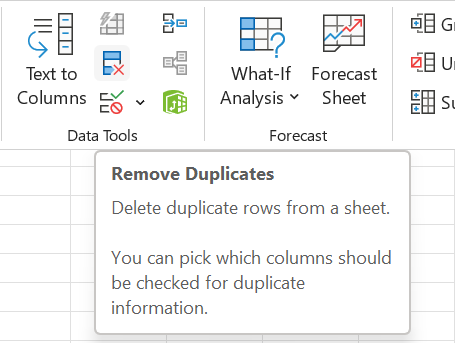
After running the "find duplicates" command we can use conditional formatting to highlight the duplicates or remove the duplicates
Conditional Formatting → Highlight Duplicates
Step 4: Handle Formatting Issues
Inconsistent formatting leads to errors
Here is how you can standardize text, dates, and units.
1.Fix Text Cases:
=UPPER(A2) (ALL CAPS)
=PROPER(A2) (Title Case)
=TRIM(A2) (Remove spaces)
2.Standardize Dates:
=DATEVALUE(TEXT(A2, "mm/dd/yyyy")) → Converts text to date.
3.Convert Units:
Miles to KM: =A2*1.60934
Step 5: Manage Outliers
Outliers can skew statistics, and it is important to detect and handle them appropriately.
The best action to take is remove outliers by filtering and deleting extreme values.
Step 6: Validate Data
Ensure cleaned data matches source integrity and business rules.
Below is how you can go about;
1.Cross-Check with Original Data:
Use VLOOKUP() to compare cleaned vs. raw data.
2.Test Business Rules:
=IF(AND(B2>=18, B2<=65), "Valid", "Invalid")
3.Check Consistency:
Age vs. Birth Year: =YEAR(TODAY())-B2